Predicting Social Determinants of Health in Patient Navigation: Case Study
←
→
Page content transcription
If your browser does not render page correctly, please read the page content below

JMIR FORMATIVE RESEARCH                                                                                                             Iacobelli et al

     Original Paper

     Predicting Social Determinants of Health in Patient Navigation:
     Case Study

     Francisco Iacobelli1,2*, PhD; Anna Yang3,4*, BA; Laura Tom3,4*, MS; Ivy S Leung3,4*, BFA; John Crissman1*, MSc;
     Rufino Salgado1*, MSc; Melissa Simon3,4,5*, MD, MPH
     1
      Department of Computer Science, Northeastern Illinois University, Chicago, IL, United States
     2
      Center for Advancing Safety of Machine Intelligence, Northwestern University, Evanston, IL, United States
     3
      Center for Health Equity Transformation, Feinberg School of Medicine Chicago, Northwestern University, Chicago, IL, United States
     4
      Department of Obstetrics and Gynecology, Feinberg School of Medicine Chicago, Northwestern University, Chicago, IL, United States
     5
      Robert H. Lurie Comprehensive Cancer Center, Feinberg School of Medicine Chicago, Northwestern University, Chicago, IL, United States
     *
      all authors contributed equally

     Corresponding Author:
     Francisco Iacobelli, PhD
     Department of Computer Science
     Northeastern Illinois University
     5500 N. St. Louis Ave.
     Chicago, IL, 60625
     United States
     Phone: 1 7734424728
     Email: fdiacobe@neiu.edu

     Abstract
     Background: Patient navigation (PN) programs have demonstrated efficacy in improving health outcomes for marginalized
     populations across a range of clinical contexts by addressing barriers to health care, including social determinants of health
     (SDoHs). However, it can be challenging for navigators to identify SDoHs by asking patients directly because of many factors,
     including patients’ reluctance to disclose information, communication barriers, and the variable resources and experience levels
     of patient navigators. Navigators could benefit from strategies that augment their ability to gather SDoH data. Machine learning
     can be leveraged as one of these strategies to identify SDoH-related barriers. This could further improve health outcomes,
     particularly in underserved populations.
     Objective: In this formative study, we explored novel machine learning–based approaches to predict SDoHs in 2 Chicago area
     PN studies. In the first approach, we applied machine learning to data that include comments and interaction details between
     patients and navigators, whereas the second approach augmented patients’ demographic information. This paper presents the
     results of these experiments and provides recommendations for data collection and the application of machine learning techniques
     more generally to the problem of predicting SDoHs.
     Methods: We conducted 2 experiments to explore the feasibility of using machine learning to predict patients’ SDoHs using
     data collected from PN research. The machine learning algorithms were trained on data collected from 2 Chicago area PN studies.
     In the first experiment, we compared several machine learning algorithms (logistic regression, random forest, support vector
     machine, artificial neural network, and Gaussian naive Bayes) to predict SDoHs from both patient demographics and navigator’s
     encounter data over time. In the second experiment, we used multiclass classification with augmented information, such as
     transportation time to a hospital, to predict multiple SDoHs for each patient.
     Results: In the first experiment, the random forest classifier achieved the highest accuracy among the classifiers tested. The
     overall accuracy to predict SDoHs was 71.3%. In the second experiment, multiclass classification effectively predicted a few
     patients’ SDoHs based purely on demographic and augmented data. The best accuracy of these predictions overall was 73%.
     However, both experiments yielded high variability in individual SDoH predictions and correlations that become salient among
     SDoHs.
     Conclusions: To our knowledge, this study is the first approach to applying PN encounter data and multiclass learning algorithms
     to predict SDoHs. The experiments discussed yielded valuable lessons, including the awareness of model limitations and bias,
     planning for standardization of data sources and measurement, and the need to identify and anticipate the intersectionality and

     https://formative.jmir.org/2023/1/e42683                                                                     JMIR Form Res 2023 | vol. 7 | e42683 | p. 1
                                                                                                                     (page number not for citation purposes)
XSL• FO
RenderX
JMIR FORMATIVE RESEARCH                                                                                                         Iacobelli et al

     clustering of SDoHs. Although our focus was on predicting patients’ SDoHs, machine learning can have a broad range of
     applications in the field of PN, from tailoring intervention delivery (eg, supporting PN decision-making) to informing resource
     allocation for measurement, and PN supervision.

     (JMIR Form Res 2023;7:e42683) doi: 10.2196/42683

     KEYWORDS
     patient navigation; machine learning; social determinants of health; health care disparities; health equity; case study

                                                                           Patients’ Assets, Risks, and Experiences; the Accountable Health
     Introduction                                                          Communities Health-Related Social Needs Screening Tool; and
     Patient navigation (PN) programs have demonstrated efficacy           the International Classification of Diseases, Tenth Revision
     in improving health outcomes in marginalized populations across       codes in categories Z55 to Z65 (Z codes) [26-28]. These
     a range of clinical contexts. Initially developed in 1990 to          strategies for identifying SDoHs have several limitations,
     address breast cancer disparities [1], PN has since been tested       however, including ambiguous definitions, inconsistent
     in other medical fields, demonstrating improved outcomes for          thresholds in clinical settings, the lack of structural incentives
     other cancers [2], dementia [3], depression [4], sickle cell          for providers to screen and enter data into electronic health
     disease [5], and complex multimorbidity in children [6] and           records, time and labor costs of training staff to adopt screening
     older adult populations [7], among other conditions. PN               tools, and the limited ability of medical sites to address identified
     programs in the United States have typically focused on serving       barriers [22,24,29,30]. Patient navigators experience many of
     marginalized populations who experience health care inequities,       these challenges.
     including low-income individuals [8], racial and ethnic minority      Navigators who serve the function of addressing patient barriers
     groups, immigrants and refugees, inner-city residents [9-12],         to care typically identify barriers (including SDoHs) and risks
     and rural residents [13,14]. Across the board, a growing body         for their patients through assessments and ongoing interactions,
     of literature suggests that navigation is associated with increased   as navigators follow patients through a particular care
     preventive services use (such as cancer screenings) and               continuum. Depending on patient needs at each point in their
     follow-up, earlier detection of health abnormalities, earlier or      care, navigators may assist patients, for example, by scheduling
     lower clinical stage of presentation, higher patient satisfaction,    appointments, coordinating referrals, making social service
     improved outcomes during survivorship, and considerably               arrangements, providing health education, facilitating
     reduced health care disparities [15].                                 patient-provider communication, providing psychosocial
     The widespread success of PN programs comes largely from              support, and applying for health insurance [17]. However, for
     their effectiveness in alleviating patient barriers to accessing      each patient, it takes time for navigators to build sufficient
     health care and improving the timeliness of diagnosis, follow-up,     patient rapport to solicit a full picture of a patient’s SDoHs, as
     and treatment [16]. Research has identified a myriad of barriers      well as the fine-tuning of cultural competency and
     addressed by PN, including being uninsured or underinsured,           communication skills [31]. Many patients who navigators serve
     financial barriers, language discordance, housing issues,             experience a multiplicity of barriers that intensifies the
     transportation difficulties, and fear or mistrust [17]. Often,        challenges that navigators face in identifying SDoH barriers.
     patient navigators were found to be crucial in helping individuals    Indeed, many patients’ SDoH-related barriers require more than
     navigate complex bureaucracy within local health care systems         one navigation encounter to uncover, owing to a myriad of
     [18]. Some barriers that navigators address are                       factors, including patients’ reluctance to disclose information,
     population-specific and other disease specific, but a common          communication barriers, and the variable experience level of
     underlying thread is social determinants of health (SDoHs),           patient navigators. Patient navigators could benefit from
     defined by the Centers for Disease Control and Prevention as          strategies that augment their current abilities to gather SDoH
     the “conditions in the places where people live, learn, work,         data to efficiently identify and resolve social services and other
     and play that affect a wide range of health and quality-of-life       SDoHs needs in a timely manner.
     risks and outcomes” [19]. SDoHs are a well-recognized driver          In exploring strategies to augment the work of patient navigators
     of diverse health inequities across populations [20].                 in identifying and mitigating SDoH-related patient barriers, we
     In ideal circumstances, SDoH information for patients can be          turn to machine learning—the use of computational techniques
     collected directly by health care providers and used to optimize      to detect patterns in data and predict outcomes—to predict the
     patient-centered care. However, it can be challenging for             SDoHs to create patient profiles that potentially enhance and
     providers to identify SDoH-related barriers experienced by            optimize the effectiveness of PN in improving health outcomes
     patients owing to a lack of time to ask [21], workflow integration    for diverse patient populations. For example, by creating a
     difficulties [22], prevalent data gaps [23], the lack of              predicted profile of SDoHs for a patient, the navigator can
     standardized screening tools [24], and the lack of providers          bolster information from existing SDoH assessments, find some
     competent in identifying SDoHs or those who come from                 guidance as to what aspects of SDoHs screening to pay more
     low-income backgrounds [25]. In recent years, several tools           attention to, and conduct interactions to screen for specific
     have emerged to help clinical care providers identify patients’       SDoHs that may not be self-evident. This helps both less
     SDoHs, including the Protocol for Responding to and Assessing

     https://formative.jmir.org/2023/1/e42683                                                                 JMIR Form Res 2023 | vol. 7 | e42683 | p. 2
                                                                                                                 (page number not for citation purposes)
XSL• FO
RenderX
JMIR FORMATIVE RESEARCH                                                                                                        Iacobelli et al

     experienced navigators detect SDoHs, as well as optimize the          Data Set
     time of underresourced navigators.                                    The data used in experiment 1 were sourced from the Chicago
     There has been a growing interest in the medical community in         Chinatown PN Program, a research study evaluating the
     the promise of machine learning and its potential contributions       effectiveness of PN to enhance breast and cervical cancer
     to detecting and predicting SDoHs. For example, Kasthurirathne        screening and follow-up among women residing in Chicago’s
     et al [32] used patient clinical data and community data              Greater Chinatown area [40]. The data were obtained from
     representing SDoHs to predict the need for congruous social           patient navigators’ tracking logs of 330 patients enrolled and
     services; their results regarding sensitivity, specificity, and       navigated in the study between July 2013 and November 2018.
     accuracy fell between 60% and 75%. Abarca-Alvarez et al [33]          After each patient interaction, the navigator entered a record of
     created a model to describe and predict social vulnerability          the encounter into the REDCap (Vanderbilt University)
     based on the demographic and geographic characteristics               database. The data contained demographics of patients (Table
     obtained from census data. Researchers have also attempted to         1), as well as information from each encounter involving a
     predict concrete outcomes using community, geographic, and            navigator interacting with a patient or care provider on behalf
     social indicators, including stillbirth [34], uncontrolled type 2     of a patient. PN encounter event records included notes left by
     diabetes [35], and BMI [36]. However, community data do not           the patient navigator, all languages spoken by the patient, the
     necessarily predict individual needs [37]. Most studies using         preferred language spoken, time spent with the physician, action
     machine learning have used data from textual surveys, and few         taken, the length of action taken, barriers and related SDoHs
     have augmented these data with images, text, or sound [38].           labeled by a patient navigator, and the medium in which the
     However, we identified 3 gaps in the research on machine              meeting was held (eg, in-person or phone call; Table 2). There
     learning algorithms for identifying SDoHs automatically,              were 22 SDoH categories identified (Textbox 1). Notably, not
     especially in the PN context. First, although clinical notes with     all patients had the same number of PN encounters.
     social workers’ notes have been used to predict some SDoHs            Machine learning algorithms are based on instances (encounters
     [39], the combination of textual and demographic information          or patients) with attributes (discrete or continuous variables
     has not been attempted in the classification of multiple SDoHs.       associated with each instance; eg, language spoken at home or
     Second, although community data have been used in previous            age). The probabilistic nature of these algorithms requires textual
     studies, these usually involve an aggregate of geographic area        fields to be converted into numerical attributes. Otherwise, the
     data, not personalized community data (such as the proximity          text associated with an instance may be too unique to help
     of each individual to the nearest hospital) [38]. Finally, patients   generalize the machine learning algorithm in predicting new
     often experience multiple SDoHs at a time, but existing research      instances. For example, a note for 1 patient specifying
     has only used single classification algorithms instead of             “[navigator] recommended pt to see GYN doctor” and another
     multilabel classification, which can, in theory, detect richer and    for a different patient saying, “email [navigator] to give her an
     more accurate co-occurrences of patients’ SDoHs [38].                 appointment with one of the gyne” are similar to that of a
     To address these gaps, we report the results and lessons learned      human. However, for a computer, these are 2 data points that
     in 2 experiments applying machine learning algorithms to PN           are completely different. However, there are algorithms that
     data collected from 2 PN studies in the Chicago area. In the first    allow us to determine which words are similar and cluster
     experiment, we compared machine learning algorithms to predict        similar words into groups called topics. Thus, we converted
     SDoHs from both patient demographic data and navigators’              textual notes into a vector of topics using latent Dirichlet
     textual patient encounter notes to determine whether 1 or more        allocation (LDA), a natural language processing algorithm to
     algorithms are suitable for this task. In the second experiment,      group similar terms into clusters (topics) that has been widely
     we used multilabel classification with personalized augmented         used in machine learning classification tasks in which textual
     information from the Google application programming interface         information is used [41].
     (API) to predict SDoHs from an initial demographic profile.           A total of 5 machine learning algorithms were used to predict
     The reported case study and lessons learned can inform the use        SDoHs using only patient demographic data. These 5 algorithms
     of machine learning for future PN programs and other initiatives      were logistic regression, random forest, support vector machine,
     that seek to identify and address SDoH barriers to care for           artificial neural network, and Gaussian naive Bayes. These
     marginalized populations.                                             algorithms were chosen because of (1) their diversity of
                                                                           approaches—regression, decision trees, algebraic, nonlinear,
     Methods                                                               and baseline probabilistic; (2) their fair performance on standard
                                                                           classification tasks; and (3) their wide availability for use by
     Experiment 1: Using Patient Navigator Encounter
                                                                           non–machine learning specialists. These models were trained
     Notes                                                                 using a subset of the patients and tested on new patients the
     The goal of this experiment was to compare machine learning           model has not seen. Experiments were also conducted using
     algorithms to predict SDoHs and determine whether 1 or more           patient demographic data, along with patient navigator encounter
     algorithms are suitable for this task. In particular, we explored     data. Some of the navigation encounter data were nonnumeric.
     whether demographic information alone or together with patient        Categorical data were converted using 1-hot encoding, which
     navigator notes can help predict patients’ SDoHs.                     converts each value of an attribute into a new binary attribute.
                                                                           Values were represented by 1 or 0 to indicate whether the data
                                                                           point had acquired this attribute or not, respectively.
     https://formative.jmir.org/2023/1/e42683                                                                JMIR Form Res 2023 | vol. 7 | e42683 | p. 3
                                                                                                                (page number not for citation purposes)
XSL• FO
RenderX
JMIR FORMATIVE RESEARCH                                                                                                                 Iacobelli et al

     These data presented the following idiosyncratic challenges in              the data in different ways, in consultation with the Chicago
     the context of training machine learning algorithms: (1) patients           Chinatown PN Program study team.
     did not necessarily have the same number of navigation
                                                                                 Six different strategies were used to prepare the data for the
     encounters; and (2) some navigation encounters included more
                                                                                 classification algorithms. Strategies 1 to 4 considered patient
     than one SDoHs, some listed none, and some documented an
                                                                                 demographic data and data from each navigation encounter.
     already reported SDoHs. Consequently, we attempted to prepare
                                                                                 Strategies 5 and 6 only involved patient demographic data.

     Table 1. Demographic attributes of each patient and how missing values were handled for each patient.
         Attributes                                           Type                                         How missing values were handled
         Age                                                  Numeric                                      Average
         Occupation                                           Categorical                                  Most common
         Marital status                                       Categorical                                  Most common
         Education level                                      Categorical                                  Most common
         What year came to United States                      Numeric                                      Average
         English speaking level                               Categorical                                  Most common
         Where are you from?                                  Categorical                                  Most common
         Zip code                                             Numeric                                      Most common
         How many live in house                               Numeric                                      Average
         Born in United States?                               Categorical (binary)                         Most common
         Household income (range)                             Categorical                                  Most common

     Table 2. Data recorded for each patient navigation encounter, and how we dealt with missing data in our set.
         Attributes                                           Type                                         How missing values were handled
         Preferred language                                   Categorical                                  Most common
         All languages spoken                                 Categorical                                  Most common
         Type of service                                      Categorical                                  Most common
         Channel                                              Categorical                                  Most common
         Length of action taken                               Numeric                                      Average
         Action taken                                         Categorical                                  Most common
         Comments                                             Text (sentence or sentences)                 Did not include this visit
               a                                              Categorical (this stayed categorical because Did not include this visit
         SDoH (label for data point)
                                                              it was the label for our data points)

     a
         SDoH: social determinant of health.

     https://formative.jmir.org/2023/1/e42683                                                                         JMIR Form Res 2023 | vol. 7 | e42683 | p. 4
                                                                                                                         (page number not for citation purposes)
XSL• FO
RenderX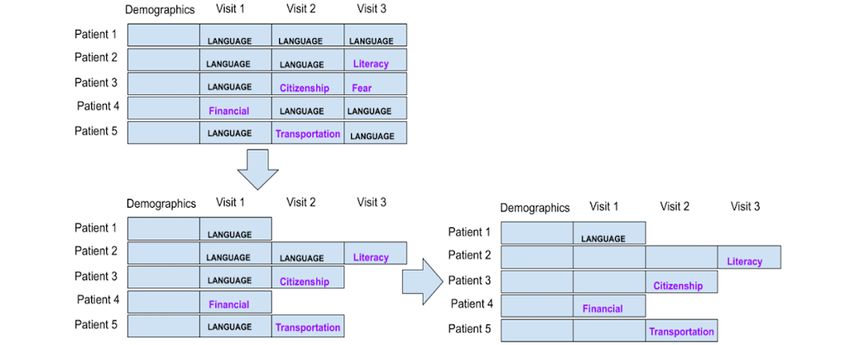
JMIR FORMATIVE RESEARCH                                                                                                             Iacobelli et al

     Textbox 1. Social determinants of health categories in the patient navigation tracking log.
      1.    Navigator barriers
      2.    Transportation
      3.    Housing
      4.    Social/practical support
      5.    Language/interpreter
      6.    Literacy
      7.    Childcare issues
      8.    Family/community issues
      9.    Distance from health care facility
      10. Insurance/uninsured/underinsured
      11. Financial problems
      12. Work schedule conflicts
      13. Communication concerns with medical personnel
      14. Fear
      15. Medical and mental health comorbidity
      16. Patient disability
      17. Out of town/country
      18. Perceptions/beliefs about tests/treatment
      19. System problems with scheduling care
      20. Attitudes toward providers
      21. Citizenship
      22. Other (write-in)

                                                                                  up to the first occurrence of an encounter that was not
     Preparation Strategy 1: Each Patient Is a Data Point                         “language/interpreter.” We labeled the data point or patient as
     Strategy 1 considered each patient as a data point. Although                 the non–language or interpreter SDoH. If every encounter had
     navigators could report ≥1 of the 22 available SDoH categories               an SDoH of “language/interpreter,” then we labeled that data
     for each navigation encounter, we used the overall frequency                 point’s SDoH as “language/interpreter” and only considered
     of occurrence to determine the most salient SDoHs in each                    the first navigation encounter for that patient because it only
     encounter. Because the sample was biased toward Chinese                      took 1 navigation encounter to determine the patient’s singular
     speakers, if a patient had multiple navigation encounters in                 longitudinal SDoH. This reduced the weight algorithms assigned
     which the navigator determined the SDoH of                                   to that pervasive SDoH. With this strategy, we had 300 data
     “language/interpreter,” we aggregated the encounters leading                 points. Figure 1 illustrates this strategy.

     https://formative.jmir.org/2023/1/e42683                                                                     JMIR Form Res 2023 | vol. 7 | e42683 | p. 5
                                                                                                                     (page number not for citation purposes)
XSL• FO
RenderX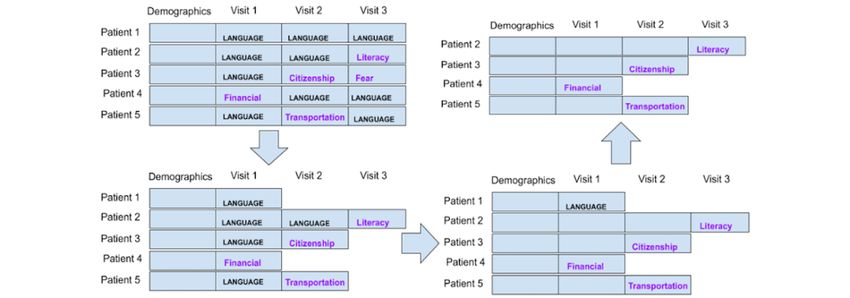
JMIR FORMATIVE RESEARCH                                                                                                                  Iacobelli et al

     Figure 1. Strategy 1: each patient is a data point with 1 social determinant of health per encounter.

                                                                                   have “language/interpreter” as the SDoH label. Because most
     Preparation Strategy 2: Each Patient Is a Data Point,                         data points were labeled as “language/interpreter,” we wanted
     Excluding the Language Barrier                                                to see the effect of the attributes on the accuracy of predicting
     This strategy is similar to strategy 1, except that once we have              other SDoHs. Figure 2 illustrates this strategy.
     all the data points, we eliminated all the data tuples that only
     Figure 2. Strategy 2: each patient is an instance, but patients with only “language” as the social determinants of health barrier were excluded as data
     points.

                                                                                   data points. Patient demographic information was the same for
     Preparation Strategy 3: Each Encounter Is a Data Point                        many data points because multiple data points or encounters
     This strategy considers each navigation encounter, not each                   came from the same patient. With this strategy, we obtained
     patient, as a data point, thereby generating a large number of                >1400 data points. Figure 3 illustrates this strategy.

     https://formative.jmir.org/2023/1/e42683                                                                          JMIR Form Res 2023 | vol. 7 | e42683 | p. 6
                                                                                                                          (page number not for citation purposes)
XSL• FO
RenderX
JMIR FORMATIVE RESEARCH                                                                                                                 Iacobelli et al

     Figure 3. Strategy 3: each navigation encounter is a data point.

                                                                                 similar to strategy 2, we eliminated all the data points with an
     Preparation Strategy 4: Each Encounter Is a Data Point,                     SDoH of “language/interpreter.” This strategy is illustrated in
     Excluding the Language Barrier                                              Figure 4.
     This strategy used the same technique as strategy 3 in
     considering each navigation encounter as a data point, but
     Figure 4. Strategy 4: each encounter is a data point, while “language” social determinants of health data points were excluded.

                                                                                 following the same procedure as in strategy 1, except that the
     Preparation Strategy 5: Each Patient Is a Data Point,                       navigation encounter data are excluded. This is illustrated in
     and Only Demographic Data Are Included                                      Figure 5.
     Strategy 5 considers each patient as a separate data point but
     only includes patient demographic data. Labels are obtained by

     https://formative.jmir.org/2023/1/e42683                                                                         JMIR Form Res 2023 | vol. 7 | e42683 | p. 7
                                                                                                                         (page number not for citation purposes)
XSL• FO
RenderX
JMIR FORMATIVE RESEARCH                                                                                                                    Iacobelli et al

     Figure 5. Strategy 5: each patient is a data point. After labeling the social determinants of health, navigation encounter information is excluded.

                                                                                   in strategy 2, patients with the label of “language/interpreter”
     Preparation Strategy 6: Each Patient Is a Data Point,                         were excluded. Figure 6 illustrates this strategy.
     Only Demographic Data Are Included, and Language
     Barriers Are Excluded
     Strategy 6 considers each patient as a separate data point, as in
     strategy 1, but we only considered the demographics data. As
     Figure 6. Strategy 6: each patient is an instance; labels of “language/interpreter” and encounter data were excluded.

                                                                                   Once all data were converted to numeric data and fully
     From Navigator Notes to Attributes                                            processed according to the 6 strategies, we tested 5 different
     LDA was used to convert the comments of the navigator on                      machine learning algorithms to create models that can predict
     each encounter (text) into meaningful numerical data. This is a               the SDoH. As mentioned earlier, LDA did not play a role in
     generative statistical model used to capture textual documents                strategies 5 and 6 because encounter data were not used for
     into k latent topics (clusters of related words). Each document               these strategies. Thus, in total, we tested 130 different models
     has a probability distribution of belonging to each of the k topics           (strategies 1-4 × 6 topic configurations × 5 algorithms +
     [41]. Therefore, a document becomes a series of k probability                 strategies 5-6 × 5 algorithms). These models were trained using
     values. We used this approach to convert the text into k                      a subset of the PN data and tested on PN data that the model
     attributes. For each strategy that used navigation encounter data             had not yet seen (hereafter referred to as “new patients”). The
     (strategies 1-4), we tested different numbers of topics or latent             5 machine learning algorithms or classifiers that were used are
     attributes (k), including k=5, k=10, k=15, k=20, k=25, and k=30               as follows:
     for the number of topics. Although methods to compute an
                                                                                   1.   Logistic regression was the first machine learning algorithm
     optimum number of topics exist, these methods may lose
     important information in our data, which were in short notes                       used to predict SDoHs in new patients. Logistic regression
     form; therefore, we opted to test a variety of topic numbers                       is a statistical model that in its primary form uses logistic
     instead.                                                                           functions to model the behavior behind a binary class
                                                                                        problem. In our data, we included 22 different classes of

     https://formative.jmir.org/2023/1/e42683                                                                            JMIR Form Res 2023 | vol. 7 | e42683 | p. 8
                                                                                                                            (page number not for citation purposes)
XSL• FO
RenderX
JMIR FORMATIVE RESEARCH Iacobelli et al
SDoHs. To make this a binary class problem, logistic decided to include data from another PN study with a different
regression considers 1 SDoH as 1 class (A) and the rest of population. Thus, the data for this second experiment came from
the SDoHs as the other class (not A). The algorithm does the Chinatown PN study (experiment 1 data) and the DuPage
this for every SDoH (class). PN study, a research study evaluating PN for enhancing breast
2. The second machine learning algorithm we used for and cervical cancer screening timeliness and follow-up in
prediction was a random forest classifier. A random forest DuPage County, Illinois [42,43]. Both the Chinatown PN and
classifier creates many decision trees during training. A DuPage PN studies were implementation and dissemination
test data point runs through each tree, and the prediction is studies that adapted PN protocols originating from the National
determined by the label the most often determined by the PN Research Program [44,45]. For both studies, patient
decision trees. A decision tree is a rule-based classifier that demographics and tracking log data sets included a patient’s
tests attributes according to the entropy they contribute to sociodemographic information, including their age, income
the data. Attributes with less entropy are tested first. range, and education level. The data set from Chinatown is
3. The third machine learning algorithm is a support vector described in experiment 1. The data from the DuPage County
machine. Support vector machines take data in higher study provided preexisting demographic data from 478 unique
dimensions and separate them from the hyperplanes in a patients and navigation tracking (encounter) data from 435
lesser dimension. New data points will be classified patients collected between 2009 and 2012. Unfortunately, the
depending on where they lay in the N-dimensional space. DuPage data set did not include navigation encounter notes.
This will depend on how the N-1 dimensional hyperplane Therefore, using topic modeling on those data was not possible.
separates from the N-dimensional space.
4. Artificial neural networks were used as the fourth machine
Data Preparation
learning algorithm. This algorithm is a function modeled To use the data as one data set, it was necessary to consolidate
after the biological neural networks in the human brain. both data sets by selecting common attributes and excluding
The algorithm consists of initializing the weights and biases, data points that did not overlap. The DuPage data had 1 SDoH
forward propagation, calculated costs, backpropagation, noted for each encounter along with an action to be taken by
and convergence to a local minimum. Each node in an the patient (eg, an examination). We compiled all the SDoHs
artificial neural network is called an artificial neuron and across encounters and assigned them to each patient. Patients
is very similar to a biological neuron because it takes some without navigation encounters were excluded from this study.
input and sends out some output. Artificial neural networks This process produced complete data for 400 unique patients
take in and output only numbers. in the DuPage study.
5. The fifth algorithm we used was Gaussian naive Bayes, As previously described, the Chinatown data recorded medical
which is based on applying Bayes’ theorem with the naive history, including barriers and interventions, already listed
belief that attributes are conditionally independent of each together for individual patients (tracked by a unique Record
other. Gaussian naive Bayes supports continuous-valued ID), so there was no need for reformatting in that regard.
features and models each as conforming to a Gaussian However, “barrier” or “actions taken” were separated by
(normal) distribution, whereas Classical naive Bayes encounter rather than listed together, such as it was in the
supports categorical features and models, each in line with DuPage data. To generate a similar list as DuPage, in which all
a multinomial distribution. barriers and interventions for a patient are immediately
The accuracy of the classifiers was determined by running 10 associated with them, the SDoH for each individual encounter
cross-fold validation and then these averages were compared was concatenated. If a patient had no navigation encounters,
directly. that record was excluded. This resulted in 274 unique patient
data points for the Chinatown set.
Experiment 2: Multiclass Classification With
Augmented Information The next task was to combine these new data sets. Both data
sets did not collect the same demographic or navigational
Overview encounter information, and when they did, the data were
Another approach that can be used to predict SDoHs is formatted differently. Thus, we grouped the data that was
multiclass classification, which allows each patient to be common to both sets into a larger set. The codes for SDoHs did
classified under multiple SDoHs simultaneously. In addition to not have a 1:1 correspondence, but most were sufficiently close
this mode of classification, we explored options to augment that we could assign correspondences between them. The
patient demographic data with personalized, publicly available DuPage data had generic codes that were easily mapped to the
information on proximity and time to travel to the nearest Chinatown data, but they also had more specific SDoH codes
hospital. Thus, the goal of this second experiment was to assess under each generic code. If an SDoH was not found in the
the accuracy and utility of a multiclass machine learning Chinatown data, we used the generic code to establish
classification with augmented personalized data for predicting correspondence to the Chinatown code.
patients’ SDoHs. The selection of patient demographic attributes did not have
Data Set direct correspondence. For example, for employment, DuPage
had only 3 categories (“unemployed,” “part-time,” or “full
Because the Chinatown PN study data set (experiment 1 data)
time”), whereas the Chinatown data broke this attribute down
was highly biased toward the language or interpreter SDoH, we
further differentiating unemployed from retirees, homemakers,
https://formative.jmir.org/2023/1/e42683 JMIR Form Res 2023 | vol. 7 | e42683 | p. 9
(page number not for citation purposes)
XSL• FO
RenderXJMIR FORMATIVE RESEARCH Iacobelli et al
and students. In cases in which direct conversions could not be convolutional neural networks owing to its flexibility in
made, values from attributes were converted to the system approximating functions with less expensive operations than
(DuPage or Chinatown), in which most alternative values were other activation functions. The input shape was the number of
provided. For instance, employment status was formatted to features per patient.
follow Chinatown employment categories, because the latter
The filter and kernel values were determined after experimenting
provided more options. Furthermore, any values entered in a
with a subset of data. A 1D MaxPooling layer was included
foreign language were converted to “none.” Any codes for
after the kernel, with a pool size and stride value of 2. This
values that were not specified in the DuPage codebook were
reduces the dimensionality of the data by abstracting them,
changed to “chose not to answer” or “other” if these were
making them more general, and avoiding overfitting. The pool
available codes for the corresponding attribute in the Chinatown
size and stride values were the results of experimentation to
data set. Otherwise, they were changed to “none.” Numerical
maximize accuracy.
fields with missing values were replaced with average values
for that attribute. Together with the MaxPooling layer, a convolutional layer aided
in reducing the impact of smaller values in the feature set and
We grouped the 3 most frequent barriers (SDoHs) and the 3
gave them less weight in the final predictions. Subsequently, a
most frequent interventions received. Selecting the most frequent
Flatten layer was included to reduce the dimensionality, again
barriers and interventions for a patient represented the most
reducing the computational cost by reducing the number of
impactful or persistent obstacles they faced. Therefore, the
parameters to learn and avoiding overfitting. The remaining
model that these data would be fed into would be built to predict
layers further abstract data features and were a series of 3 pairs
multiple barriers and multiple interventions per patient, up to
of Dropout layers and Dense layers. Each Dropout layer drops
3. Frequencies of their appearance were counted from the
a 25% proportion of the incoming values. Each Dense layer has
consolidated lists produced earlier, and the 3 most common
a decreasing number of nodes, equal to a multiple of the number
values were entered into the 3 new barrier fields or intervention
of classes. The first Dense layer has triple the number of output
fields.
nodes, the next has twice the number of output nodes, and the
Augmenting the Data final Dense layer has an equal number of nodes to classes. The
Given the tracking history and counting dates of services, a field output layer uses a sigmoid activation function to ensure that
was calculated for the number of navigation encounters the value of each output node is considered independent of one
associated with each patient, thus capturing the intensity of another, which is necessary for multilabel classification. The
encounters. The mean (16.94) and SD (13.06) of encounter model uses the binary cross-entropy loss function to determine
counts were determined. A new field (encounter range) was the final class probabilities independently. Combined with the
created, and patients received a value of L, M, H, or VH for previous sigmoid activation function, this model produces the
low, medium, high, or very high, respectively. The upper probability of each class being included in the given set of
thresholds for these categories were based on the SD, with visit classes for a patient.
counts 29 as VH. K-fold cross-validation allowed repeated iterations of training
Although patients’ specific addresses were not available, we and testing the model with different data splits each time.
used their zip codes and the Google Maps API to determine the We also explored the classification of visit intensity to determine
patient’s nearest hospital, distance in kilometers, potential whether demographic data could predict the intensity of visits
driving time, and potential travel time on public transportation per patient (L, M, H, and VH). Support vector machine
in the middle of the day. Public transportation data are not algorithms were used for this task.
always available because of the API’s own limitations; therefore,
missing values were replaced with average transit time values. Ethics Approval, Informed Consent, and Participation
The Northwestern University Institutional Review Board
Finally, all fields containing string (text)-type data were
approved all study procedures with institutional review board
binarized, that is, all distinct strings were converted into
#STU00006041 and #STU00059420. Written informed consent
columns, and each data point had a 1 or 0 for the attribute,
was obtained from all participants of the DuPage PN
depending on whether the text column contained that string.
Collaborative and Chicago Chinatown PN Program. Participants
The classification model was required to predict 3 potential
were compensated US $50 (Chinatown study) and US $20
classes per patient (the top 3 SDoHs). Each SDoH, therefore,
(DuPage study) in the form of gift cards for completing surveys.
had its own column, and each patient had 1 or 0 in the top 3
All study personnel were trained in the Collaborative
SDoHs extracted as described earlier.
Institutional Training Initiative and approved by the institutional
Machine Learning Model review board. Data used in this analysis were deidentified to
The multilabel classification model involved a standard approach protect the privacy and confidentiality of the study participants.
to convolutional neural network [46] using TensorFlow and
Keras. The model consisted of 9 layers. The input layer was a
1D convolutional layer with a kernel width of 3, 10 filters, and
a rectified linear unit activation function. The rectified linear
unit function is a commonly used activation function with
https://formative.jmir.org/2023/1/e42683 JMIR Form Res 2023 | vol. 7 | e42683 | p. 10
(page number not for citation purposes)
XSL• FO
RenderXJMIR FORMATIVE RESEARCH Iacobelli et al
6 (10%) were actually “insurance/uninsured/underinsured,” 5
Results (9%) were “fear,” and 4 (8%) were “other.” Of the 34 patients
Results of Experiment 1 classified as having an SDoH of “insurance/uninsured
/underinsured,” 19 (56%) were accurately classified as having
In the first experiment, as detailed in the Methods section, we an SDoH of “insurance/uninsured/underinsured,” whereas
compared 6 strategies and 5 learning algorithms. The heat map among the false positives, 4 (12%) were “other,” 2 (6%) were
in Figure 7 shows the accuracy of the various machine learning “communication concerns with medical personnel,” 2 (6%)
algorithms over different data preparation strategies as they use were “financial problems,” and 2 (6%) were “social/practical
different configurations of LDA attributes (number of topics). support.”
Colors closer to dark red indicate a higher accuracy. Colors
closer to blue indicate a lower accuracy. LDA was not applicable Examining the confusion matrix for random forest with strategy
to strategies 5 and 6, which only used patient demographic data; 1 and 15 LDA topics (the most accurate algorithm), we can see
therefore, they are shown as a block. that certain attributes can be grouped to provide a better
understanding of potential SDoHs for a patient. For example,
The random forest classifier obtained the highest accuracy if a new patient is classified as having a “language/interpreter”
among the 5 classifiers tested. It outperformed all others in data SDoH, our model can predict this with 71.3% confidence.
preparation strategies 1 and 3 with every configuration of LDA However, the classifier was 95.4% confident that the SDoH for
topics. Notably, random forest with 15 LDA topics using that patient was “language/interpreter,” “social/practical
strategy 1 yielded the highest accuracy of 71.3%. Logistic support,” or “fear,” which suggests that it may be beneficial for
regression and support vector machine showed moderate patient navigators to pay attention to associated SDoHs when
accuracies for strategies 1 and 3, respectively. Gaussian naive identifying a “language/interpreter” barrier.
Bayes was outperformed by all other algorithms under all
strategies. In a similar manner, if a new patient is predicted to have (labeled
with) an SDoH of “fear,” we are 96% (21/22) confident that the
Figure 8 shows the confusion matrix for each individual SDoH SDoH for that patient is “fear,” “language/interpreter,”
for strategy 1, using random forest and 15 LDA topics—the “perceptions/beliefs about tests/treatment,” or “social/practical
configuration that yielded the highest accuracy. This model had support.” For patients labeled as having an SDoH of
an accuracy of 71.3% for predicting a new patient with a single “insurance/uninsured/underinsured,” there is 85% (29/34)
SDoH. The confusion matrix shows the accuracy of each SDoH probability that their SDoH is “insurance/uninsured
method. The “language/interpreter” SDoH had the best accuracy /underinsured,” “other,” “communication concerns with medical
and the most instances in our data set. Moreover, for the personnel,” “social/practical support,” or “financial problems.”
“language/interpreter” SDoH, the actual percentage of true Finally, if a new patient is labeled as having an SDoH of
positives is 79.2% (137/173), whereas the false positives “social/practical support,” there is an 88% (52/59) chance that
corresponded to “social/practical support” in 12.7% (22/173) the patient’s SDoH is actually “social/practical support,”
of instances, and “fear” in 3.5% (6/173) of instances. “insurance/uninsured/underinsured,” “fear,” or “other.” We find
Other moderate rates of true positives occurred for SDoH that it is possible to group other attributes together and create
categories “social/practical support,” “fear,” and broader classes of SDoH that are highly correlated.
“insurance/insured/underinsured.” Of the 22 patients classified However, the data are heavily biased toward the language barrier
with an SDoH of fear, 14 (64%) were accurate predictions, 3 of an SDoH, which makes it difficult to extract other SDoH. In
(14%) were actually “language/interpreter,” 2 (9%) were addition, although we have notes from the navigators, they did
“perceptions/beliefs about tests/treatment,” and 2 (9%) were not report the SDoH in every encounter. Consequently, we were
“social/practical support.” Of the 59 patients predicted to have unable to determine whether the notes were meaningful for each
an SDoH of “social/practical support,” 37 (63%) were accurately recorded SDoH.
labeled with the SDoH of social or practical support, whereas
https://formative.jmir.org/2023/1/e42683 JMIR Form Res 2023 | vol. 7 | e42683 | p. 11
(page number not for citation purposes)
XSL• FO
RenderXJMIR FORMATIVE RESEARCH Iacobelli et al
Figure 7. Accuracy for all tests (ranges from 0.00 to 0.75). Each rectangle represents different data preparation strategies, machine learning algorithms,
and number of topics from latent Dirichlet allocation.
Figure 8. Confusion matrix of classification using random forest with data preparation strategy 1 and 15 latent Dirichlet allocation topics.
classifications for SDoH barriers and the resulting mix of correct
Results of Experiment 2 and incorrect predictions for each class.
In the second experiment, as detailed in the Methods section,
we trained a convolutional neural network with augmented Figure 9 shows that the SDoH “none” was dominating the
demographic data for each patient. Figure 9 shows the multilabel predictions, as it was the most common SDoH noted (in most
encounters, patient navigators noted “none” if there were no
https://formative.jmir.org/2023/1/e42683 JMIR Form Res 2023 | vol. 7 | e42683 | p. 12
(page number not for citation purposes)
XSL• FO
RenderXJMIR FORMATIVE RESEARCH Iacobelli et al
other SDoHs besides what they had already determined, if any). These predictions were not very different from those obtained
Experiment 2 data show that our method is 90% accurate in in the first experiment, and this may be, in part, because of the
detecting a language barrier and 73% accurate in predicting the dominance of language as a barrier, as both data sets included
need for “case management.” Other SDoHs were not predicted mostly individuals for whom English was not their primary
with any consistent accuracy. language. It is worth noting that in the experiment 2 data, many
annotations for SDoH had the word “none” in them, despite an
Regarding the correlation between each SDoH and encounter
SDoH being recorded either at a later or earlier time point.
intensity, the highest correlation was with “other primary
Moreover, we were not able to fully personalize the augmented
language” (r=0.55) followed by “Spanish primary language”
data because of the absence of specific patient addresses, but
(r=0.27). When we also looked at correlations between other
we did show a proof of concept that it is possible to augment
attributes and SDoHs, we found a positive correlation between
the data with personalized information through other methods.
“no near family support” and “China” being a country of origin
(r=0.44), and a negative correlation between “no near family
support” and “Spanish” being a primary language (r=−0.26).
Figure 9. Accumulated correct predictions for each class of social determinants of health or barrier (a visualization of a confusion matrix).
better predictions than the most accurate models in the first
Discussion experiment.
Principal Findings Although the predictive power of our approach was limited to
In this case study, we report on 2 experiments exploring the a handful of SDoH-related barriers and we found a few useful
feasibility of using machine learning to predict the SDoHs for correlations among SDoHs, our study produced other insights.
PN research. This study offers novel approaches to address In applying machine learning algorithms to the Chicago
several research gaps in the literature, including using textual Chinatown and DuPage PN data sets, our case study yielded
data, augmenting data with personalized information, and using some valuable lessons learned that can inform future use of
multiclass predictions. The findings of this study were mixed. machine learning for PN programs and other initiatives
In the first experiment, we used data from patients living in addressing SDoH barriers to care. As discussed, the lessons
Chinatown in Chicago. We compared 5 algorithms with each learned include (1) planning for the standardization of data
other, and examined whether the text in the notes of the sources and measurement that purposefully lend themselves to
navigator can make a difference in the prediction of SDoHs. In predictive analysis; (2) identifying and anticipating the
this experiment, the random forest classifier with 15 LDA topics intersectionality and clustering of SDoHs; and (3) being aware
using data preparation strategy 1 (each patient is a data point) of model limitations.
yielded the highest prediction accuracy of 71.3%. Moreover, Standardization of Data Sources and Measurement
we were able to group certain attributes to provide a better
understanding of the potential clustering of SDoHs for a patient. If we call the action of observing a patient and their associated
In the second experiment, using data from both Chinatown and data “x,” then a patient navigator will try to take “x” and predict
DuPage County, we augmented demographic information and a set of SDoHs “s.” Machine learning algorithms try to replicate
used multiclass classification to predict SDoHs. We were able this human prediction process by finding a function that
to effectively predict a handful of SDoHs but did not result in statistically fits a large number of human predictions so that
https://formative.jmir.org/2023/1/e42683 JMIR Form Res 2023 | vol. 7 | e42683 | p. 13
(page number not for citation purposes)
XSL• FO
RenderXJMIR FORMATIVE RESEARCH Iacobelli et al
when given a particular “x” it can determine “s” as accurately address and the provider’s address can provide augmented data
as possible (f(x)=s). Because this fit is statistical in nature, it that indicate the driving time or public transportation time it
requires data that are relevant to the attribute being predicted would take the individual to see a health care provider.
(≥1 SDoHs). Because it is generally the case that the more data
available for training an algorithm, the better the predictive
Identifying and Anticipating SDoH Intersectionality
results, larger data sets and replication are needed. However, a Using the random forest algorithm with data preparation strategy
larger data set does not guarantee an accurate prediction of 1 and 15 LDA topics (the most accurate algorithm in the first
SDoHs. Because many studies on SDoHs target specific experiment), we grouped certain attributes to provide a better
populations, it is not unusual to observe bias in the data [38]. understanding of the potential correlations of SDoHs for a
For example, when working with English-learner immigrants patient. These findings underscore the growing recognition that
of low socioeconomic status, it is reasonable to expect finances SDoHs are not discrete phenomena; they operate in complex,
and language among the SDoHs. In this case, the machine integrated ways. Their intersectionality should be anticipated
learning predictor will be very accurate for these 2 SDoHs; and identified for machine learning to help advance the work
however, it could be less useful for real-life applications, as of patient navigators. The National Institute on Minority Health
most patient navigators will be able to notice these 2 SDoHs in and Health Disparities has proposed a multidimensional research
their patient encounters. Accurate prediction of less-common framework to understand and address minority health and health
SDoHs may be a more useful application of these algorithms, disparities [47]. This framework conceptualizes SDoHs as
but biases in the data make these predictions hard. involving a wide array of health determinants spanning different
domains of influence and multiple levels of influence within
Therefore, in our case study we conducted extensive data each domain. As the National Institute on Minority Health and
preparation for our 2 experiments, and we tried to exclude Health Disparities research framework indicates, there are not
“language” as it was a very pervasive SDoH (experiment 1). just single social factors but rather their interrelatedness may
Our results align with those of previous research [39]; however, have an overall effect on an individual’s health outcomes.
we provide an alternative method to augment traditional models Moreover, as the framework suggests, a combination of several
with textual information and individualized information from determinants could play a larger role in a person’s health than
publicly available data (eg, Google Maps API). any single determinant. Building a predictive model that
To optimize the use of machine learning for predicting and considers this framework as part of its predictive algorithm
addressing SDoHs in PN contexts, data collection protocols and could be a powerful tool for patient navigators and health care
data structures should be intentionally collected for machine providers. It would allow them to recognize and address a
learning purposes. First, collecting more samples with patient’s unique set of social determinants to improve health
less-common SDoHs is key. It is not sufficient to collect data outcomes for that individual. In the future, methods such as
from a large pool of individuals, but the variety of SDoHs is Conditional Random Fields could not only be used to predict
fundamental for accurate statistical predictions. Second, there multi-SDoH outcomes but also the strength of the correlation
must be planning for multiclass prediction tasks from the outset. among them for every single patient. Methods such as
This includes a system for accurately recording SDoHs during convolutional neural networks [46] can leverage these
encounters, a protocol to handle when new SDoHs are recorded, correlations for more accurate outcomes.
and when wildcard SDoHs are recorded. In experiment 2, “none”
Limitations
was a wildcard SDoH and, as such, very pervasive as well.
Third, there should be considerations for recording additional The limitations of this research can be grouped into 2 main
information that helps augment the data with readily available areas: limitations in the models and limitations in the
personalized information from the web. For example, patient experiments. Regarding limitations of the models, multiple
voice and textual data are underused, but hold tremendous recent reports and systematic reviews have brought attention to
potential as a source for SDoH prediction. Responses to general issues of bias in health models of machine learning and the
questions such as “How are you feeling today?” could add to unintended harms that can arise when using machine learning
the data on patient barriers, from which speech recognition can for prediction [48-51]. In the case of Chinatown and DuPage
be used to identify SDoH-related topics and conversations that PN data, our patient population consisted primarily of
emerge. Automated tools with speech recognition could be used low-income individuals whose primary language was not
when possible; however, special care must be taken by testing English; thus, the model classifications were biased toward
them before their use, as the collection method or other external language and financial (eg, health insurance) SDoH barriers. If
circumstances may result in the collection of unusable data. For used for prediction purposes, machine learning algorithms would
example, if the interviews are conducted over the phone, then primarily guide navigators toward focusing on patients’ language
the audio quality is vital. This quality can be affected by and health insurance–related barriers while largely ignoring
interference in the call, a speech impediment, low volume, or other SDoH barriers. This is not to say that other SDoH barriers
slurred speech in older individuals. In addition, the language do not exist in these patient populations, but because of the bias
spoken by the patients can be a dialect. In our Chinatown data, in the data set from which the algorithms were trained, 1
patients do not speak Mandarin or Cantonese, but Toishanese, unintended harm that may arise is that other SDoHs are at risk
for which we could not find satisfactory speech recognition of being ignored. Although the findings and lessons learned
software. Finally, additional questions, such as “At what time from this study demonstrate the promising use of machine
are you available to go to the doctor?” together with the patient’s learning algorithms in predicting SDoHs in PN work, there are
https://formative.jmir.org/2023/1/e42683 JMIR Form Res 2023 | vol. 7 | e42683 | p. 14
(page number not for citation purposes)
XSL• FO
RenderXYou can also read