Remote Assessment of Disease and Relapse in Major Depressive Disorder (RADAR-MDD): Recruitment, retention, and data availability in a longitudinal ...
←
→
Page content transcription
If your browser does not render page correctly, please read the page content below
Remote Assessment of Disease and Relapse in
Major Depressive Disorder (RADAR-MDD):
Recruitment, retention, and data availability in a
longitudinal remote measurement study.
Faith Matcham ( faith.matcham@kcl.ac.uk )
Institute of Psychiatry, Psychology and Neuroscience, King’s College London
Daniel Leightley
Institute of Psychiatry, Psychology and Neuroscience, King’s College London
Sara Siddi
Parc Sanitari Sant Joan de Déu, Fundació Sant Joan de Déu, CIBERSAM, Universitat de Barcelona
Femke Lamers
Department of Psychiatry and Amsterdam Public Health Research Institute, Amsterdam UMC, Vrije
Universiteit
Katie M White
Institute of Psychiatry, Psychology and Neuroscience, King’s College London
Peter Annas
H. Lundbeck A/S
Giovanni de Girolamo
IRCCS Instituto Centro San Giovanni di Dio Fatebenefratelli
Sonia Difrancesco
Department of Psychiatry and Amsterdam Public Health Research Institute, Amsterdam UMC, Vrije
Universiteit
Josep Maria Haro
Parc Sanitari Sant Joan de Déu, Fundació Sant Joan de Déu, CIBERSAM, Universitat de Barcelona
Melany Horsfall
Department of Psychiatry and Amsterdam Public Health Research Institute, Amsterdam UMC, Vrije
Universiteit
Alina Ivan
Institute of Psychiatry, Psychology and Neuroscience, King’s College London
Lavelle Grace
Institute of Psychiatry, Psychology and Neuroscience, King’s College London
Qingqin Li
Janssen Research and Development, LLC
Federica Lombardini
Page 1/33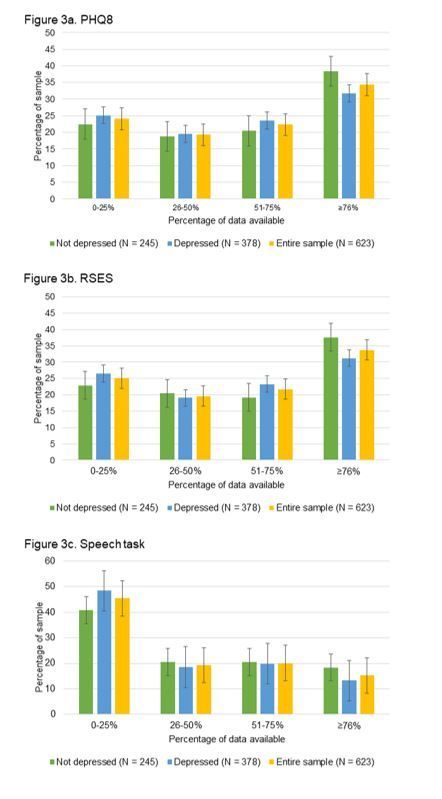
Parc Sanitari Sant Joan de Déu, Fundació Sant Joan de Déu, CIBERSAM, Universitat de Barcelona
David C Mohr
 Center for Behavioral Intervention Technologies, Department of Preventative Medicine, Northwestern
University
Vaibhav A Narayan
 Janssen Research and Development, LLC
Carolin Oetzmann
 Institute of Psychiatry, Psychology and Neuroscience, King’s College London
Brenda BWJH Penninx
 Department of Psychiatry and Amsterdam Public Health Research Institute, Amsterdam UMC, Vrije
Universiteit
Stuart Bruce
 RADAR-CNS Patient Advisory Board, King's College London
Nica Raluca
 RADAR-CNS Patient Advisory Board, King's College London
Sara K Simblett
 Institute of Psychiatry, Psychology and Neuroscience, King’s College London
Til Wykes
 Institute of Psychiatry, Psychology and Neuroscience, King’s College London
Jens C Brasen
 H. Lundbeck A/S
Inez Myin-Germeys
  Department for Neurosciences, Center for Contextual Psychiatry
Aki Rintala
 Faculty of Social and Health Care, LAB University of Applied Sciences
Pauline Conde
 Institute of Psychiatry, Psychology and Neuroscience, King’s College London
Richard JB Dobson
 Institute of Psychiatry, Psychology and Neuroscience, King’s College London
Amos A Folarin
 Institute of Psychiatry, Psychology and Neuroscience, King’s College London
Callum Stewart
 Institute of Psychiatry, Psychology and Neuroscience, King’s College London
Yatharth Ranjan
 Institute of Psychiatry, Psychology and Neuroscience, King’s College London
Zulqarnain Rashid
 Institute of Psychiatry, Psychology and Neuroscience, King’s College London
Nick Cummins
 University of Augsburg

                                                Page 2/33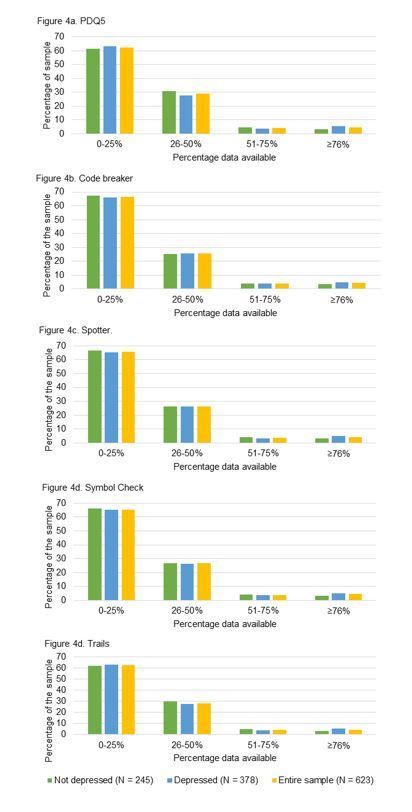
Nikolay V Manyakov
Janssen Pharmaceutica NV
Srinivasan Vairavan
Janssen Research and Development, LLC
Matthew Hotopf
Institute of Psychiatry, Psychology and Neuroscience, King’s College London
Research Article
Keywords: Major Depressive Disorder, Remote Measurement Technologies, longitudinal, multicentre,
cohort study
Posted Date: June 14th, 2021
DOI: https://doi.org/10.21203/rs.3.rs-612374/v1
License: This work is licensed under a Creative Commons Attribution 4.0 International License.
Read Full License
Page 3/33Abstract
Background
Major Depressive Disorder (MDD) is prevalent, often chronic, and requires ongoing monitoring of
symptoms to track response to treatment and identify early indicators of relapse. Remote Measurement
Technologies (RMT) provide an exciting opportunity to transform the measurement and management of
MDD, via data collected from inbuilt smartphone sensors and wearable devices alongside app-based
questionnaires and tasks. Our aim is to describe the amount of data collected during a multimodal
longitudinal RMT study, in an MDD population.
Methods
The Remote Assessment of Disease and Relapse – Central Nervous System (RADAR-CNS) program
explores the potential to use RMT across a range of central nervous system disorders. Remote
Assessment of Disease and Relapse – Major Depressive Disorder (RADAR-MDD) is a multi-centre,
prospective observational cohort study conducted as part of the RADAR-CNS program. People with a
history of MDD were provided with a wrist-worn wearable, and several apps designed to: a) collect data
from smartphone sensors; and b) deliver questionnaires, speech tasks and cognitive assessments.
Participants were followed-up for a maximum of 2 years.
Results
A total of 623 individuals with a history of MDD were enrolled in the study. We report 80% completion
rates for primary outcome assessments across all follow-up timepoints. 79.8% of people participated for
the maximum amount of time available and 20.2% withdrew prematurely. Data availability across all
RMT data types varied depending on the source of data and the participant-burden for each data type.
We found no evidence of an association between the severity of depression symptoms at baseline and
the availability of data. In total, 110 participants had > 50% data available across all data types, and thus
able to contribute to multiparametric analyses.
Conclusions
RADAR-MDD is the largest multimodal RMT study in the field of mental health. Here, we have shown that
collecting RMT data from a clinical population is feasible. We found comparable levels of data
availability in active and passive forms of data collection, demonstrating that both are feasible in this
patient group. Our next steps are to illustrate the predictive value of these data, which will be the focus of
our future data analysis aims.
Page 4/33Background
Depressive disorders contribute to 14.3% of all-age years lived with disability (YLD), making it the third
leading cause of YLD globally (1). Major depressive disorder (MDD) is a severe form of depression
characterised by prolonged periods of low mood and anhedonia combined with a range of other
symptoms including changes in sleep quality, appetite, cognitive function, energy levels, activity, feelings
of guilt or worthlessness and thoughts of death (2). MDD is associated with a wide range of negative
outcomes including: loss of occupational function (3); reduced quality-of-life (4); and premature
mortality (5). Whilst some may experience a single lifetime episode of MDD, it is becoming more widely
recognised as a chronic condition, characterised by periods of relapse and recovery (6,7). The
management of chronic illnesses requires ongoing monitoring of symptoms to track response to
treatment and identify early indicators of relapse. Conventionally, this monitoring is dependent on self-
reported questionnaires or clinical interviews, which are reliant on individuals’ subjective recollection of
symptoms. This is subject to recall bias and loses context reactivity and symptom variability (8). That is,
how symptoms change in relation to situational factors (context reactivity) and how symptoms may
fluctuate on a daily, or even hourly basis (symptom variability).
The use and ownership of smartphones and wearable technology has increased exponentially in the last
decade; new technological advances facilitate the collection of digital biomarkers using unobtrusive,
inbuilt sensors requiring minimal input from users (9,10). Many features of MDD, including symptoms,
risk factors for, and consequences of, depression are amenable to assessment via remote measurement
technologies (RMT): for example, heart rate from photoplethysmography (PPG) sensors and activity from
accelerometery sensors in wrist-worn wearable devices can give information indicative of sleep patterns
and physical activity levels. Data such as Global Positioning System (GPS), Bluetooth, gyroscope, phone
screen interactions, ambient noise and light levels have also been used to unobtrusively collect
information from smartphones relating to sociability, movement and activity associated with low
mood (11). In contrast to this passive RMT (pRMT) form of data collection, requiring little or no input
from the user, active RMT (aRMT), requires action from the user, such as completing short questionnaires
or tasks in response to a notification. Combining data collected passively via inbuilt smartphone sensors,
with smartphone apps to deliver questionnaires, cognitive tasks, assessments of speech or Experience
Sampling Method (ESM) we can gain valuable insight into an individual’s daily life (12).
There is a growing body of research studies using these technologies to measure symptoms and predict
outcomes (11), or to deliver interventions in MDD (13). However, the real-world implementation of digital
health applications into clinical care has been thwarted by low uptake, adherence and retention; despite
the availability of over 300,000 health apps and more than $9 billion in investment (14). Reports from
industry suggest that in 2019, 25% of health apps are opened only once, and only 32% of users use a
health app more than 10 times (15).
Initial uptake and continued health app use in people with depression may be even lower, with systematic
review evidence suggesting that long-term (≥6 weeks) use may be as low as 0.5% (16). Digital exclusion
Page 5/33is prevalent in people with mental disorders: reduced access to technology; unpredictable personal
circumstances and symptoms of the mental disorder itself which may affect cognitive functions and
confidence have all been associated with a lack of engagement with digital technologies (17). Beyond
initial uptake, longer-term use of health apps in people with depression is affected by a complex
combination of health-, user- and technology-related barriers (18). There is, however, a widely
acknowledged ambiguity in the reporting of engagement statistics and a huge amount of variation in the
methods used to assess uptake and engagement in digital technology research (19,20).
The Remote Assessment of Disease and Relapse – Central Nervous System (RADAR-CNS; (21) program
is an international consortium exploring the potential for RMT to transform the measurement and
management of MDD, epilepsy and multiple sclerosis. Remote Assessment of Disease and Relapse in
Major Depressive Disorder (RADAR-MDD; (22)) is a longitudinal cohort study being conducted as part of
the RADAR-CNS program, examining the utility of multi-parametric RMT to measure changes in
symptoms and predict relapse in people with MDD. The study has been designed with patient
involvement from the outset (including systematic reviews (23), focus groups (18) and a creating a
dedicated Patient Advisory Board) with the aim of developing a protocol which meets the needs of the
target population. In addition to its primary purpose of identifying RMT predictors of depression
outcomes, RADAR-MDD offers a unique opportunity to explore the recruitment of people with MDD into a
complex digital technology study, and describe the long-term retention rates and adherence to a protocol
which includes passive data collection via smartphone and wearable sensors, app-based questionnaires,
ESM and traditional web-based outcome assessments (22).
Throughout this paper, we have used the term data “availability” instead of “completeness” as we
describe all data provided throughout the study, regardless of quality or completeness. Data labelled as
“available” in this paper may include i) complete, valid data which are usable for analysis; ii) partial data
which are incomplete but potentially usable; and iii) data which have been corrupted or are invalid for any
reason. We believe it is essential to include partial or incomplete data as part of this paper, as they are
indicative not only of participant characteristics and study burden, but also of the underlying technical
infrastructure. It is also essential to note that whilst some participants were withdrawn from the study as
“lost to follow-up” for not completing primary outcome assessments, we decided to not withdraw
participants for not providing data via the smartphone apps or wearable devices. This concession gives
greater insight into how data availability may fluctuate with changes in depressive state, and a truer
representation of the feasibility of implementing RMT protocols in people with MDD.
The aims of this paper are to: 1) summarise study recruitment, retention, and completion rates of primary
and secondary participant-reported outcomes throughout the course of follow-up; 2) describe the
sociodemographic and clinical characteristics of the cohort for the RADAR-MDD study; and 3) describe
the availability of data throughout a multi-parametric RMT study protocol including active and passive
assessments of symptoms, behaviour and cognitive function.
Methods
Page 6/33Study Design
The full protocol for RADAR-MDD has been reported elsewhere (22). In short, RADAR-MDD is a multi-
centre, prospective observational cohort study. The study aimed to examine whether data collected via
multiparametric RMT can be used to reliably track illness course and predict relapse in MDD. The study
sought to recruit 600 individuals with a recent history of MDD and follow them up for a maximum of 24
months. The study involved no randomisation, intervention, or allocation of people into groups. The study
has three recruitment sites: King’s College London (KCL; UK); Amsterdam University Medical Centre,
location VUmc (Amsterdam, The Netherlands); and Centro de Investigación Biomédica en Red (CIBER;
Barcelona, Spain).
Study Population
To be eligible for participation in RADAR-MDD, individuals must: 1) have met DSM-5 diagnostic criteria
for non-psychotic MDD within the past 2 years; 2) have recurrent MDD (having had a lifetime history of at
least 2 episodes); 3) be able and willing to complete self-reported assessments via smartphone; 4) be
able to give informed consent; 5) be fluent in English, Dutch, Spanish or Catalan; 5) have an existing
Android smartphone, or willingness to swap to Android as their only phone; 6) be aged 18 or over.
Exclusion criteria were: 1) having a lifetime history of bipolar disorder, schizophrenia, MDD with psychotic
features, or schizoaffective disorder; 2) dementia; 3) history of moderate or severe drug or alcohol use in
the 6 months prior to enrolment; 4) a major medical diagnosis which might impact an individual’s ability
to participate in normal daily activities for more than two weeks; 5) pregnancy (although once enrolled,
becoming pregnant did not result in withdrawal).
Eligible participants were identified via several recruitment channels, including through existing research
cohorts who have consented to be contacted for future research opportunities, through primary and
secondary mental health services, or through advertisements for the study placed on mental health
charity websites, circulars or Twitter notices(22). Participants in Amsterdam were partially recruited
through Hersenonderzoek.nl (https://hersenonderzoek.nl/). All participants provided written consent and
provided detailed baseline assessments including sociodemographic, social environment, medical
history, medical comorbidities and technology use questionnaires, alongside depression history
measured via the Lifetime Depression Assessment – Self-Report (LIDAS; (24)).
Data Collection
Remote Data Collection
Data collection started in London (UK) in November 2017 in a pilot phase of app development, with
additional assessments being added to the protocol throughout the first 18 months of the study period to
Page 7/33allow small-scale functionality testing and quality control before international large-scale data collection
commenced. Data collection started in Barcelona and Amsterdam in September 2018 and February 2019,
respectively. A detailed description of the recruitment procedures across sites and schedule of
observations has previously been published (22). The data collected used RADAR-base, an open source
platform designed to leverage data from wearables and mobile technologies (25). RADAR-base provides
both passive and active data collection via two apps – the RADAR active and passive monitoring apps.
Passive RMT
The passive RMT (pRMT) app unobtrusively collected information about phone usage throughout
participation, requiring no input from the participant. It collected data on ambient noise, ambient light,
location, app usage, Bluetooth connectivity, phone usage, and battery life. Whilst some measurements
were added later, some data sources were also removed from the protocol throughout follow-up
(summarised in additional file 1), due to either technical changes or feasibility. For example, the original
protocol aimed to collect data about SMS and call logs, however changes to Google’s Play Store
permissions prevented access to this data as of January 2019. Data pertaining to SMS and call logs
have not been reported in the current paper due to data collection from this sensor ceasing whilst one site
had only recruited 30 individuals and another site had not started recruitment at all.
Participants were additionally required to wear a Fitbit Charge 2/3 device for the duration of participation,
providing information about individuals’ sleep and physical activity levels. Participants could keep the
Fitbit at the end of the time in the study.
Active RMT
The RADAR-base active RMT (aRMT) app administered validated measurements of depression and self-
esteem every 2-weeks via the 8-item Patient Health Questionnaire (PHQ8; (26)) and Rosenberg Self-
Esteem Scale (RSES; (27)). Items on the PHQ8 can be totalled and used as a continuous score with
higher scores indicating increased depression severity, and scores totalling ≥10 indicating those with
significant symptoms (26). The RSES requires reversing of 5 of the 10 items, which then can be totalled
to create a total score with higher scores representing increased self-esteem (27).
The aRMT app also delivered a speech task every 2-weeks, requesting participants to record a pre-
determined text from the “North Wind and the Sun”, which is phonetically balanced across all three
languages (28) and answer a question relating to plans for the upcoming week. Finally, the aRMT app
included an ESM protocol (22), requiring participants to complete brief questions relating to mood, stress,
sociability, activity and sleep, multiple times per day for 6 days at scheduled times throughout the course
of follow-up.
Cognitive Function
Cognitive function was measured every 6-weeks via an additional THINC-it app®, which was integrated
into the RADAR-base platform. The app has been validated to identify cognitive dysfunction within the
Page 8/33context of depressive disorder (29). The app contains the 5-item Perceived Deficits Questionnaire (PDQ-
5; (30)), alongside computerised versions of the Choice Reaction Time Identification Task (“Code
Breaker”), One-Back Test (“Spotter”), Digit Symbol Substitution Test (“Symbol Check”) and Trail Making
Test-Part B (“Trails”) tasks to assess processing speed, working memory, concentration and
attention (29).
Primary and Secondary Outcome Assessments
All primary and secondary outcome measurements were collected via automatic surveys sent every 3
months via the Research Electronic Data Capture (REDCap) software (31). A full description of the
outcome assessment schedule is provided in our published protocol paper (22).
Depression
Depressive state was measured using the Inventory of Depressive Symptomatology – Self Report (IDS-
SR; (32)) to capture changes in symptom severity, and the World Health Organisation’s Composite
Diagnostic Interview – Short Form (CIDI-SF; (33)) to identify people meeting DSM-5 criteria for MDD at
each timepoint. These two measurements were used to identify different operationalisations of
depression across follow-up, summarised in supplementary additional file 2. Briefly, participants were
categorised as being “symptomatic” (scoring ≥26 on the IDS-SR and meeting CIDI-SF criteria for MDD),
having “some symptoms” (scoring ≤25 on the IDS-SR and meeting CIDI-SF criteria for MDD; or >21 on the
IDS-SR and not meeting CIDI-SF criteria for MDD) or having “no symptoms” (scoring ≤21 on the IDS-SR
and not meeting CIDI-SF criteria for MDD).
As described previously (22), the primary outcome of interest in RADAR-MDD is depressive relapse,
defined here as switching from a state of “no symptoms” to “symptomatic” over a period of 6-months.
Secondary depression outcomes are: remission (switching from a state of “symptomatic” to “no
symptoms” over a period of 6-months); and change in the severity of depressive symptoms (measured
via the continuous IDS-SR).
Anxiety
Anxiety was measured via the 7-item Generalised Anxiety Disorder questionnaire (GAD7; (34)), used as a
continuous indicator of anxiety symptom severity (a total of 21, with higher scores indicating increased
anxiety severity) and a total score ≥10 indicating significant symptoms. This threshold has previously
been shown to have good levels of sensitivity and specificity (35).
Functional Ability
Functional ability was measured using the Work and Social Adjustment Scale (WSAS; (36), using a
continuous score from 0-40 to describe the level of impairment, with scores of 0-10, 11-20 and >20 to
indicate no, some and significant impairment respectively (36).
Page 9/33Alcohol Use
The Alcohol Use Disorders Identification Test (AUDIT; (37)) was used to measure alcohol use across
timepoints. A total score out of 40 describes the level of alcohol use; scores of 0-7 indicate low risk
alcohol consumption; 8-15 indicate hazardous alcohol consumption; 16-19 indicate harmful alcohol
consumption; and scores >20 indicate likely alcohol dependence. (38)
Illness Perceptions
The Brief Illness Perceptions Questionnaire (BIPQ; (39)) measured emotional and cognitive
representations of illness, capturing perceptions relating to illness identity, causes, control, consequences,
timeline, concern, understanding and emotional response. Total scores for each domain can be used
individually, or totalled, with higher scores representing a more threatening view of their illness.
Health Service Use
Access to health services, as well as changes in treatment, and care received was measured via a
modified Client Service Receipt Inventory (CSRI; (40)), adapted to be suitable for online delivery and
participant self-report.
Covariates
Life Events
Any significant life events which may have happened between outcome assessments were measured via
the List of Threatening Experiences Questionnaire (LTE-Q; (41)). Changes in employment status were
recorded regularly as part of the CSRI (40).
Medication Adherence
Self-reported adherence to depression medication was measured with the 5-item Medication Adherence
Report Scale (MARS-5; (42)).
Statistical Analyses
Baseline characteristics of the sample were described using means and standard deviations or numbers
and percentages as appropriate. To examine whether depressed mood is associated with the availability
of data across all modes of data collection, participants were divided using scores on the IDS-SR and
CIDI-SF (see additional file 2 for operationalisation) into those who are symptomatic at baseline and
those who are not (those with no symptoms and some symptoms are pooled together due to the low
number of people with no symptoms at baseline (N=4)). Chi-squared tests examined between group-
differences in categorial data, and linear regressions in continuous data.
Page 10/33The number and percentage of people who have provided any data via the aRMT and pRMT apps and
the wearable device throughout the course of follow-up have been summarised, then divided into
quartiles to examine the numbers of people who have provided 0-25% of expected data, 26-50%, 51-75%
and >75% of data throughout follow-up. Fitbit wear time estimates were calculated based on the presence
of a single heart rate value, greater than zero, per 15-minute window.
P-values comparing the amount of data available between people with symptoms of depression at
baseline and those without symptoms of depression at baseline were created using Chi-Squared tests. T-
tests compared the number of ESM questions completed in total across all follow-up timepoints between
those with and without depression symptoms at baseline. Data were analysed using STATA v16.0.
Results
Recruitment and Retention Rates
The first person was enrolled in RADAR-MDD on 30th November 2017, and recruitment ended on 3rd June
2020, representing a total of 30 months of recruitment. Figure 1 shows the participation rate, detailing the
total number of participants contacted and the reasons for non-participation.
Figure 2 shows the participant retention rate throughout the period of follow-up. At each timepoint, the
number of people eligible for contact for an outcome assessment decreased as: a) more people had
reached the end of the data collection period; and b) as people had been withdrawn from the study. As
the last participant was recruited in June 2020 and the study finished in April 2021, the minimum and
maximum lengths of possible follow-up were 11 months and 24 months respectively. The completion
rate of the primary and secondary outcomes in those who were eligible to complete it (those who had not
already completed the study or been previously withdrawn) was approximately 80% throughout follow-up
assessments.
Of the 623 participants enrolled in the study, 445 (71.4%) provided outcome data at 1-year follow-up and
181 (29.1%) participated for a full 2-years. A total of 497 people (79.8%) participated for the maximum
possible duration (from their enrolment until the end of data collection in April 2021), and 126 people
(20.2%) withdrew prematurely. Reasons for withdrawal are provided in additional file 3. The most
common reason for withdrawal across all timepoints was loss to follow-up (N = 47) and problems using
the Android study phone (for those who had switched from an iPhone for the purposes of the study; N =
14), representing 37.3% and 11.1% of all withdrawals respectively. A total of 8 participants identified
study burden as the main reason for withdrawal, including finding the study “too demanding” (N=6) or the
study “not meeting expectations” (N=2).
FIGURE 1. Recruitment into RADAR-MDD
FIGURE 2. Retention of participants throughout follow-up.
Page 11/33Figure 2 legend: Participants “not contacted” because they had already completed the maximum amount
of follow-up time or had already withdrawn from the study. Participants were “contacted” when they were
still active participants. *Reasons for withdrawal provided in additional file 3. **Invalid outcomes
collected ±21 days of due date.
Sample Characteristics
The target sample size of 600, across the three sites, was exceeded, with 623 individuals successfully
enrolled in the study. The baseline sociodemographic and clinical characteristics of this sample are
displayed in Table 1, with comparisons made between those with no/some symptoms at baseline and
those who are symptomatic at baseline (see additional file 4 for between-site stratification).
In comparison to those with no/some depression symptoms at baseline, the symptomatic group were:
significantly younger; had a higher proportion female, on long-term sick leave or unemployed, receiving
any kid of benefit, and earning less than £/€15,000 per annum. Regarding clinical characteristics, the
symptomatic group had a higher proportion of current smokers, medical comorbidities, as well as
increased levels of current depression, anxiety, functional disability, and worsened illness perceptions,
although lower levels of alcohol use.
Data collection with RMT
Data collection started on 30th November 2017, with data collection continuing until the last participant
was unenrolled from the study on 1st May 2021, resulting in a median study duration of participation of
541 days (interquartile range (IQR): 401-730 days, range: 0-1217 days). In total, data were collected from
two aRMT data sources: the RADAR-base aRMT app (PHQ8, RSES and speech tasks); and the THINC-it®
app (PDQ5, codebreaker, spotter, symbol check and trails tasks). Data were collected from two pRMT
data sources: the Fitbit (heart rate, steps, sleep stages, activity, and calories); and the RADAR-base pRMT
app (battery level, gyroscope, ambient noise, ambient light, GPS location, nearby Bluetooth devices, phone
usage, and app usage). A total of 2.9 terabytes of compressed data were collected, with 110 (17.7%)
participants having more than 50% available data across all modes of data collection.
Data collected via aRMT
Figures 3a-c display active RMT data collection stratified baseline depression status. Overall, participants
completed a median of 21 (IQR:9-31) PHQ-8 questionnaires, 20 (IQR:9-30) RSES questionnaires, 12
(IQR:2-23) speech tasks. A total of 95.3%, 94.5% and 82.2% of participants had any data available for the
PHQ8, RSES and speech tasks respectively. Chi squared tests found no significant differences in data
availability between those with or without depression symptoms at baseline for the PHQ8 (X2 (622,
N=623) = 3.0, p= 0.38), RSES (X2 (622, N=623) = 3.83, p= 0.28), or speech task (X2= 4.8, p= 0.19). The
Page 12/33mean numbers of ESM items completed by those with and without depression symptoms at baseline
throughout the study duration were 11.8 (SD = 23.7) and 11.9 (SD = 23.7) respectively, with t-tests
demonstrating no significant difference in ESM data availability between these groups (p=0.07).
Figure 4 displays THINC-it app® data collection stratified baseline depression symptom status. Overall,
participants completed a median of 5 (IQR:2-10) THINC-it app® PDQ5 questionnaires, 5 (IQR:2-9) Code
Breaker tasks, 5 (IQR:2-9) Spotter tasks, 5 (IQR-2-9) Symbol Check tasks, and 5 (IQR=2-10) Trails tasks. A
total of 90.5%, 84.4%, 84.8%, 84.6% and 89.9% of participants had any data available for the PDQ5, Code
Breaker, Spotter, Symbol Check and Trails test respectively. Chi squared tests found no significant
differences in data availability between those with or without depression at baseline for the PDQ5
(X2 (622, N=623) = 2.5, p= 0.48), Code Breaker (X2 (622, N=623) = 0.91, p = 0.82), Spotter (X2 (622, N=623)
= 1.28, p = 0.73), Symbol Check (X2 (622, N=623) = 1.26, 0.74) or Trails (X2 (622, N=623) = 2.0, p = 0.58)
tasks.
FIGURE 3. Illustration of data collected via RADAR-base aRMT app
Figure 3 legend: Questionnaires triggered every two weeks; maximum number of possible responses: 52.
3a: 8-item Patient Health Questionnaire (PHQ8); 3b: Rosenberg Self-Esteem Scale (RSES); 3c: Speech
data.
FIGURE 4. Illustration of data collected via THINC-it app
Figure 4 legend: Questionnaires triggered every 6 weeks; maximum number of possible responses: 17. 4a:
5-item Perceived Deficits Questionnaire (PDQ5); 4b: Code Breaker; 4c: Spotter; 4d: Symbol Check; 4e:
Trails.
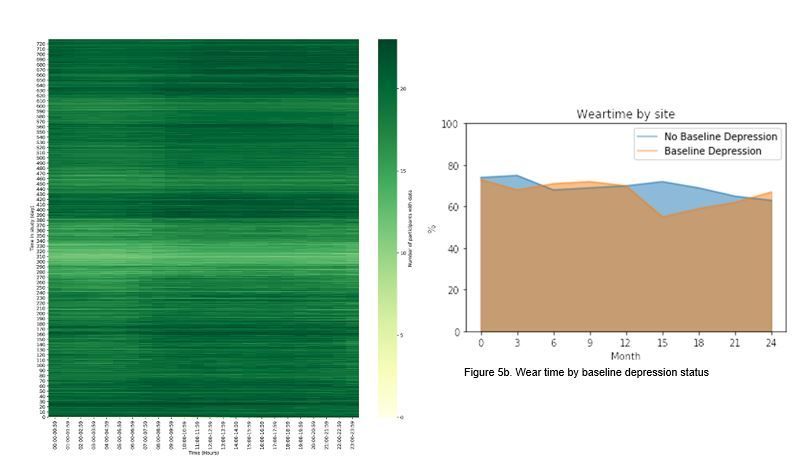
Data collected via wearable technology
Table 2 displays wearable RMT data collection using Fitbit, stratified by baseline depression status. Data
collection relied on 1) participants wearing the Fitbit device, 2) regularly charging and syncing the Fitbit
device; 3) data being returned/provided by the Fitbit servers. Fitbit wear-time varied during the study
(Figure 5a), with the average participant wear-time across the entire duration of follow-up estimated as
62.5% (SD: 9.1 percentage points; Figure 5b), and the average number of hours per day as 15.1 hours
(SD: 2.2 hours). Wear-time decreased over time and wear-time did not significantly differ between those
with no depression symptoms versus those with symptoms at baseline (X2(622, N=623) = 525616,
p=0.24).
Step count data were the most frequently available data, with almost 50% of participants providing >75%
of expected data throughout the course of follow-up. Activity data (comprising a combination of data
derived from Fitbit proprietary algorithms and via participants inputting their own activities manually)
was the least readily available data, with only 5% of participants having >75% data availability. Activity
data are also the only data type found to have significantly different levels of availability according to the
Page 13/33presence of depression at baseline or not (X2 (622, N=623) = 14.1, p = 0.002). In comparison to those
without depression at baseline, those identified as symptomatic at baseline had a significantly larger
percentage of people providing 25%
of data throughout the course of follow-up. Figure 5a shows a paler horizontal band of colour between
days 290 and 380 of study participation, indicating lower levels of wear-time during these time-points.
and figure 5b shows a dip in percentage wear-time in people with symptoms of depression at baseline
after the first year of participation.
Data collected via pRMT
Table 3 displays passive data collection across all smartphone sensors, stratified by the presence of
baseline depression. The most data were available for GPS location and battery level data. The least data
were available for phone usage. No evidence of a difference in data availability between those with and
without depression at baseline was identified.
FIGURE 5. Illustration of Fitbit data streams.
Figure 5 legend: A) Heatmap representing study day and data points per hour. B) percentage wear time
stratified by baseline depression status.
Discussion
Study Recruitment and Retention
Recruitment into RADAR-MDD was highly successful, with the flexibility of face-to-face and remote
enrolments resulting in the study exceeding its recruitment targets despite the COVID-19 pandemic (43).
Attrition rates in longitudinal research vary widely (44) and whilst there is no recognised threshold for
“acceptable” versus “unacceptable” dropout, follow-up levels of 50%, 60% and 70% have previously been
described as adequate, good and very good respectively (45). We report ~80% completion rates of our
outcomes across all follow-up timepoints, with 79.8% of all enrolled individuals completing the study
protocol for the maximum amount of time possible, representing excellent availability of our primary and
secondary outcome measures.
Sociodemographic Characteristics
The RADAR-MDD cohort has a higher proportion of White and Female individuals than would typically be
seen in the general population or depressed population (46), reflecting the tendency for White Females to
attend mental health services more often than their male/non-White counterparts, and their greater
likelihood of participating in research studies (47,48), however Ethnicity data were only collected in
London and Amsterdam. The mean age and gender distribution in our participants is comparable to other
Page 14/33MDD samples, such as Sequenced Treatment Alternatives to Relieve Depression (STAR*D; (49)) and the Rhode Island Methods to Improve Diagnostic Assessment and Services (MIDAS; (50)). These characteristics may limit the generalisability of our findings to the wider population. It is also worth noting that ethnic groups across the two countries who collected ethnicity data are challenging to compare, meaning that in-depth interrogation of racial differences in outcomes will be affected by small cell sizes unless ethnic groups are merged into larger, less descriptive categories. In terms of clinical presentation, our sample have slightly lower levels of current depression severity and reduced WSAS functional disability than those recruited into STAR*D (49). RMT Domains and Data Availability Data availability varied across the RMT domains. Over 90% of participants had data available for analysis from the aRMT, with the PHQ-8 and RSES having the largest amount of data available for the most people. The least amount of aRMT data was available for all assessments conducted via the THINC-it® app, with
To the best of our knowledge, no remote measurement studies have reported the quantity of data
collected via smartphone sensors. The largest amount of data were available for battery level and GPS
sensors. For a multiparametric analysis, data across multiple sensor types will be needed. We report a
total of 110 individuals (17.7% of the entire sample) who have >50% of data for data types. It is important
to acknowledge this as an indicator of the amount of resource and data collection required for
multiparametric analyses. Although a remote study by nature, participants had close contact with the
research team throughout the study; the researchers were available for technical support and
questionnaire reminders, in addition to conducting risk assessments based on questionnaire answers.
Future work will need to investigate the minimum amount of contact time required to acquire usable data,
for real-world implementation to be viable.

Limitations
There are several limitations and challenges presented by the current paper. Firstly, each of the sensor
and data types collected has different temporal validity and aggregation requirements. For example,
sleep data are only meaningful when aggregated from midday-midday, whereas activity data are more
relevant when calculated from midnight-midnight. At a granular level, data from smartphone and
wearable sensors are so fine that no meaningful inferences can be gained, requiring some form of
aggregation which may not be the same across different sensors; whereas heart-rate data might be
collected every 5 seconds and summarised across an hour, the aggregation of GPS data is dependent on
the smartphone device being used. In the current paper we have endeavoured to summarise data
availability as coherently as possible within these constraints, aiming to provide an easily replicable,
comparable, and interpretable description of the data available within our dataset.

It is also essential to acknowledge the technical challenges inherent to multimodal data collection across
long periods of time. RADAR-base and its associated apps were developed and piloted within the main
data collection period, with iterative changes and updates being made throughout the course of follow-
up. These changes may have been implemented to overcome a system-related issue introduced by the
updates to the Android operating system, or in direct response to participant or researcher feedback. This
flexibility in app design and development is essential to maintain app compatibility; this means that an
individual participating throughout 2019-2020 will have had a different user experience to an individual
participating throughout 2020-2021.

Whilst the majority of our recruitment occurred before the global pandemic, the threat posed by COVID-19
may have affected existing participants’ research experience; recent evidence suggests that people with
moderate/severe levels of depression who are already enrolled in a research study show a reduced ability
and desire to adhere to research protocols due to COVID-19 (54). Given the high level of depressive
symptoms in our sample, the pandemic and its associated social interventions may have added a burden
to participants resulting in an increased dropout rate and reduced adherence to the study protocol. We
have previously reported the impact of the pandemic and associated social interventions on the data

                                                  Page 16/33
collected via RMT across the RADAR-CNS clinical studies (55) and future work will extend this to examine
how the pandemic may have affected data availability.
Despite these limitations, RADAR-MDD remains the largest, most ambitious multimodal RMT study in the
field of mental health. A recent systematic review summarising studies using passive and active
smartphone-based measurements in affective disorders found only 5 studies in people with MDD, and
these studies reported a median sample size of 5, and median follow-up time of 4 weeks (56). It is
essential to remember the scope of the RADAR-MDD research protocol and to be mindful of the
exploratory nature of this novel method of data collection. This paper is the first to describe an extremely
complex set of data as transparently as possible, to clarify the extent of the data available for future
analyses.
Future Research
There are some vital next steps in the exploration of RADAR-MDD data which will be examined in addition
to the primary objectives of the RADAR-MDD study (22). Firstly, as reported earlier, the present paper
reports the amount of data available across all modes of data collection. A more thorough investigation
into the quality of the data is warranted before more complex analyses are conducted. Furthermore,
whilst we have provided some preliminary results indicating no evidence of a link between baseline
depression status and data availability, a much more detailed and rigorous investigation is needed. It is
likely that fluctuations in depression symptoms over time are more relevant for predicting technology use,
rather than a static baseline status and we will be examining this in more detail in the future. Our next
steps will also be to examine sociodemographic, clinical and technical predictors of data availability; a
separate paper dedicated to this question is needed to do justice to the amount of data available and the
importance of understanding missing data in this context.
Conclusion
The data collected in RADAR-MDD indicates that collecting RMT data from clinical populations is
feasible. We found comparable levels of data availability in active (requiring input from the participant)
and passive (requiring no input from the participant) forms of data collection, demonstrating that both
are feasible in this patient group. However, data availability will depend on the data type, with higher
burden data sources (such as cognitive tasks, or keeping wearable devices charged) reducing data
availability. There was no convincing indication that the severity of depression symptoms at baseline
was associated with data availability, in this sample. The next steps are to illustrate the predictive value
of these data, which will be the focus of our future data analysis aims.
Declarations
Ethical Approvals and Consent to Participate
Page 17/33Ethical approvals for study conduct were obtained from the Camberwell St Giles Research Ethics
Committee (REC reference: 17/LO/1154), in London from the CEIC Fundacio Sant Joan de Deu (CI: PIC-
128-17) in Barcelona, and from the Medische Ethische Toetsingscommissie VUms (METc VUmc
registratienummer: 2018.012 – NL63557.029.17) in the Netherlands. RADAR-MDD was conducted per the
Declaration of Helsinki and Good Clinical Practice, adhering to principles outlined in the NHS Research
Governance Framework for Health and Social Care (2nd edition).
Consent to Publish
Not applicable
Availability of Data and Materials
The datasets used and/or analysed during the current study are available from the corresponding author
on reasonable request.
Competing Interests
JCB and PA are full-time employees of H. Lundbeck A/S. DCM has accepted honoraria and consulting
fees from Apple, Inc., Otsuka Pharmaceuticals, Pear Therapeutics, and the One Mind Foundation,
royalties from Oxford Press, and has an ownership interest in Adaptive Health, Inc. NVM is an employee
of Janssen Pharmaceutica NV and may hold company equity.
QL, NM, SV and VN are employees of Janssen Research & Development, LLC and hold company
stocks/stock options. JMH has received economic compensation for participating in advisory boards or
giving educational lectures from Eli Lilly & Co, Sanofi, Lundbeck, and Otsuka. No other authors have
competing interests to declare.
Funding
The RADAR-CNS project has received funding from the Innovative Medicines Initiative 2 Joint
Undertaking under grant agreement No 115902. This Joint Undertaking receives support from the
European Union’s Horizon 2020 research and innovation programme and EFPIA (www.imi.europa.eu).
This communication reflects the views of the RADAR-CNS consortium and neither IMI nor the European
Union and EFPIA are liable for any use that may be made of the information contained herein. The
funding body have not been involved in the design of the study, the collection or analysis of data, or the
interpretation of data.
Page 18/33Author’s contributions
FM has contributed to the design and coordination of the study in London, as well as leading on data
analysis and write-up of this manuscript. DL has contributed to data processing and analysis. SS has
contributed to design and coordination of the study in Barcelona. FL has contributed to design and
coordination of the study in Amsterdam. KMW has contributed to the study conduct in London. PA has
contributed to the design and development of the study. GG has contributed to the design and
development of the study. SD has contributed to the study conduct in Amsterdam. JMH has contributed
to the study design and conduct in Barcelona. MHorsfall has contributed to the study conduct in
Amsterdam. AI has contributed to the study conduct in London. GL has contributed to the study conduct
in London. QL has contributed to the development and design of the study. FL has contributed to the
study conduct in Barcelona. DCM has contributed to the design and development of the study. VN has
contributed to the design and development of the study. CO has contributed to the study conduct in
London. BWJHP has contributed to the development and design of the study. SS has contributed to the
development and design of the study. TW has contributed to the development and design of the study. SB
has contributed to the design and development of the study. CB has contributed to the design and
development of the study. IMG has contributed to the design and development of the study. AR has
contributed to the design and development of the study. PC has contributed to the development of the
RADAR-base system used for data collection and management across all sites, data protection, security
and storage systems. RJD, AF, YR, ZR and CS have contributed to the development of the RADAR-base
system used for data collection and management across all sites, data protection, security and storage
systems. NC has contributed to data processing and interpretation. NVM has contributed to data
processing and interpretation. SV has contributed to data processing and interpretation. MHotopf has
contributed to study development and design and conduct.
All authors have all been involved in reviewing the manuscript and have given approval for the it to be
published. All authors have agreed to be accountable for all aspects of the work, ensuring that questions
relating to the accuracy or the integrity of any part of the work are appropriately investigated and
resolved.
Acknowledgements
This paper represents independent research part funded by the National Institute for Health Research
(NIHR) Maudsley Biomedical Research Centre at South London and Maudsley NHS Foundation Trust and
King’s College London. The views expressed are those of the author(s) and not necessarily those of the
NHS, the NIHR or the Department of Health and Social Care. We thank all the members of the RADAR-CNS
patient advisory board for their contribution to the device selection procedures, and their invaluable
advice throughout the study protocol design. We also thank Line Kühnel for providing feedback on an
early version of this manuscript. Participant recruitment in Amsterdam was partially accomplished
through Hersenonderzoek.nl, a Dutch online registry that facilitates participant recruitment for
Page 19/33neuroscience studies (https://hersenonderzoek.nl/). Hersenonderzoek.nl is funded by ZonMw-Memorabel
(project no 73305095003), a project in the context of the Dutch Deltaplan Dementie, Gieskes-Strijbis
Foundation, the Alzheimer's Society in the Netherlands and Brain Foundation Netherlands. Participants in
Spain were recruited through the following institutions: Parc Sanitari Sant Joan de Déu network of mental
health services (Barcelona); Institut Català de la Salut primary care services (Barcelona); Institut Pere
Mata-Mental Health Care (Tarrassa); Hospital Clínico San Carlos (Madrid).
This research was reviewed by a team with experience of mental health problems and their carers who
have been specially trained to advise on research proposals and documentation through the Feasibility
and Acceptability Support Team for Researchers (FAST-R): a free, confidential service in England provided
by the National Institute for Health Research Maudsley Biomedical Research Centre via King’s College
London and South London and Maudsley NHS Foundation Trust.
RJBD is supported by the following: (1) NIHR Biomedical Research Centre at South London and
Maudsley NHS Foundation Trust and King’s College London, London, UK; (2) Health Data Research UK,
which is funded by the UK Medical Research Council, Engineering and Physical Sciences Research
Council, Economic and Social Research Council, Department of Health and Social Care (England), Chief
Scientist Office of the Scottish Government Health and Social Care Directorates, Health and Social Care
Research and Development Division (Welsh Government), Public Health Agency (Northern Ireland), British
Heart Foundation and Wellcome Trust; (3) The BigData@Heart Consortium, funded by the Innovative
Medicines Initiative-2 Joint Undertaking under grant agreement No. 116074. This Joint Undertaking
receives support from the European Union’s Horizon 2020 research and innovation programme and
EFPIA; it is chaired by DE Grobbee and SD Anker, partnering with 20 academic and industry partners and
ESC; (4) the National Institute for Health Research University College London Hospitals Biomedical
Research Centre; (5) the National Institute for Health Research (NIHR) Biomedical Research Centre at
South London and Maudsley NHS Foundation Trust and King’s College London; (6) the UK Research and
Innovation London Medical Imaging & Artificial Intelligence Centre for Value Based Healthcare; (7) the
National Institute for Health Research (NIHR) Applied Research Collaboration South London (NIHR ARC
South London) at King’s College Hospital NHS Foundation Trust.
References
1. James SL, Abate D, Abate KH, Abay SM, Abbafati C, Abbasi N, et al. Global, regional, and national
incidence, prevalence, and years lived with disability for 354 diseases and injuries for 195 countries
and territories, 1990-2017: A systematic analysis for the Global Burden of Diseases Study 2017.
Lancet. 2018;392:1789-858.
Page 20/332. Beratis S, Katrivanou A, Georgiou S, Monastirli A, Pasmatzi E, Gourzis P, et al. Major depression and
risk of depressive symptomatology associated with short-term and low-dose interferon- α treatment.
J Psychosom Res. 2005;doi: 10.1016/j.jpsychores.2004.03.010.
3. Cambridge OR, Knight MJ, Mills N, Baune BT. The clinical relationship between cognitive impairment
and psychosocial functioning in major depressive disorder: A systematic review. Psychiatr Res. 2018;
doi: 10.1016/j.psychres.2018.08.033.
4. Saragoussi D, Christensen MC, Hammer-Helmich L, Rive B, Touya M, Haro JM. Long-term follow-up
on health-related quality of life in major depressive disorder: A 2-year european cohort study.
Neuropsychiatr Dis Treat. 2018;14:1339-50.
5. Miloyan B, Fried E. A reassessment of the relationship between depression and all-cause mortality in
3,604,005 participants from 293 studies. World Psychiatr. 2017; doi: 10.1002/wps.20439.
6. Verduijn J, Verhoeven JE, Milaneschi Y, Schoevers RA, van Hemert AM, Beekman ATF, et al.
Reconsidering the prognosis of major depressive disorder across diagnostic boundaries: full recovery
is the exception rather than the rule. BMC Med. 2017; doi: 10.1186/s12916-017-0972-8.
7. Blanco C, Okunda M, Markowitz, John C, Liu S-M, Grant, Bridget F, Hasin, Deborah S. The
epidemiology of chronic major depressive disorder and dysthymic disorder: Results from the
National Epidemiologic Survey on Alcohol and Related Conditions. J Clin Psychiatr. 2010;17:1645-
56.
8. Wells JE, Horwood LJ. How accurate is recall of key symptoms of depression? A comparison of
recall and longitudinal reports. Psychol Med. 2004;34:1001-11.
9. Mohr DC, Shilton K, Hotopf M. Digital phenotyping, behavioral sensing, or personal sensing: names
and transparency in the digital age. npj Dig Med. 2020: doi: 10.1038/s41746-020-0251-5.
10. Marzano L, Hollis C, Cipriani A, Malhi GS. Digital technology: Coming of age? Ev Based Mental
Health. 2017;20:97.
11. Cornet VP, Holden RJ. Systematic review of smartphone-based passive sensing for health and
wellbeing. J Biomen Inform. 2018. Doi: 10.1016/j.jbi.2017.12.008.
12. Myin-Germeys I, Oorschot M, Collip D, Lataster J, Delespaul P, van Os J. Experience sampling
research in psychopathology: opening the black box of daily life. Psychol Med. 2009;39:1533-47.
13. Firth J, Torous J, Nicholas J, Carney R, Pratap A, Rosenbaum S, et al. The efficacy of smartphone-
based mental health interventions for depressive symptoms: a meta-analysis of randomized
controlled trials. World Psychiatry. 2017. 16:287-98.
14. Digital Health Funding and M&A 2018 Fourth Quarter and Annual Report. 2018. Available
from: http://www.mercomcapital.com.
15. Localytics. App Uninstall Statistics 2019: 25% App Abandonment. 2019. Available
from:https://uplandsoftware.com/localytics/resources/blog/25-of-users-abandon-apps-after-one-
use/.
16. Fleming T, Bavin L, Lucassen M, Stasiak K, Hopkins S, Merry S. Beyond the trial: Systematic review of
real-world uptake and engagement with digital self-help interventions for depression, low mood, or
Page 21/33anxiety. J Med Internet Res. 2018. 20:e199.
17. Greer B, Robotham D, Simblett S, Curtis H, Griffiths H, Wykes T. Digital exclusion among mental
health service users: a qualitative investigation. J Med Internet Res. 2019. Doi: 10.2196/11696.
18. Simblett S, Matcham F, Siddi S, Bulgari V, di San Pietro CB, López JH, et al. Barriers to and facilitators
of engagement with mHealth technology for remote measurement and management of depression:
Qualitative analysis. JMIR mHealth uHealth. 2019. Doi: 10.2196/11325.
19. Szinay D, Jones A, Chadborn T, Brown J, Naughton F. Influences on the uptake of and engagement
with health and well-being smartphone apps: Systematic review. JMIR. 2020. Doi: 10.2196/17572.
20. Pham Q, Graham G, Carrion C, Morita PP, Seto E, Stinson JN, et al. A library of analytic indicators to
evaluate effective engagement with consumer mHealth apps for chronic conditions: Scoping review.
JMIR mHealth uHealth. 2019. 7;e11941.
21. Remote Assessment of Disease and Relapse – Central Nervous System. RADAR-CNS. 2018.
Available from: www.radar-cns.org.
22. Matcham F, Barattieri Di San Pietro C, Bulgari V, De Girolamo G, Dobson R, Eriksson H, et al. Remote
assessment of disease and relapse in major depressive disorder (RADAR-MDD): A multi-centre
prospective cohort study protocol. BMC Psychiatry. 2019; doi: 10.1186/s12888-019-2049-z.
23. Simblett S, Greer B, Matcham F, Curtis H, Polhemus A, Ferrão J, et al. Barriers to and facilitators of
engagement with remote measurement technology for managing health: Systematic review and
content analysis of findings. JMIR. 2018. 20:210480.
24. Bot M, Middeldorp CM, de Geus EJC, Lau HM, Sinke M, van Nieuwenhuizen B, et al. Validity of LIDAS
(LIfetime Depression Assessment Self-report): a self-report online assessment of lifetime major
depressive disorder. Psychol Med. 2017. 47:279-89.
25. Ranjan Y, Rashid Z, Stewart C, Conde P, Begale M, Verbeeck D, et al. RADAR-base: Open source mobile
health platform for collecting, monitoring, and analyzing data using sensors, wearables, and mobile
devices. JMIR mHealth uHealth. 2019. Doi: 10.2196/11734.
26. Kroenke K, Strine TW, Spitzer, Robert L, Williams J, Berry JT, Mokdad AH. The PHQ-8 as a measure of
current depression in the general population. J Affect Disord. 2009.114:163–73.
27. Greenberger E, Chen C, Dmitrieva J, Farruggia SP. Item-wording and the dimensionality of the
Rosenberg Self-Esteem Scale: do they matter? Pers Individ Dif 2003. 35:1241-54.
28. Williamson JR, Quatieri TF, Helfer BS, Ciccarellu G, Mehta DD. Vocal and facial biomarkers of
dperession based on motor incoordination and timing. In: 4th International Audio/Visual Emotion
Challenge and Workshop: Depression Challenge. 2014.doi: 10.1145/2661806.2661809.
29. McIntyre RS, Best MW, Bowie CR, Carmona NE, Cha DS, Lee Y, et al. The THINC-integrated tool
(THINC-it) screening assessment for cognitive dysfunction: Validation in patients with major
depressive disorder. J Clin Psychiatry. 2017. 78:873-81.
30. Lam RW, Lamy FX, Danchenko N, Yarlas A, White MK, Rive B, et al. Psychometric validation of the
perceived deficits questionnaire-depression (PDQ-D) instrument in US and UK respondents with
major depressive disorder. Neuropsychiatr Dis Treat. 2018. 14:2861-77.
Page 22/33You can also read