Predictive Modeling of Morbidity and Mortality in Patients Hospitalized With COVID-19 and its Clinical Implications: Algorithm Development and ...
←
→
Page content transcription
If your browser does not render page correctly, please read the page content below
JOURNAL OF MEDICAL INTERNET RESEARCH                                                                                                         Wang et al

     Original Paper

     Predictive Modeling of Morbidity and Mortality in Patients
     Hospitalized With COVID-19 and its Clinical Implications: Algorithm
     Development and Interpretation

     Joshua M Wang1,2,3, BSc; Wenke Liu1,2, PhD; Xiaoshan Chen4, MD; Michael P McRae5, PhD; John T McDevitt5,
     PhD; David Fenyö1,2,6, PhD
     1
      Institute for Systems Genetics, NYU Grossman School of Medicine, New York, NY, United States
     2
      Department of Biochemistry and Molecular Pharmacology, NYU Grossman School of Medicine, New York, NY, United States
     3
      Vilcek Institute of Graduate Biomedical Sciences, NYU Grossman School of Medicine, New York, NY, United States
     4
      Department of Medicine, NYU Grossman School of Medicine, New York, NY, United States
     5
      Department of Biomaterials, Bioengineering Institute, New York University, New York, NY, United States
     6
      NYU Langone Health, New York, NY, United States

     Corresponding Author:
     David Fenyö, PhD
     NYU Langone Health
     435 E 30th St 9th Floor, Room 907
     New York, NY, 10016
     United States
     Phone: 1 917 754 6066
     Email: david@fenyolab.org

     Abstract
     Background: The COVID-19 pandemic began in early 2021 and placed significant strains on health care systems worldwide.
     There remains a compelling need to analyze factors that are predictive for patients at elevated risk of morbidity and mortality.
     Objective: The goal of this retrospective study of patients who tested positive with COVID-19 and were treated at NYU (New
     York University) Langone Health was to identify clinical markers predictive of disease severity in order to assist in clinical
     decision triage and to provide additional biological insights into disease progression.
     Methods: The clinical activity of 3740 patients at NYU Langone Hospital was obtained between January and August 2020;
     patient data were deidentified. Models were trained on clinical data during different parts of their hospital stay to predict three
     clinical outcomes: deceased, ventilated, or admitted to the intensive care unit (ICU).
     Results: The XGBoost (eXtreme Gradient Boosting) model that was trained on clinical data from the final 24 hours excelled
     at predicting mortality (area under the curve [AUC]=0.92; specificity=86%; and sensitivity=85%). Respiration rate was the most
     important feature, followed by SpO2 (peripheral oxygen saturation) and being aged 75 years and over. Performance of this model
     to predict the deceased outcome extended 5 days prior, with AUC=0.81, specificity=70%, and sensitivity=75%. When only using
     clinical data from the first 24 hours, AUCs of 0.79, 0.80, and 0.77 were obtained for deceased, ventilated, or ICU-admitted
     outcomes, respectively. Although respiration rate and SpO2 levels offered the highest feature importance, other canonical markers,
     including diabetic history, age, and temperature, offered minimal gain. When lab values were incorporated, prediction of mortality
     benefited the most from blood urea nitrogen and lactate dehydrogenase (LDH). Features that were predictive of morbidity included
     LDH, calcium, glucose, and C-reactive protein.
     Conclusions: Together, this work summarizes efforts to systematically examine the importance of a wide range of features
     across different endpoint outcomes and at different hospitalization time points.

     (J Med Internet Res 2021;23(7):e29514) doi: 10.2196/29514

     KEYWORDS
     COVID-19; coronavirus; SARS-CoV-2; predictive modeling; New York City; prediction; model; machine learning; morbidity;
     mortality; hospital; marker; severity; symptom; decision making; outcome

     https://www.jmir.org/2021/7/e29514                                                                  J Med Internet Res 2021 | vol. 23 | iss. 7 | e29514 | p. 1
                                                                                                                       (page number not for citation purposes)
XSL• FO
RenderX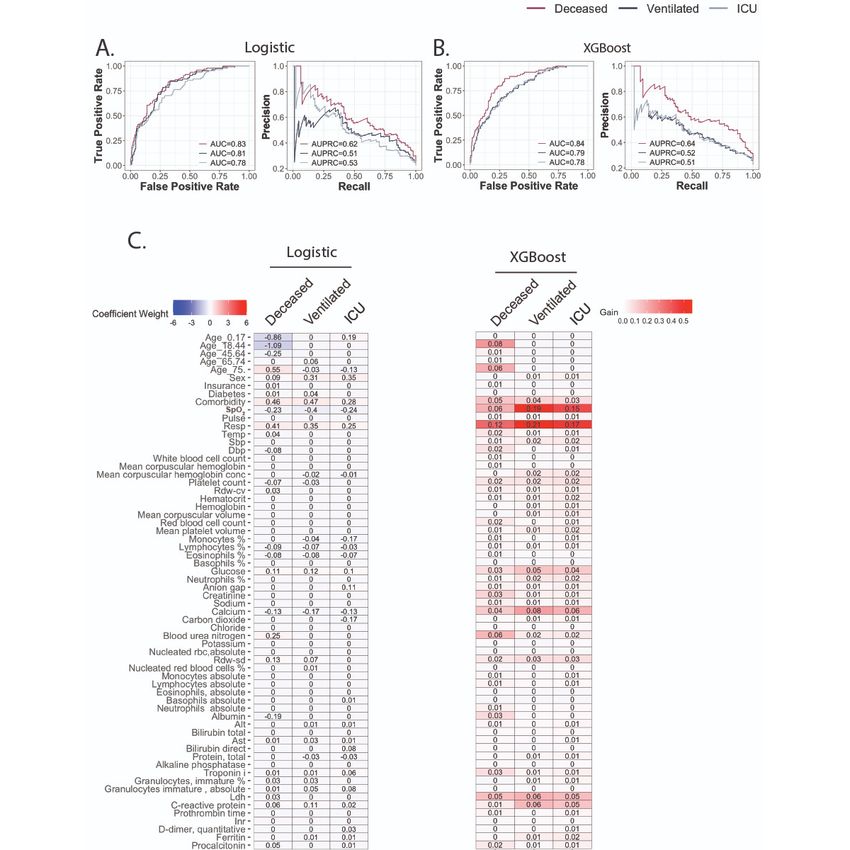
JOURNAL OF MEDICAL INTERNET RESEARCH                                                                                                   Wang et al

                                                                          capacity of XGBoost better handles data complexities to explore
     Introduction                                                         the extent to which predictive performance can be optimized.
     The first cluster of SARS-CoV-2 cases was reported in Wuhan,         Together, this study aimed to provide a holistic survey of the
     Hubei Province, China, on December 31, 2019. With symptoms           clinical underpinnings of disease etiology for patients with
     remarkably similar to pneumonia, the disease quickly traveled        COVID-19 admitted to NYU Langone Hospital. In addition,
     around the world, earning its pandemic status by the World           we sought to explore the prospects of building models that are
     Health Organization on March 11, 2020. Although the first            sufficiently competent to be effective decision support tools.
     wave has since passed for the hardest-hit regions, such as New
     York City and most of Asia, a resurgence of cases has already        Methods
     been reported in Europe and a record number of new cases has
     been tallied in the Midwest and rural United States. As of
                                                                          Ethics Statement
     November 12, 2020, the United States alone logged its highest        An ethics exemption and a waiver were confirmed through the
     tally to date, with a 317% growth over the preceding 30 days         Institutional Review Board (IRB) at NYU Grossman School of
     [1]. COVID-19 is far from seeing the end of its days and there       Medicine. An IRB self-certification form was completed to
     remains a compelling need to prioritize care and resources for       ensure that the subsequent research did not fall under human
     patients at elevated risk of morbidity and mortality.                subject research; therefore, no IRB approval was required. The
                                                                          deidentified COVID-19 NYU Langone Database was stripped
     Previous work building machine learning models used patient          of all unique identifiers prior to receiving data. In addition, all
     data from Tongji Hospital in Wuhan, China [2,3]; Zhongnan            dates were shifted by an arbitrary number of days for each
     Hospital in Wuhan, China [4]; Mount Sinai Hospital in New            patient. These safeguards ensured that patient data could not be
     York City, United States [5]; and NYU (New York University)          reidentified; thus, they were not subject to Health Insurance
     Family Health Center in New York City, United States [6].            Portability and Accountability Act (HIPAA) restrictions on
     Surprisingly, clinical features that were selected varied widely     research use and did not require IRB approval.
     across studies. For example, while McRae et al’s two-tiered
     model [6] that was trained on 701 patients in New York City          Data Collection
     to predict mortality was based on actual age, C-reactive protein     The clinical activity of patients at NYU Langone Hospital was
     (CRP), procalcitonin, and D-dimer, Yan et al’s model [2] that        obtained      from      Epic—electronic       medical      record
     was trained on 485 patients from Wuhan selected lactate              system—between January 1 and August 7, 2020. The data were
     dehydrogenase (LDH), lymphocyte count, and CRP as the most           stripped of all unique identifiers (medical record numbers,
     predictive for mortality. Variations in selected features differed   names, etc) and actual dates were shifted by an arbitrary number
     greatly, even when trained to predict similar outcomes on data       of days for each patient, which ensured that no data were subject
     from patients of the same city. Yao et al’s model [3] was trained    to HIPAA restrictions and, thus, did not require IRB approval.
     on 137 patients from Wuhan, and the final model relied on 28
     biomarkers to predict morbidity. Given the differences among         Clinical Data Preprocessing and Cleaning
     prior models, some of which were driven by domain-specific           Overview
     knowledge, we decided to systematically examine the
     importance of a wide range of features across different endpoint     Our data set contained 206,677 patients who were tested for
     outcomes and at different hospitalization time points.               COVID-19, of which 12,473 (6.0%) tested positive (Multimedia
                                                                          Appendix 1). Not all patients who tested positive sought hospital
     This study analyzed retrospective polymerase chain reaction          care, and without vital signs or lab values, these patients were
     (PCR)–confirmed data from inpatients with COVID-19 that              excluded from analysis. In addition, a majority of the 175,507
     were collected at NYU Langone Hospital, spanning from                patients diagnosed with COVID-19 did not receive in-house
     January 1 to August 7, 2020, to predict three sets of clinical       PCR tests, which makes it difficult to distinguish which hospital
     outcomes: alive versus deceased, ventilated versus not               encounters were related to seeking COVID-19 treatment. Thus,
     ventilated, or intensive care unit (ICU) admitted versus not ICU     only patients for which we could confirm a positive PCR test
     admitted. The clinical information of 3740 patient encounters        as reported by NYU Langone Hospital were included. The time
     included demographic data (ie, age, sex, insurance, past             stamp of the first encounter in which a PCR test returned a
     diagnosis of diabetes, and presence of cardiovascular                positive result was used as the starting date for each patient,
     comorbidities), vital signs (ie, SpO2 [peripheral oxygen             and the ending date was determined by either the time of
     saturation], pulse, respiration rate, temperature, systolic blood    discharge for that encounter or the time of death. The clinical
     pressure, and diastolic blood pressure), and the 50 most             features that were collected for each patient, along with their
     frequently ordered lab tests in our data set. Models were            definitions and additional processing steps, are described in the
     developed using two methods: logistic regression with feature        following subsections.
     selection using the least absolute shrinkage and selection
     operator (LASSO) [7] and gradient tree boosting with XGBoost         Categorical Features
     (eXtreme Gradient Boosting) [8]. An explainable algorithm,           The categorical features collected for each patient are listed in
     such as logistic regression, provides easy-to-interpret insights     Textbox 1.
     into the features of importance. Conversely, the larger model

     https://www.jmir.org/2021/7/e29514                                                            J Med Internet Res 2021 | vol. 23 | iss. 7 | e29514 | p. 2
                                                                                                                 (page number not for citation purposes)
XSL• FO
RenderX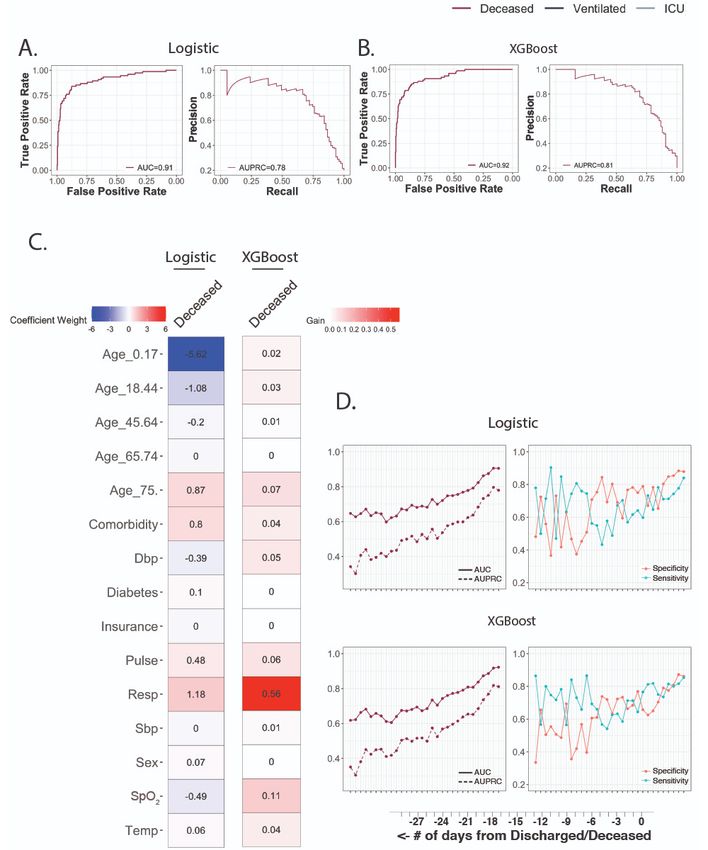
JOURNAL OF MEDICAL INTERNET RESEARCH                                                                                                               Wang et al

     Textbox 1. Categorical features.
      Binned ages—to comply with Health Insurance Portability and Accountability Act restrictions on research use, exact patient ages were removed and
      binned into predefined ranges, as determined by the Data Handling Committee:

      •    0-17 years

      •    18-44 years

      •    45-64 years

      •    65-74 years

      •    75+ years

      Gender:

      •    0 for female

      •    1 for male

      Insurance type:

      •    0 for preferred provider organization

      •    1 for exclusive provider organization, health maintenance organization, point-of-service-plan, indemnity, Medicare, Medicare managed care, no
           fault, and workers’ compensation

      •    2 for Medicaid and Medicaid managed care

      Diabetes:

      •    1 for any past diagnosis mentioning diabetes

      •    0 otherwise

      Cardiovascular comorbidities:

      •    1 for any of the following ICD-10 (International Statistical Classification of Diseases and Related Health Problems, 10th Revision) diagnosis
           codes: I10-I16 (hypertensive diseases), I20-I25 (ischemic heart diseases), I50 (heart failure), I60-I69 (cerebrovascular diseases), and I72 (other
           aneurysms)

      •    0 otherwise

                                                                                   windows that began from time of hospitalization. Within each
     Continuous Features                                                           window, values were averaged. Values were then standardized
     For each of the following continuous features (Textbox 2),                    to a mean of 0 and variance of 1. For each day, encounters
     multiple periodic measurements were recorded for each patient                 without all features listed in Textbox 2 were removed and were
     by vital signs monitors. Measurements were binned into 24-hour                not imputed.
     Textbox 2. Continuous features.

      •    SpO2 (peripheral oxygen saturation) (%)

      •    Pulse (bpm [beats per minute])

      •    Respiration rate (bpm)

      •    Temperature (°F)

      •    Systolic blood pressure (mm Hg)

      •    Diastolic blood pressure (mm Hg)

     Outcomes
     The outcomes for each patient are listed in Textbox 3.

     https://www.jmir.org/2021/7/e29514                                                                        J Med Internet Res 2021 | vol. 23 | iss. 7 | e29514 | p. 3
                                                                                                                             (page number not for citation purposes)
XSL• FO
RenderX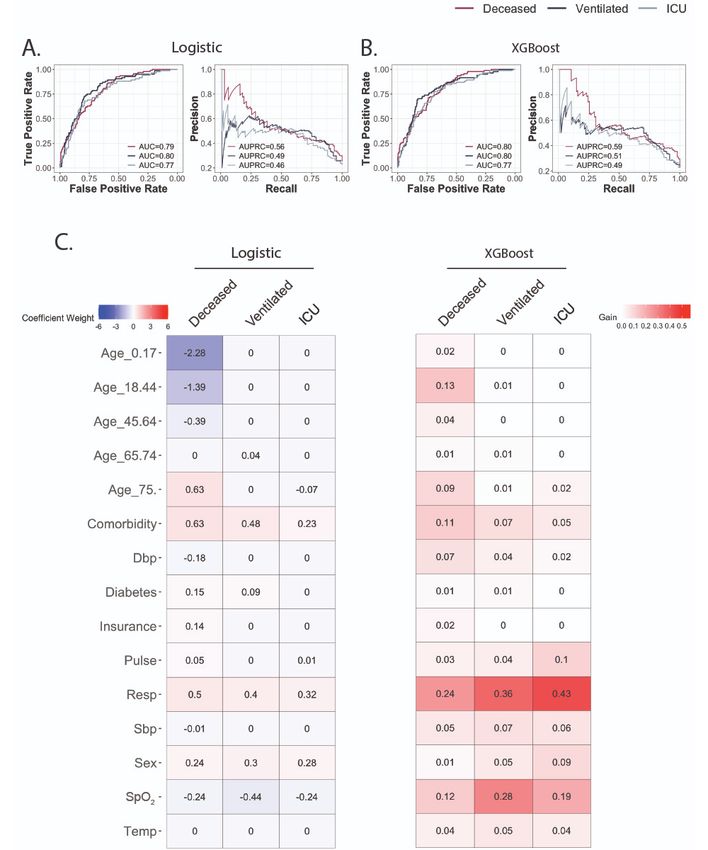
JOURNAL OF MEDICAL INTERNET RESEARCH                                                                                                               Wang et al

     Textbox 3. Patient outcomes.
      Living status:

      •    0 for alive

      •    1 for dead

      Ventilation at any point during hospitalization:

      •    0 for no (did not receive any form of ventilation or only received noninvasive treatments; eg, nasal cannula, nonrebreather mask, etc)

      •    1 for yes (received mechanical ventilation treatment)

      Intensive care unit admission for any duration during hospitalization—criteria determined by medical triage team, balanced between disease severity
      and hospital resource availability:

      •    0 for no

      •    1 for yes

                                                                                  previous value (ie, forward filling). After imputation, time points
     Lab Data Selection and Cleaning                                              with incomplete feature measurements were discarded, and each
     Lab tests with at least 50% completeness during the first 24                 patient record was segmented into nonoverlapping sequences
     hours for all encounters were considered. Of the 54 lab tests                of length 8. Patients were randomly assigned to training,
     meeting these requirements, the estimated glomerular filtration              validation, and testing groups in an 8:1:1 ratio for three
     rate—non-African and African American—was removed due                        independent splits. All models were implemented in Python 3.6
     to the formula’s dependency on lab features already selected                 (Python Software Foundation) with built-in units in TensorFlow
     (ie, creatinine). In addition, the placeholders for ordering a               2 and Keras [9]. Logistic regression was fit as a neural network
     complete blood count with differential test and a COVID-19                   with the sigmoid output node immediately after the input layer.
     PCR test were also removed. Missing lab values were imputed                  For multilayer perceptron (MLP), recurrent neural network
     using the multivariate imputation by chained equations                       (RNN), gated recurrent unit (GRU), and long short-term memory
     algorithm. Five imputations were generated using predictive                  (LSTM) models, a hidden layer of size 8 was added, and the
     mean matching. After imputation, lab values were shifted up                  time series models (ie, RNN, GRU, and LSTM) were unrolled
     by 1 and log-transformed. Model-building approaches that                     over eight time points and trained with true labels provided at
     incorporated lab features had individual models built for each               each step. Five randomly initialized models were trained for all
     imputation.                                                                  architectures on each training, validation, and testing split.
                                                                                  Model performance was evaluated based on all single time point
     Feature Selection and Model Building
                                                                                  predictions and reported as a mean value across all splits.
     All models were trained with a training data to validation data
     ratio split of 90:10. Features for logistic regression were selected         Data Availability
     using LASSO and optimized for a penalty parameter that was                   The data that support the findings of this study were obtained
     1 standard error above the minimum deviance for additional                   from the Medical Center Information Technology (MCIT) at
     shrinkage. The XGBoost parameters were identified using a                    NYU Langone Health, but restrictions apply to the availability
     hyper-parameter search within the following constraints:                     of these data and, therefore, they are not publicly available due
     nrounds=1000; η=0.3, 0.1, or 0.01; max_depth=2, 3, 4, 5, 6, 7,               to specific institutional requirements.
     or 8; min_child_weight=0 to 1, by 0.1 increments; and γ=0 to
     1, by 0.1 increments. To account for class imbalance,                        Results
     sample-weighted loss was employed when calculating the loss.
                                                                                  More than half of all patients in our data set were over the age
     For models that were trained on the final day of discharge or
                                                                                  of 65 years, with pediatric patients (0-17 years) having the
     death, the performance on predicting outcomes in all preceding
                                                                                  lowest representation (Figure 1A and Multimedia Appendix 2).
     days was evaluated on the entire data set rather than just a 10%
                                                                                  Generally, the proportion of deceased patients increased with
     subset. Data from previous days were not used in the training
                                                                                  age, peaking at 38.5% (422/1097) for those 75 years and over,
     of these endpoint models and, thus, can all serve as validation
                                                                                  15.9% (193/1211) for those 45 to 64 years, and 0% for pediatric
     data.
                                                                                  patients. Most patients who were either ventilated or admitted
     Time Series Modeling                                                         to the ICU belonged to the 65-to-74-years age group, followed
     In each feature setting, all variables were combined and missing             by those 45 to 64 years and 75 years and over.
     values at each time point were imputed with the immediate

     https://www.jmir.org/2021/7/e29514                                                                        J Med Internet Res 2021 | vol. 23 | iss. 7 | e29514 | p. 4
                                                                                                                             (page number not for citation purposes)
XSL• FO
RenderX
JOURNAL OF MEDICAL INTERNET RESEARCH                                                                                                                Wang et al

     Figure 1. Overview of the clinical data set. A. Patient ages were binned by predefined ranges and the ratio of outcomes compared across age groups.
     B. For each patient, hospitalization stay was normalized by length of stay and segmented into 5% windows. Within each window, all values for the
     measured clinical variable were averaged. Each line is colored by the six possible outcomes. ICU: intensive care unit; SpO2: peripheral oxygen saturation.

     Aggregation of values for commonly acquired clinical metrics                  for all three outcome comparisons in the first 5% of
     over normalized time courses offered meaningful insights into                 hospitalization time (Wilcoxon test: P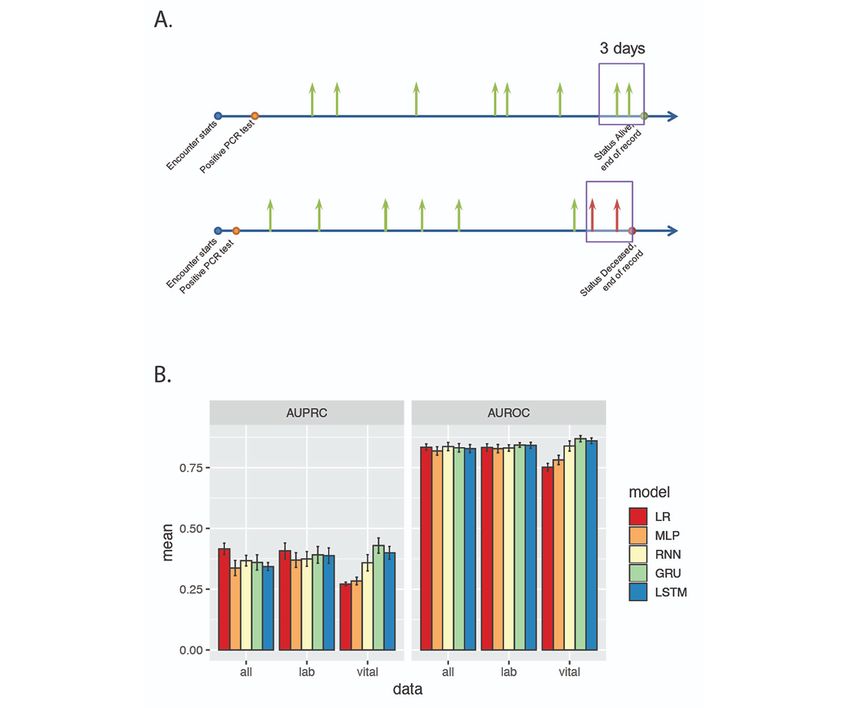
JOURNAL OF MEDICAL INTERNET RESEARCH                                                                                                    Wang et al

     those who would become deceased, followed by those who were           ventilation treatment, (2) the insignificant difference in
     ventilated and ICU admitted. The divergence was present even          distributions, and (3) the desire to keep feature selection
     after accounting for overlapping deceased patients. When              consistent across models, all values recorded within the first 24
     considering the subset of patients who survived, ventilated           hours were included. For each encounter, continuous features
     patients had 2.91 more breaths per minute (Wilcoxon test:             with multiple recordings (ie, SpO2, pulse, respiration rate,
     P
JOURNAL OF MEDICAL INTERNET RESEARCH Wang et al
Figure 2. Predictive performance using clinical data from the first 24 hours. A. Receiver operating characteristic (ROC) curve and precision-recall
curve (PRC) for logistic regression model. B. ROC curve and PRC for XGBoost (eXtreme Gradient Boosting) model. C. Coefficient weights for the
logistic model are recorded on the left. Model performance gains for XGBoost are listed on the right. AUC: area under the curve; AUPRC: area under
the precision-recall curve; Dbp: diastolic blood pressure; ICU: intensive care unit; Resp: respiration rate; Sbp: systolic blood pressure; SpO2: peripheral
oxygen saturation; Temp: temperature.
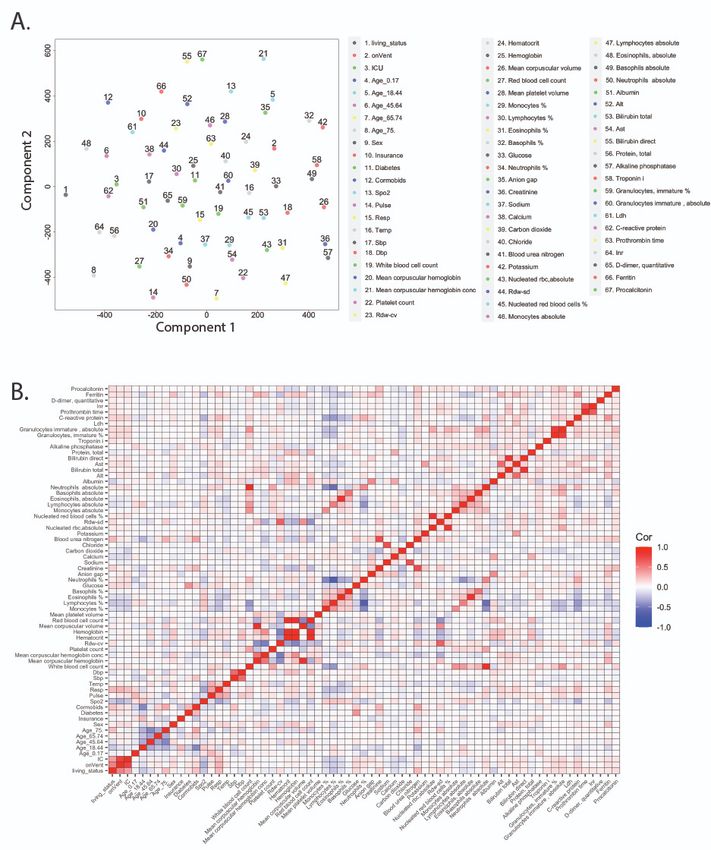
The 50 most frequently collected lab values and their relative (|r|≥0.83) were identified between hemoglobin, hematocrit, and
importance were also studied. A t-distributed stochastic neighbor red blood cell count; absolute neutrophils and white blood cell
embedding plot (Figure 3A) suggests lack of clustering among count; and bilirubin direct and bilirubin total. Each of these sets
lab features and overall low correlation (Figure 3B) in pairwise measures variables that are clinically interdependent and, thus,
comparisons (|μ|=0.08; |σ|=0.10). Local pockets of correlation expected.
https://www.jmir.org/2021/7/e29514 J Med Internet Res 2021 | vol. 23 | iss. 7 | e29514 | p. 7
(page number not for citation purposes)
XSL• FO
RenderXJOURNAL OF MEDICAL INTERNET RESEARCH Wang et al
Figure 3. Overview of lab features collected in the first 24 hours. A. A t-distributed stochastic neighbor embedding plot based on previously collected
clinical features and new lab values. B. Pairwise Pearson correlation heat map. Alt: alanine aminotransferase; Ast: aspartate aminotransferase; Dbp:
diastolic blood pressure; ICU: intensive care unit; Inr: international normalized ratio; Ldh: lactate dehydrogenase; rbc: red blood cell; Resp: respiration
rate; Rdw-cv: red cell distribution width–coefficient of variation; Rdw-sd: red cell distribution width–standard deviation; Resp: respiration rate; Sbp:
systolic blood pressure; SpO2: peripheral oxygen saturation; Temp: temperature.
Incorporating lab features into the predictive models marginally and 65%; and sensitivities of 83%, 73%, and 78%, respectively
improved performance. Logistic regression had AUC (Figure 4B). For logistic regression, blood urea nitrogen (BUN)
performances of 0.83, 0.81, and 0.78; specificities of 68%, 70%, and albumin were among the lab features (Figure 4C) that were
and 69%; and sensitivities of 85%, 83%, and 74%, respectively predictive of mortality. The XGBoost model found the most
(Figure 4A). The XGBoost model performed better, with AUC performance gain from BUN and LDH. Feature importance for
increasing to 0.84, 0.79, and 0.78; specificities of 71%, 72%, predicting ventilation or ICU admission differed between
https://www.jmir.org/2021/7/e29514 J Med Internet Res 2021 | vol. 23 | iss. 7 | e29514 | p. 8
(page number not for citation purposes)
XSL• FO
RenderXJOURNAL OF MEDICAL INTERNET RESEARCH Wang et al
models. For ventilation, logistic regression selected calcium, and carbon dioxide were additionally selected for by logistic
glucose, and CRP with large absolute coefficient values, while regression. Of note, for XGBoost, no lab feature showed a higher
XGBoost identified calcium, glucose, CRP, and LDH as importance measure than did respiration rate and SpO2 for all
important features. For those admitted to ICU, XGBoost three outcomes.
benefited from the same lab features, while monocyte percentage
Figure 4. Predictive performance after incorporating lab features. A. Receiver operating characteristic (ROC) curve and precision-recall curve (PRC)
for logistic regression model. B. ROC curve and PRC for the XGBoost (eXtreme Gradient Boosting) model. C. Coefficient weights for the logistic
model are recorded on the left. Model performance gains for XGBoost are listed on the right. Alt: alanine aminotransferase; Ast: aspartate aminotransferase;
AUC: area under the curve; AUPRC: area under the precision-recall curve; Dbp: diastolic blood pressure; ICU: intensive care unit; Inr: international
normalized ratio; Ldh: lactate dehydrogenase; rbc: red blood cell; Resp: respiration rate; Rdw-cv: red cell distribution width–coefficient of variation;
Rdw-sd: Red cell distribution width–standard deviation; Sbp: systolic blood pressure; SpO2: peripheral oxygen saturation; Temp: temperature.
Finally, models trained on data collected in the last 24 hours 0.92, specificity of 86%, and sensitivity of 85%. The importance
excelled at predicting which patients would become deceased. of respiration rate increased for XGBoost (Figure 5C),
The logistic regression model (Figure 5A) had an AUC accounting for more than 50% of the gain. Values of SpO2 and
performance of 0.91, specificity of 88%, and sensitivity of 84%. being aged 75 years and over were the next most important
The XGBoost model (Figure 5B) had an AUC performance of features.
https://www.jmir.org/2021/7/e29514 J Med Internet Res 2021 | vol. 23 | iss. 7 | e29514 | p. 9
(page number not for citation purposes)
XSL• FO
RenderXJOURNAL OF MEDICAL INTERNET RESEARCH Wang et al
Figure 5. Predictive performance of deceased using clinical data from the final 24 hours. A. Receiver operating characteristic (ROC) curve and
precision-recall curve (PRC) for the logistic regression model. B. ROC curve and PRC for the XGBoost (eXtreme Gradient Boosting) model. C.
Coefficient weights for the logistic model are recorded on the left. Model performance gains for XGBoost are listed on the right. D. Performance of
models to predict deceased outcome was assessed using clinical data from the preceding 30 days. Plots track the area under the curve (AUC), area under
the precision-recall curve (AUPRC), specificity, and sensitivity when using the threshold that maximized the sum of the sensitivity and specificity
(Youden’s J statistic). Dbp: diastolic blood pressure; ICU: intensive care unit; Resp: respiration rate; Sbp: systolic blood pressure; SpO2: peripheral
oxygen saturation; Temp: temperature.
Using the same coefficients and tree weights and structures, able to predict a deceased outcome 4 days in advance
both models were assessed based on clinical data from the (AUC=0.82; specificity=85%; and sensitivity=71%) and 5 days
preceding 30 days (Figure 5D). With cutoffs of 0.80 for AUC, in advance (AUC=0.81; specificity=70%; and sensitivity=75%)
and 70% for specificity and sensitivity, logistic regression was for XGBoost. Models were not trained on those ventilated or
https://www.jmir.org/2021/7/e29514 J Med Internet Res 2021 | vol. 23 | iss. 7 | e29514 | p. 10
(page number not for citation purposes)
XSL• FO
RenderXJOURNAL OF MEDICAL INTERNET RESEARCH Wang et al
ICU admitted, as these events are unlikely to occur in the final records. The single time point models (ie, logistic regression
24 hours preceding discharge and death. Lab values were not and MLP), on the other hand, only used medical data at the
incorporated because few blood tests were ordered in the final current point to make the prediction. Model comparison was
24 hours. carried out with three different feature sets: vital signs only (ie,
body temperature, pulse, respiration rate, systolic blood pressure,
To explore whether patient status can be dynamically predicted
diastolic blood pressure, and SpO2), vital signs and 46 lab results
based on past medical data, we also built time series models
using simple RNN, GRU, and LSTM architectures and with nonzero coefficients in the single time point LASSO
compared the performance metrics to single time point models regression model, and vital signs and lab results plus static
of logistic regression and MLP. A major goal is to explore demographic information (ie, sex, age group, diabetic history,
whether more complex modeling approaches are able to make and comorbidities) (Multimedia Appendix 5). As the time series
accurate and transferrable predictions. The vital status of each data were recorded at uneven and irregular intervals, the
patient was converted to a time series that was marked as progression time (in days) was included in all models as an
positive if the time point was within 3 days of the patient additional feature. For models only including vital sign features,
becoming deceased (Figure 6A). The time series models (ie, time series models showed better performance (Figure 6B)
RNN, GRU, and LSTM) were trained to take medical data from compared to single time point models, but performance was
eight time points as input and infer the vital status at each point, comparable among all models when lab results and demographic
giving rise to a real-time risk prediction based on historical information was added to the feature set.
Figure 6. Time series model performance. A. Time series labels for mortality risk. Medical measurements are obtained at time points across the
admission period with uneven intervals. Green and red arrows represent time points with negative and positive (0/1) labels. B. Mean values of the area
under the precision-recall curve (AUPRC) and area under the receiver operating characteristics curve (AUROC) for five model architectures across
three feature settings. GRU: gated recurrent unit; LR: logistic regression; LSTM: long short-term memory; MLP: multilayer perceptron; PCR: polymerase
chain reaction; RNN: recurrent neural network.
https://www.jmir.org/2021/7/e29514 J Med Internet Res 2021 | vol. 23 | iss. 7 | e29514 | p. 11
(page number not for citation purposes)
XSL• FO
RenderXJOURNAL OF MEDICAL INTERNET RESEARCH Wang et al
observed may be the result of physiological stress triggered by
Discussion the disease. Indeed, prior work has shown that even when
Retrospective analysis of patients who tested positive for controlled for pre-existing diabetes, hyperglycemia was
COVID-19 identified recognizable clinical markers, such as commonly observed in acutely ill hospitalized patients and
respiration rate and SpO2, but also provided insights linked to poorer outcomes [12,13].
distinguishing morbidity (ie, ICU-admitted or ventilated Other lab features also identified routine chemistry data points
outcomes) from mortality (ie, deceased outcome). Our study that shed light on disease pathology. Values of LDH were
confirmed canonical risk factors that were previously established elevated for all three clinical outcomes, a finding consistent
(eg, age, respiration rate, and SpO2) as predictive of mortality with widespread tissue damage that has been shown in numerous
and morbidity, but also uncovered the surprising finding that studies to be a predictor of morbidity and mortality in a wide
temperature was not predictive for mortality. In addition, lab variety of diseases beyond COVID-19 [14-18]. Mortality was
markers of physiological stress, including LDH, BUN, and CRP, also predicted for by BUN. To investigate further the possibility
were found to be important for model prediction, but other of any relationship to acute kidney injury, we retrained our
canonical indicators, such as procalcitonin, were not. models with a BUN to creatinine ratio as an additional feature.
While correlated with mortality (r=0.17), the feature was not
Our results aligned with previous work [10] analyzing patient
selected for by LASSO, and was only of importance when BUN
data from NYU Langone Health to predict absence of adverse
was removed from the training data set. Indeed, recent literature
events within a 96-hour window as opposed to negative
has revealed that BUN is emerging as an independent predictor
outcomes. Several features of importance overlapped both
of mortality in a variety of diseases, including heart failure [19],
studies, notably respiration rate, SpO2, LDH, BUN, and CRP.
aortic dissection [20], and acute pancreatitis [21]. It has also
However, other selected features, such as temperature, platelet been proposed that BUN is an important indicator for metabolic
count, pulse, and eosinophil percentage, were not found to be diseases and general nutritional status of patients, explaining
important in our model. its relative importance in the prediction for mortality. The
Although the goal of stratifying patients by disease severity relationship here is unclear and warrants further investigation.
aligned, the different approaches likely explain the differences Interestingly, calcium level upon admission was a more
in variable explanation. Our study differs in that our models important predictor of morbidity in our models than
were trained only on clinical data from the first 24 hours after procalcitonin was. As a peptide precursor of calcitonin, a
admission, as compared to continuously updating predictions hormone involved in calcium homeostasis, procalcitonin is also
when new lab values were reported. Thus, features that are an acute phase reactant that has been used historically, albeit
important for outcome prediction at the time of admission will controversially, to help diagnose bacterial pneumonia [22-24].
differ from those that do a better job of modeling variations in Although many studies [25-27] have described a positive
disease severity over time. In addition, we stratified our negative relationship between procalcitonin levels and mortality and
outcomes into mortality and morbidity, and separated morbidity morbidity in patients with COVID-19, few have commented
further to compare those requiring ICU admission versus on the importance of calcium as a prognostic value, as we have
ventilation. Eosinophil percentage was statistically different found in our study. Calcium was negatively correlated with all
between all three clinical outcomes, while temperature and pulse three measured clinical outcomes, which is consistent with other
were only different for morbidity and platelet counts were only studies linking hypocalcemia with increased morbidity and
different for mortality (Multimedia Appendix 2). It is mortality in patients with COVID-19 [28-30]. Theoretically,
hypothesized that patients exhibiting symptoms of fever and hypocalcemia could be a result of increased procalcitonin, since
increased pulse rate, likely a consequence of decreased SpO2 procalcitonin is the precursor of calcitonin whose function is
(r=–0.21 and –0.12, respectively), will likely be prioritized for to reduce serum calcium. Interestingly, it has been reported that
ICU care and/or ventilation. Although SpO2 and respiration rate in a systemic inflammatory response, serum calcitonin does not
were consistently selected as predictive features across outcomes increase concordantly in response to increased procalcitonin.
and modeling methods, age groups were informative predictors This situation could indicate that calcium is a predictive factor
of mortality risk only. As expected, the mortality model through an entirely different mechanism than the more
performed better than the morbidity models. These results well-established procalcitonin. One theory is that alteration of
suggest that disease severity and mortality risks may require calcium homeostasis is perhaps used as a strategy by the
unique modeling with different predictor subsets and weighting SARS-CoV-2 virus for survival and replication, since calcium
factors. It is also consistent with the observation that senior is essential for virus structure formation, entry, gene expression,
patients were the most vulnerable population, while the mortality virion maturation, and release. Another possibility is that
rate among the youth was relatively low [11]. patients who present with hypocalcemia have pre-existing
parathyroid hormone (PTH) and vitamin D imbalances that are
In addition, although current evidence suggests that adults with
exacerbated by SARS-CoV-2 infection. Our study could not
type 2 diabetes mellitus are at increased risk for COVID-19
evaluate the importance of PTH or vitamin D due to infrequent
complications, our XGBoost model did not find a past diagnosis
lab orders (0.21% and 0.08% completeness, respectively).
important for predicting morbidity or mortality. Only after
incorporating lab features did we identify a positive correlation While the inclusion of lab features resulted in only modest
between exact glucose values and poorer outcomes. Together, improvement for ventilation and ICU admission prediction, lab
this observation suggests that the elevated blood sugar levels values did result in larger increases in performance metrics for
https://www.jmir.org/2021/7/e29514 J Med Internet Res 2021 | vol. 23 | iss. 7 | e29514 | p. 12
(page number not for citation purposes)
XSL• FO
RenderXJOURNAL OF MEDICAL INTERNET RESEARCH Wang et al
mortality prediction. However, time series modeling failed to are dependent on an accurate recollection on the patient’s part,
improve prediction performance with more clinical features. either through a past hospital encounter or at the time of
This observation is likely due to the fact that laboratory results admission. In addition, it is possible that the comorbidities
were sampled much less frequently than vital sign readings. designation in our data set may have false negatives. Because
Moreover, treating static demographic information as repeating patient histories are often self-reported, it is possible that
time series measurements may be suboptimal for recurrent admitted patients with no prior encounters with the hospital, or
models. As discussed above, laboratory measurements may help either the physical or cognitive inability to verbalize such history
in modeling mortality risk of patients, and future work will at the time of triage, would not have such indication available
focus on efficiently incorporating these static features for in the electronic health record. However, this reflects real-world
dynamic predictions [31,32]. medical situations, in which diagnoses must be made based on
unverifiable patient data or delayed lab results. Finally, as data
A key limitation of our data set revolves around balancing
were retrospectively gathered from Epic during the early stages
inclusion criteria to maximize the number of encounters
of the pandemic, when diagnostic and treatment protocols were
available for model training, while also limiting the amount of
still being developed, a concerted effort to gather novel
missing data. For example, patients who test positive for
biomarker tests that have later been shown to be linked with
COVID-19 and present with less severe symptoms in outpatient
disease severity is not expected. As time draws on and new
or telehealth settings may not have a complete set of vital signs
variants emerge, we also expect that repeated studies will be
or any lab values available. Similarly, past medical histories
needed to survey changes to risk factors.
Acknowledgments
We wish to thank MCIT and the Office of Science and Research at NYU Langone Health for maintaining and deidentifying the
clinical database. JMW is supported by the NYU Medical Scientist Training Program (T32GM136573); he is also supported, in
part, by an NYU Clinical and Translational Science Institute grant (TL1 TR001447) from the National Center for Advancing
Translational Sciences, National Institutes of Health. The content in this paper is solely the responsibility of the authors and does
not necessarily represent the official views of the National Institutes of Health. A portion of this work was also funded by
Renaissance Health Service Corporation and Delta Dental of Michigan.
Authors' Contributions
JMW, WL, and DF contributed to the conception and design of the study; contributed to data acquisition, analysis, and interpretation;
and drafted and critically revised the manuscript. XC contributed to the conception and design of the study, contributed to data
analysis and interpretation, and drafted and critically revised the manuscript. MPM and JTM contributed to the conception and
design of the study, contributed to data interpretation, and critically revised the manuscript.
Conflicts of Interest
MPM has served as a paid consultant for SensoDx, LLC, and has a provisional patent pending. JTM has a provisional patent
pending; in addition, he has an ownership position and an equity interest in both SensoDx, LLC, and OraLiva, Inc, and serves
on their advisory boards.
Multimedia Appendix 1
Flow diagram to illustrate the number of patients at each filtering step and descriptions of the criteria that needed to be fulfilled.
[PDF File (Adobe PDF File), 59 KB-Multimedia Appendix 1]
Multimedia Appendix 2
Demographics, vital signs, lab results, and clinical outcomes of the retrospective cohort.
[DOCX File , 56 KB-Multimedia Appendix 2]
Multimedia Appendix 3
Effect of early ventilation treatment on vital signs. A. Distribution of averaged respiration rates for all values preceding 24 hours
(top) and for all values that precede initiation of ventilation treatment (bottom). B. Distribution of averaged SpO2
(peripheral oxygen saturation) for all values preceding 24 hours (top) and for all values that precede initiation of ventilation
treatment (bottom).
[PDF File (Adobe PDF File), 1021 KB-Multimedia Appendix 3]
Multimedia Appendix 4
XGBoost (eXtreme Gradient Boosting) parameter settings for each trained model.
https://www.jmir.org/2021/7/e29514 J Med Internet Res 2021 | vol. 23 | iss. 7 | e29514 | p. 13
(page number not for citation purposes)
XSL• FO
RenderXJOURNAL OF MEDICAL INTERNET RESEARCH Wang et al
[DOCX File , 17 KB-Multimedia Appendix 4]
Multimedia Appendix 5
Description of features utilized for time series modeling.
[DOCX File , 22 KB-Multimedia Appendix 5]
References
1. COVID Data Tracker. Centers for Disease Control and Prevention. URL: https://covid.cdc.gov/covid-data-tracker [accessed
2020-12-09]
2. Yan L, Zhang H, Goncalves J, Xiao Y, Wang M, Guo Y, et al. An interpretable mortality prediction model for COVID-19
patients. Nat Mach Intell 2020 May 14;2(5):283-288. [doi: 10.1038/s42256-020-0180-7]
3. Yao H, Zhang N, Zhang R, Duan M, Xie T, Pan J, et al. Severity detection for the coronavirus disease 2019 (COVID-19)
patients using a machine learning model based on the blood and urine tests. Front Cell Dev Biol 2020;8:683 [FREE Full
text] [doi: 10.3389/fcell.2020.00683] [Medline: 32850809]
4. Wang D, Hu B, Hu C, Zhu F, Liu X, Zhang J, et al. Clinical characteristics of 138 hospitalized patients with 2019 novel
coronavirus-infected pneumonia in Wuhan, China. JAMA 2020 Mar 17;323(11):1061-1069 [FREE Full text] [doi:
10.1001/jama.2020.1585] [Medline: 32031570]
5. Cheng F, Joshi H, Tandon P, Freeman R, Reich DL, Mazumdar M, et al. Using machine learning to predict ICU transfer
in hospitalized COVID-19 patients. J Clin Med 2020 Jun 01;9(6):1668 [FREE Full text] [doi: 10.3390/jcm9061668]
[Medline: 32492874]
6. McRae M, Dapkins I, Sharif I, Anderman J, Fenyo D, Sinokrot O, et al. Managing COVID-19 with a clinical decision
support tool in a community health network: Algorithm development and validation. J Med Internet Res 2020 Aug
24;22(8):e22033 [FREE Full text] [doi: 10.2196/22033] [Medline: 32750010]
7. Tibshirani R. Regression shrinkage and selection via the lasso. J R Stat Soc Series B Stat Methodol 1996;58(1):267-288
[FREE Full text] [doi: 10.1111/j.2517-6161.1996.tb02080.x]
8. Chen T, Guestrin C. XGBoost: A scalable rree boosting system. In: Proceedings of the 22nd ACM SIGKDD International
Conference on Knowledge Discovery and Data Mining. New York, NY: Association for Computing Machinery; 2016
Presented at: 22nd ACM SIGKDD International Conference on Knowledge Discovery and Data Mining; August 13-17,
2016; San Francisco, CA p. 785-794. [doi: 10.1145/2939672.2939785]
9. Keras Team. Keras. GitHub. 2020. URL: https://github.com/keras-team/keras [accessed 2020-12-09]
10. Razavian N, Major VJ, Sudarshan M, Burk-Rafel J, Stella P, Randhawa H, et al. A validated, real-time prediction model
for favorable outcomes in hospitalized COVID-19 patients. NPJ Digit Med 2020;3:130 [FREE Full text] [doi:
10.1038/s41746-020-00343-x] [Medline: 33083565]
11. Yang W, Kandula S, Huynh M, Greene S, Van Wye G, Li W, et al. Estimating the infection-fatality risk of SARS-CoV-2
in New York City during the spring 2020 pandemic wave: A model-based analysis. Lancet Infect Dis 2021 Feb;21(2):203-212
[FREE Full text] [doi: 10.1016/S1473-3099(20)30769-6] [Medline: 33091374]
12. Corathers SD, Falciglia M. The role of hyperglycemia in acute illness: Supporting evidence and its limitations. Nutrition
2011 Mar;27(3):276-281. [doi: 10.1016/j.nut.2010.07.013] [Medline: 20869205]
13. McCowen KC, Malhotra A, Bistrian BR. Stress-induced hyperglycemia. Crit Care Clin 2001 Jan;17(1):107-124. [doi:
10.1016/s0749-0704(05)70154-8] [Medline: 11219223]
14. Kishaba T, Tamaki H, Shimaoka Y, Fukuyama H, Yamashiro S. Staging of acute exacerbation in patients with idiopathic
pulmonary fibrosis. Lung 2014 Feb;192(1):141-149. [doi: 10.1007/s00408-013-9530-0] [Medline: 24221341]
15. Lam CWK, Chan MHM, Wong CK. Severe acute respiratory syndrome: Clinical and laboratory manifestations. Clin
Biochem Rev 2004 May;25(2):121-132 [FREE Full text] [Medline: 18458712]
16. Chen X, Huang M, Xiao Z, Yang S, Chen X. Lactate dehydrogenase elevations is associated with severity of COVID-19:
A meta-analysis. Crit Care 2020 Jul 24;24(1):459 [FREE Full text] [doi: 10.1186/s13054-020-03161-5] [Medline: 32709251]
17. LitCovid. URL: https://www.ncbi.nlm.nih.gov/research/coronavirus/ [accessed 2020-12-09]
18. Goldberg D, Brown D. Biochemical tests in the diagnosis, classification, and management of patients with malignant
lymphoma and leukemia. Clin Chim Acta 1987 Oct;169(1):1-76. [doi: 10.1016/0009-8981(87)90394-9]
19. Filippatos G, Rossi J, Lloyd-Jones DM, Stough WG, Ouyang J, Shin DD, et al. Prognostic value of blood urea nitrogen in
patients hospitalized with worsening heart failure: Insights from the Acute and Chronic Therapeutic Impact of a Vasopressin
Antagonist in Chronic Heart Failure (ACTIV in CHF) study. J Card Fail 2007 Jun;13(5):360-364. [doi:
10.1016/j.cardfail.2007.02.005] [Medline: 17602982]
20. Liu J, Sun L, Wang J, Ji G. Blood urea nitrogen in the prediction of in-hospital mortality of patients with acute aortic
dissection. Cardiol J 2018;25(3):371-376 [FREE Full text] [doi: 10.5603/CJ.a2017.0075] [Medline: 28653311]
21. Zhou H, Mei X, He X, Lan T, Guo S. Severity stratification and prognostic prediction of patients with acute pancreatitis
at early phase: A retrospective study. Medicine (Baltimore) 2019 Apr;98(16):e15275 [FREE Full text] [doi:
10.1097/MD.0000000000015275] [Medline: 31008971]
https://www.jmir.org/2021/7/e29514 J Med Internet Res 2021 | vol. 23 | iss. 7 | e29514 | p. 14
(page number not for citation purposes)
XSL• FO
RenderXJOURNAL OF MEDICAL INTERNET RESEARCH Wang et al
22. Wussler D, Kozhuharov N, Tavares Oliveira M, Bossa A, Sabti Z, Nowak A, et al. Clinical utility of procalcitonin in the
diagnosis of pneumonia. Clin Chem 2019 Dec;65(12):1532-1542. [doi: 10.1373/clinchem.2019.306787] [Medline: 31615771]
23. Peck Palmer OMG. Procalcitonin's adjunct role in the diagnosis and management of pneumonia. Clin Chem 2019
Dec;65(12):1474-1476. [doi: 10.1373/clinchem.2019.312520] [Medline: 31672860]
24. Self WH, Balk RA, Grijalva CG, Williams DJ, Zhu Y, Anderson EJ, et al. Procalcitonin as a marker of etiology in adults
hospitalized with community-acquired pneumonia. Clin Infect Dis 2017 Jul 15;65(2):183-190 [FREE Full text] [doi:
10.1093/cid/cix317] [Medline: 28407054]
25. Liu Z, Li J, Wang S, Chen D, Zeng W, Chen S, et al. Association of procalcitonin levels with the progression and prognosis
of hospitalized patients with COVID-19. Int J Med Sci 2020;17(16):2468-2476 [FREE Full text] [doi: 10.7150/ijms.48396]
[Medline: 33029089]
26. Hu R, Han C, Pei S, Yin M, Chen X. Procalcitonin levels in COVID-19 patients. Int J Antimicrob Agents 2020
Aug;56(2):106051 [FREE Full text] [doi: 10.1016/j.ijantimicag.2020.106051] [Medline: 32534186]
27. Liu F, Li L, Xu M, Wu J, Luo D, Zhu Y, et al. Prognostic value of interleukin-6, C-reactive protein, and procalcitonin in
patients with COVID-19. J Clin Virol 2020 Jun;127:104370 [FREE Full text] [doi: 10.1016/j.jcv.2020.104370] [Medline:
32344321]
28. Liu J, Han P, Wu J, Gong J, Tian D. Prevalence and predictive value of hypocalcemia in severe COVID-19 patients. J
Infect Public Health 2020 Sep;13(9):1224-1228 [FREE Full text] [doi: 10.1016/j.jiph.2020.05.029] [Medline: 32622796]
29. Sun J, Zhang W, Zou L, Liu Y, Li J, Kan X, et al. Serum calcium as a biomarker of clinical severity and prognosis in
patients with coronavirus disease 2019. Aging (Albany NY) 2020 Jun 25;12(12):11287-11295 [FREE Full text] [doi:
10.18632/aging.103526] [Medline: 32589164]
30. Cappellini F, Brivio R, Casati M, Cavallero A, Contro E, Brambilla P. Low levels of total and ionized calcium in blood of
COVID-19 patients. Clin Chem Lab Med 2020 Aug 27;58(9):e171-e173. [doi: 10.1515/cclm-2020-0611] [Medline:
32459190]
31. Miebs G, Mochol-Grzelak M, Karaszewski A, Bachorz RA. Efficient strategies of static features incorporation into the
recurrent neural network. Neural Process Lett 2020 Jan 31;51(3):2301-2316. [doi: 10.1007/s11063-020-10195-x]
32. Esteban C, Staeck O, Baier S, Yang Y, Tresp V. Predicting clinical events by combining static and dynamic information
using recurrent neural networks. In: Proceedings of the 2016 IEEE International Conference on Healthcare Informatics.
2016 Presented at: 2016 IEEE International Conference on Healthcare Informatics; October 4-7, 2016; Chicago, IL p.
93-101. [doi: 10.1109/ICHI.2016.16]
Abbreviations
AUC: area under the curve
BUN: blood urea nitrogen
CRP: C-reactive protein
GRU: gated recurrent unit
HIPAA: Health Insurance Portability and Accountability Act
ICU: intensive care unit
IRB: Institutional Review Board
LASSO: least absolute shrinkage and selection operator
LDH: lactate dehydrogenase
LSTM: long short-term memory
MCIT: Medical Center Information Technology
MLP: multilayer perceptron
NYU: New York University
PCR: polymerase chain reaction
PTH: parathyroid hormone
RNN: recurrent neural network
SpO2: peripheral oxygen saturation
XGBoost: eXtreme Gradient Boosting
https://www.jmir.org/2021/7/e29514 J Med Internet Res 2021 | vol. 23 | iss. 7 | e29514 | p. 15
(page number not for citation purposes)
XSL• FO
RenderXJOURNAL OF MEDICAL INTERNET RESEARCH Wang et al
Edited by C Basch; submitted 09.04.21; peer-reviewed by E Mahmoudi, X Cheng; comments to author 02.05.21; revised version
received 17.05.21; accepted 26.05.21; published 09.07.21
Please cite as:
Wang JM, Liu W, Chen X, McRae MP, McDevitt JT, Fenyö D
Predictive Modeling of Morbidity and Mortality in Patients Hospitalized With COVID-19 and its Clinical Implications: Algorithm
Development and Interpretation
J Med Internet Res 2021;23(7):e29514
URL: https://www.jmir.org/2021/7/e29514
doi: 10.2196/29514
PMID: 34081611
©Joshua M Wang, Wenke Liu, Xiaoshan Chen, Michael P McRae, John T McDevitt, David Fenyö. Originally published in the
Journal of Medical Internet Research (https://www.jmir.org), 09.07.2021. This is an open-access article distributed under the
terms of the Creative Commons Attribution License (https://creativecommons.org/licenses/by/4.0/), which permits unrestricted
use, distribution, and reproduction in any medium, provided the original work, first published in the Journal of Medical Internet
Research, is properly cited. The complete bibliographic information, a link to the original publication on https://www.jmir.org/,
as well as this copyright and license information must be included.
https://www.jmir.org/2021/7/e29514 J Med Internet Res 2021 | vol. 23 | iss. 7 | e29514 | p. 16
(page number not for citation purposes)
XSL• FO
RenderXYou can also read