Prioritisation of Fish Barriers for Remediation in Christchurch - August 2021 Prepared for: Christchurch City Council
←
→
Page content transcription
If your browser does not render page correctly, please read the page content below
Prioritisation of Fish Barriers
for Remediation in
Christchurch
August 2021

Prepared for:
Christchurch City Council

 Instream Consulting Limited
 PO Box 28 173
 Christchurch 8242
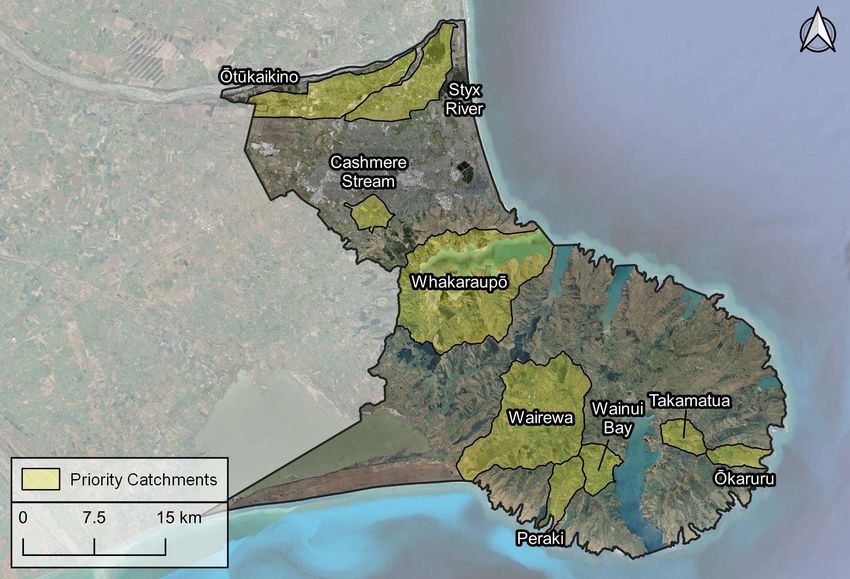
TABLE OF CONTENTS

Executive Summary ...............................................................................................................ii
1.     Introduction .................................................................................................................... 1
     1.1.    Background............................................................................................................. 1
     1.2.    Scope ..................................................................................................................... 1
2.     Methods ......................................................................................................................... 2
     2.1.    Overview ................................................................................................................. 2
     2.2.    Dataset Description and Preparation ...................................................................... 4
     2.3.    Structure Prioritisation ............................................................................................. 5
3.     Results and Discussion ................................................................................................ 10
     3.1.    Structure Priorities ................................................................................................ 10
     3.2.    Other Notable Barriers .......................................................................................... 16
     3.3.    Fish Barrier Remediation Case Studies ................................................................ 19
4.     Conclusions and Recommendations ............................................................................ 30
5.     Acknowledgments ........................................................................................................ 32
6.     References .................................................................................................................. 32

APPENDIX 1:                Summer 2020–21 FPAT assessments .................................................... 34
APPENDIX 2:                Technical GIS routines............................................................................ 36
APPENDIX 3:                All High Priority Structures ...................................................................... 39

 Instream.2021_CCC_Fish_Passage.docx                                                                                            Page i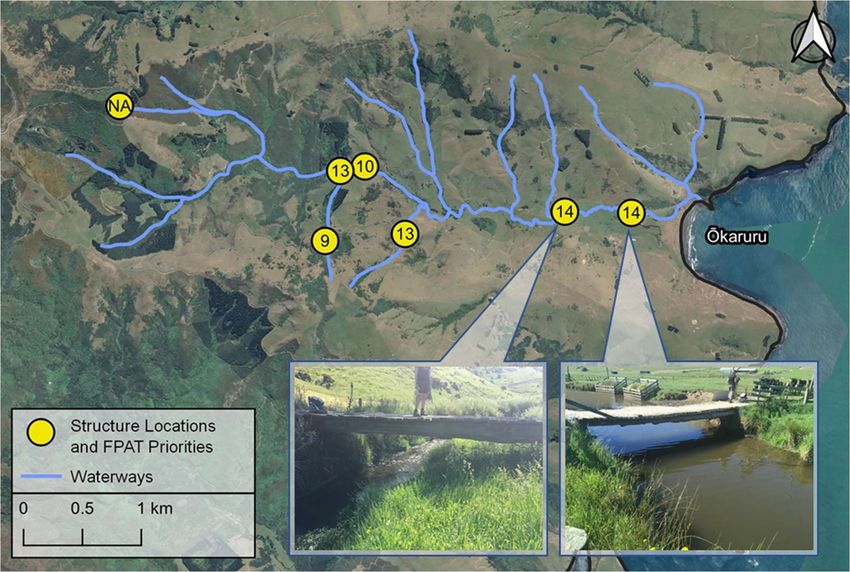
EXECUTIVE SUMMARY
Many of New Zealand’s native fish species are migratory, moving between freshwaters and
the sea to complete their life history. However, through the introduction of artificial instream
structures, many of these migration paths have been disrupted, threatening migratory fish
species. The recently published National Policy Statement for Freshwater Management 2020
requires regional councils to identify and prioritise such structures for remediation. This report
identifies and prioritises instream structures in the Christchurch district for fish passage
enhancement.
A prioritisation model was developed using the Fish Passage Assessment Tool (FPAT) as the
starting point. The FPAT tool provides a nationally-standardised method for assessment of
structures. Assessments are uploaded to a publicly available national database, which
produces a remediation priority based on structure and geographical attributes. The model
used in this report extends on the FPAT database by including the locations of structures in
Christchurch City Council (CCC) asset databases, as well as other ecological data. Our model
then categorised structures as either: a) requiring an FPAT assessment, b) requiring a fish
survey, or, if the requirements of the previous steps are satisfied c) requiring remediation.
Priority values in each category were assigned via a decision tree model, incorporating
elements including: FPAT priorities, catchments considered priorities by CCC and
Environment Canterbury, and fish communities local to the structure. This process was
automated, followed by manual adjustments based on expert opinion.
The model identified 38 structures as high priorities for remediation or fish surveys, of which
20 were CCC assets. Of the CCC assets, culverts were the most common structure type,
accounting for 50% of all high priority structures. Culvert perching was identified as a common
issue on Banks Peninsula, affecting 62% of high priority structures. Weirs, dams, and flow
restrictions were the second most common CCC asset types that were high priorities for
remediation, accounting for a further 29% of structures. These structures are often associated
with stormwater treatment facilities.
The Ōtūkaikino Creek catchment stood out as the priority catchment most heavily impacted
by instream barriers, with some native fish species excluded from up to 35 km of habitat by
artificial structures (particularly weirs). Notable structures that were identified as potentially
having major impacts on fish passage outside of priority catchments include the Mona Vale
weir in the Avon River and the Waikākāriki / Horseshoe Lake pumpstation and tide gates.
Piped networks were also noted as having potentially significant impacts on fish passage,
although they were not represented in the current prioritisation model.
Based on the results of the prioritisation model, and through a review of remediation case
studies, we recommend the following: remediation designs are discussed for the eight CCC
high remediation priority structures; fish surveys are carried out at the 12 CCC high priority
fish survey structures; discussions with other asset owners to address non-CCC high priority
structures; further investigation into high risk structures in non-priority catchments; targeted
fishing and ecological surveys in stormwater treatment facilities; fish remediation projects
should coincide with renewals when possible; follow up fish surveys be carried out after
remediation projects, but only when remediation success is expected to be quantitatively
measured.

 Page ii                                                    Instream.2021_CCC_Fish_Passage.docx
1.     INTRODUCTION

1.1.   Background

Many of New Zealand’s native fish species are migratory, moving between freshwaters and
the sea to complete their life history. However, migration paths may be interrupted through the
construction of artificial structures, often designed to control water levels, mitigate flood risks,
or to allow for infrastructure to pass above waterways. Examples of such structures include
weirs, flap gates, and culverts. It is estimated that 20–40% of existing structures in waterways
impede fish passage, due to impacts of the structures on fall height (e.g., perched culverts),
high water velocities, shallow water depths, or the creation of physical blockages (Franklin et
al. 2018).
Recent development of the Fish Passage Assessment Tool (FPAT; Franklin 2018) has created
an opportunity for asset managers to catalogue and prioritise structures in waterways for
remediation. The free FPAT mobile application allows users to carry out assessments of
structures using nationally-standardised field methods. Collected data are uploaded into a
national database and structures are prioritised for remediation.
Under the National Policy Statement for Freshwater Management 2020 (NPSFM), regional
councils must develop a work program for the remediation of existing instream structures
(Section 3.26.7; Ministry for the Environment 2020). Briefly, this plan must include the
identification of existing structures, evaluation of their risk to fish passage, and prioritisation of
these structures for remediation. Fish passage requirements for the creation of new instream
structures, or the alteration, extension, or reconstruction of existing structures, are stipulated
in the National Environmental Standards for Freshwater (NESF; Parliamentary Counsel Office
2020). Together, these pieces of legislation require the assessment of all new and existing
instream structures for effects on fish passage, as well as the prioritisation of existing
structures for remediation.
Assessment of waterway structures in the Christchurch district is ongoing. Numerous
structures have already been assessed for fish passage with funding from Christchurch City
Council (CCC) and Environment Canterbury (ECan), as well as contributions from private
organisations. Some of these structures have been discussed previously in reports on fish
passage barriers in Christchurch city (Instream Consulting 2020b) and Banks Peninsula
(Instream Consulting 2019b; Instream Consulting 2020a). However, there has not yet been a
district wide review of the assessed barriers to determine remediation priorities. Furthermore,
assessments to date have lacked fish community information, critical to guiding fish passage
enhancement projects.

1.2.   Scope

This report describes a desktop prioritisation of fish barriers for remediation across the
Christchurch district. The prioritisation process combined information from the FPAT
database, CCC asset data, freshwater fish records, priority catchments identified by CCC and
ECan, and expert judgement. Structures identified as high priorities for fish passage
enhancement or further investigation are tabulated and mapped. A range of remediation case
studies are also included, to provide guidance for future remediation projects.

 Instream.2021_CCC_Fish_Passage.docx                                                          Page 1
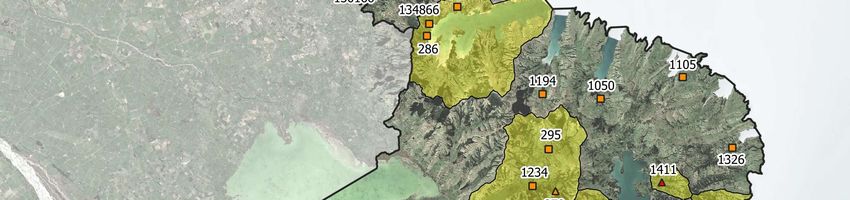
2.      METHODS

2.1.    Overview

The barrier prioritisation model in this report incorporates and builds on ecological criteria
given in the Fish Passage Guidelines (Franklin 2018). Some of these criteria are included
natively in the FPAT model (e.g., proximity to coast and potential habitat gain), and others
were added through an additional prioritisation process (Table 1). This additional process
included incorporating knowledge of local fish communities and giving additional weighting to
structures in priority catchments. Priority catchments were provided by CCC and ECan, and
they typically include catchments with higher biodiversity value and stakeholder interest.
These catchments included: Ōtūkaikino Creek, Styx River, Cashmere Stream, Rāpaki,
Whakaraupō, Wairewa, Peraki Bay, Wainui Bay, Takamātua Stream, and Ōkaruru (Goughs
Bay) (Figure 1). The processes in which these additional criteria were included into the
prioritisation model are described in the sections below.

Figure 1: The priority catchments provided by CCC and Environment Canterbury. Note that the Rāpaki priority
catchment is located within the greater Whakaraupō catchment.

 Page 2                                                           Instream.2021_CCC_Fish_Passage.docx
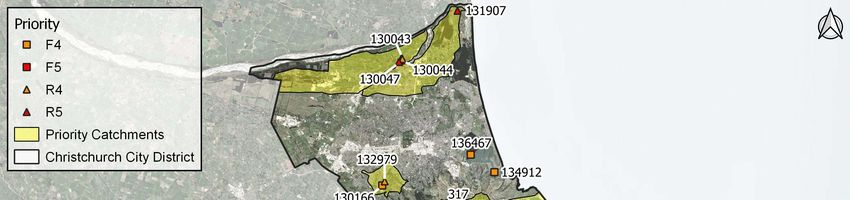
Table 1: Ecological criteria for prioritising structures for fish passage remediation. The Criteria and Explanation columns are from Table 5.1 of the New Zealand Fish Passage
Guidelines (Franklin et al. 2018), which was incorporated by reference in the NPSFM.
Criteria Explanation Inclusion in this Prioritisation
Proximity to coast Barriers that are closer to the coast not only block access to Part of the FPAT prioritisation
a greater proportion of upstream habitat, but they also Expert judgement for sites without FPAT prioritisation
generally block a larger number of fish species.
Potential habitat gain The greater the total length of accessible river upstream of As per above comment.
the barrier, the greater the potential habitat gain.
Habitat quality Restoring access to higher quality instream habitat should Structures were given a higher priority if they fell within
be prioritised over providing access to degraded sites. catchments considered high priorities for protection by
CCC and ECan. These catchments typically have
higher biodiversity value than degraded sites.
Proximity to protected areas Connection with protected area networks may provide added As per above comment.
benefits (e.g. constraints on fishing).
Number of species likely to Some sites are expected to naturally support a greater The FPAT prioritisation gives greater priority to
benefit number of species than others, e.g. sites at low elevation waterways close to the coast.
close to the coast. Sites that are expected to support many Expert judgement also took this into account with
species may be of higher priority than those expected to reference to fish records.
support few species.
Conservation status of Sites expected to support species with a higher conservation Expert judgement with reference to fish records.
species status may be of higher priority for restoration of
connectivity.
Preventing spread of exotic Maintaining boundaries on the spread of exotic and invasive Expert judgement with reference to fish records.
and invasive species species may be a desirable outcome of retaining barriers There are very few examples of locations where this
and should also be considered in prioritising restoration applies in Christchurch.
actions.
Protects threatened species Barriers may protect populations of threatened fish species Expert judgement with reference to fish records.
by preventing access to competing species, e.g. trout. Applies to few locations in Christchurch, as there are
Existence and protection of threatened fish populations few Threatened fish species in the district (lamprey and
should also be considered. Canterbury mudfish are the main threatened species
present).
Instream.2021_CCC_Fish_Passage.docx Page 3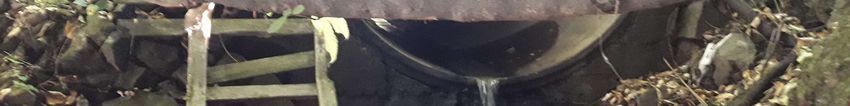
2.2.   Dataset Description and Preparation

The NIWA FPAT database was the foundation of the current study. As of 24 May 2021, the
FPAT database included records of 1,902 potential fish barriers in the Christchurch district.
Included in this total are assessments carried out over the summer of 2020–21 after
preliminary data analysis identified numerous high priority CCC assets lacked assessment. A
summary of these summer assessments is provided in Appendix 1.
The FPAT database contains two types of structure data, which we have termed complete
records and incomplete records. Complete records are those uploaded via the FPAT
application and incomplete records are data collated from external sources. Complete records
include structure information collected following the FPAT standardised protocol, including
relevant water and structure measurements, as well as photographs of the structure.
Incomplete records were added to the FPAT database by NIWA during the period of June–
August 2020. These data include FPAT test data (assessments made during FPAT
development and testing), river-road intersects (where potential barriers may be located, but
have not been ground truthed), historic assessments pre-dating the FPAT protocol, as well as
various structure datasets from Toitū Te Whenua Land Information New Zealand and Waka
Kotahi NZ Transport Authority. Incomplete records varied in the amount of information
provided about a structure, ranging from just the potential location of a structure (e.g., river
road intersects), to some details and notes regarding the structure and its risk to fish passage.
Incomplete data, however, always lacked photographs. By matching field photographs
provided by ECan to historic fish passage assessments pre-dating the FPAT application, we
shifted 139 structures from the incomplete to the complete data category. After carrying out
various GIS routines to identify and filter double ups of structures, the final database contained
1,741 FPAT records, of which 583 (34%) were complete records and 1,158 (66%) were
incomplete records. Each of these record classes was treated independently during the
prioritisation process, described below in Section 2.3. Details of FPAT assessments for
structures discussed in this report can be found by searching for the FPAT ID in the online
FPAT database (https://fishpassage.niwa.co.nz).
In addition to the structure data in the FPAT database, the current study also included CCC
assets. Asset data were collated by selecting relevant layers from CCC’s stormwater and
watercourse asset databases that may represent potential fish passage barriers. Within each
layer, various GIS routines were performed to remove structures that were not potential
barriers within waterways (e.g., structures associated with pipe networks). The included layers
and GIS processes are described in detail in Appendix 2.
The FPAT and CCC asset databases (FPAT and CCC assets) were joined to create a
complete structure database for prioritisation. This database is henceforth referred to as the
“prioritisation database”. FPAT records within 20 m of CCC assets were attributed with the
asset ID and assumed to be the same structure. This method prevented the inclusion of
double-ups between FPAT records and CCC assets, as well as identifying which FPAT
assessed structures were CCC assets. Asset IDs and ownership status was sourced from the
relevant CCC GIS layers, unless alternative ownerships were provided by CCC.
The resulting prioritisation database comprised 2,528 structures (Table 2).

 Page 4                                                     Instream.2021_CCC_Fish_Passage.docx
2.3.    Structure Prioritisation

Prioritisation of the 2,528 structures was a two-step process. First, priorities were automatically
assigned to all structures using a decision tree model, then priority scores were manually
adjusted. Each of these processes is described in detail below.

Table 2: The structure of the prioritisation database.

 Data category                              CCC owned                  Other       Total
 FPAT records
    Complete records                              338                  245          583
    Incomplete records                            321                  837         1,158
 Additional CCC assets                            625                  162          787
                                Total            1,284                 1,244       2,528
Note: All ‘Additional CCC Assets’ are by default incomplete records.

2.3.1. Decision Tree Model

Every structure in the prioritisation database was automatically assigned an alphanumeric
code. The alphabetic character in the code represented an action, while the numeric character
represented a priority. Action categories included: FPAT Assessment (A) of the potential
barrier, a Fish (F) survey (including habitat measurements) in the vicinity of the potential
barrier, and Remediation (R) of the barrier. The alphabetic character represents a level in the
workflow of structure remediation, from identifying the potential risk of a structure (A), to
determining the potential benefit of barrier remediation by sampling the local fish community
(F), and finally by combining the information from the previous two levels, the priority for the
barrier for remediation (R). The numeric priority ranged from 1 (lowest priority) to 5 (highest
priority).
Automatic assignment of the A, F, and R codes followed a decision tree model (Figure 2). The
first decision in the model separated the structures into complete and incomplete records. To
qualify as a complete record, the structure must have had a fish passage assessment and
photographs in the associated database. Thus, CCC asset data was treated as incomplete
data, unless it could be associated with a completed FPAT assessment.
Structures that had not been FPAT assessed (incomplete records) were prioritised for FPAT
assessment based on the structure type, and whether they were situated in a priority
catchment. Structure type was used to infer risk to fish passage, a modified version of the rule-
based risk assessments of Franklin (2018). The highest risk structures were considered to be
pump stations, flap gates, valves, weirs, flow restrictions, and dams, as these structures are
most likely to limit fish passage (Franklin 2018). Culverts, pipes, and fords were treated as
medium risk, as they can be high risk or low risk, depending on their specifications. Bridges
and structures of unknown type were treated as the lowest risk structures, presenting a low or
unknown risk to fish passage. Based on these rule-based risk categories, each group was
assigned a priority number for FPAT assessment, as per Figure 2.

 Instream.2021_CCC_Fish_Passage.docx                                                       Page 5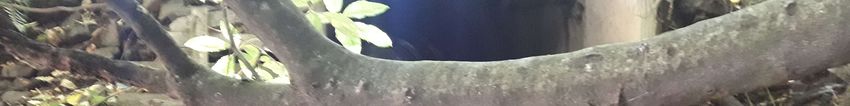
Structures that had complete records were assigned priorities for either a Fish survey (F) or
Remediation (R). The first step in this process was categorising the data by FPAT priority
score (Figure 2). The FPAT priority score is automatically generated by FPAT and it provides
a simple prioritisation of barrier removal or remediation, based on the potential ecological
benefits. This priority score incorporates barrier risk to fish passage, downstream connectivity
(relating to the number and risk of downstream barriers), catchment position (the proportion
of catchment above the barrier), and accessible upstream habitat (the proportion of catchment
before the next upstream barrier) (Franklin 2018). As these calculations rely on NIWA’s River
Environment Classification (REC) model (Snelder et al. 2004), structures not located on REC
river lines are not assigned an FPAT priority score. For these 92 non-prioritised structures, a
priority was assigned using expert judgement, with the corresponding priority categories ‘Low’,
‘Medium’, or ‘High’ (Figure 2). These priorities were subjectively estimated by considering the
attributes included in the FPAT model, and through experience with the FPAT prioritisation
system. Structures were then passed through the priority catchment filter, which simply
adjusted the remediation priority based on whether the structure is in one of the priority
catchments.
The remaining filters focused on fish communities local to the structure, which attempt to
determine if the structure fulfils various ecological criteria for barrier prioritisation, outlined in
Table 1. The first step in this process was separating the structures into those with fish data
in the vicinity and those without fish data. For this purpose, the New Zealand Freshwater Fish
Database was used (NZFFD; Richardson 2005). Structures with recent (< 20 years) fishing
records in their vicinity were assigned a Remediation (R) priority, while structures without
fishing data were assigned a Fish (F) survey priority. Whether local fishing data was suitably
appropriate was determined manually on a case-by-case basis, and included consideration of
elevation changes, number of records, and other potential barriers in the area.
The final filter imposed on structures with relevant fishing data available, was whether there
were inanga (Galaxias maculatus) records near the structure. This ‘At Risk – Declining’
species (Dunn et al. 2018), was chosen as an indicator species as it is migratory and a very
poor climber (Jowett and Richardson 2003). The presence of this species near a structure
therefore indicates that passage up to the structure is relatively unobstructed for most species,
increasing the number of species that are likely to benefit from structure remediation.
Furthermore, having a species that is highly sensitive to passage obstruction in the vicinity
greatly increases the chance of a structure being a barrier. Thus, such structures were
assigned the highest priorities for remediation.

 Page 6                                                        Instream.2021_CCC_Fish_Passage.docx
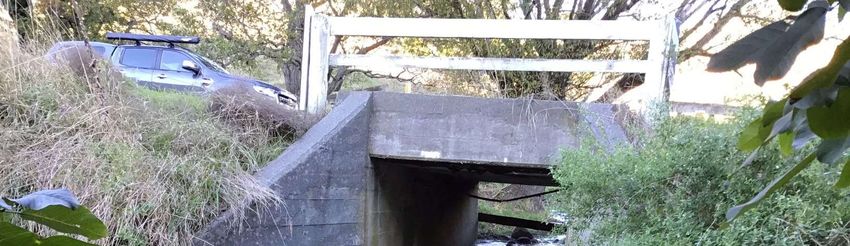
Figure 2: The decision tree model used to assign actions and priorities to structures in the prioritisation database. Y=yes, N=no.

 Instream.2021_CCC_Fish_Passage.docx                                                                      Page 7
2.3.2. Manual Adjustment

Following the automatic prioritisation model, a manual adjustment process was carried out for
every complete record. Automatic values assigned to complete records were checked and
adjusted on a structure-by-structure basis. Adjustments were then made to the priorities if it
was decided that the value was not representative of the potential ecological benefits of
remediating a structure. A summary of the reasons why a structures priority may have been
manually altered, and the number of affected structures, is presented in Table 3.

Table 3: Reasons for adjusting structure priority scores.

 Code               Explanation                                                  Structures Affected
 LR                 Low Risk: Priority reduced as the structure
                                                                                            252
                    presents a very low risk to fish passage.
 DR                 Dry: Priority reduced due to upstream channel
                                                                                            61
                    being dry.
 LF                 Low Flow: Priority reduced due to low flow
                                                                                            55
                    providing limited habitat availability upstream.
 HR                 High Risk: Priority increased due to structure
                                                                                            24
                    creating a very high risk to fish passage.
 UPL                Upstream Potential Low: Priority reduced due a
                    small amount of habitat availability upstream. This
                                                                                            18
                    may be due to other barriers upstream, or pipe
                    networks.
 NAT                Natural barrier: Priority reduced to minimum as no
                                                                                            15
                    remediation is required.
 DB                 Downstream Barriers: Priority reduced due to
                                                                                             8
                    barriers downstream requiring attention first.
 UPH                Upstream Potential High: Priority increased due to
                                                                                             8
                    having a large, unobstructed catchment upstream.
 MIR                More Information Required: Priority or action
                    changed until more information is available on                           6
                    structure or surrounding structures.
 UPS                Unassessed Structures reducing Priority: Priority
                    increased. Nearby structures that are unassessed
                                                                                             3
                    and are unlikely to be a risk to fish passage (e.g., a
                    bridge), are reducing the structures FPAT priority.

                                     Total Complete Records Adjusted:                       387
                                 Total Complete Records Unadjusted:                         196
Note: Structures may be adjusted for more than one reason, and these structures have more than one code.

 Page 8                                                            Instream.2021_CCC_Fish_Passage.docx
By far the most common reason for adjusting a priority score was due to the structure presenting a low risk to fish passage yet having a high FPAT priority score, which accounted for 65% of adjustments. This was a common adjustment due to the way in which the FPAT model calculates its priority scores. The FPAT priority score is the sum of four scores, with each of these scores representing a different attribute of the structure or its position in the catchment. Franklin (2018) terms the four scores the ‘downstream connectivity score’, ‘catchment position score’, ‘accessible upstream habitat score’, and the ‘barrier score’. Briefly, these scores are affected, respectively, by a) the number of barriers downstream, b) the relative proportion of catchment upstream of the barrier (irrespective of upstream barriers), and c) the length of upstream habitat, and d) the degree of risk to fish passage the barrier poses. Every structure is scored on a scale of 1–5 for each of these attributes, with the sum of these attributes being the final FPAT priority score (i.e., 5–20). Structures that have a low barrier score (i.e., very low risk to fish passage), may still have a priority of up to 16 (out of a maximum of 20) if they receive maximum scores for the other three attributes. For example, two bridges in Ōkaruru (Goughs Bay) were determined to be very low risk to fish passage, however, due to their catchment position, both received relatively high FPAT priorities of 14 (Figure 3). As Ōkaruru is a priority catchment and there are NZFFD records of inanga in the area, the current automatic model produces priorities of R5 for both structures, the maximum score for remediation (Figure 2). The manual adjustment process allowed for these structures to be reduced to R1 priority, on the basis that the structures present a ‘Low Risk’ to fish passage. Figure 3: Two structures that required manual priority adjustments due to having high FPAT priority scores, despite presenting no risk to fish passage. Instream.2021_CCC_Fish_Passage.docx Page 9
3.                     RESULTS AND DISCUSSION

3.1.                   Structure Priorities

The distribution of the assigned priorities for remediation and fishing was heavily skewed
towards the lower priority categories (Figure 4). Only 38 (6.5%) of FPAT assessed structures
were high priority (i.e., had priority scores of 4 or 5). Eight CCC assets were among the high
priority structures for remediation (i.e., R4 or R5), with a further 12 identified as high priority
for fish surveys (i.e., F4 or F5). All CCC assets in the high priority categories for remediation
and fishing are described in Table 4. A complete list of high priority structures of all ownerships,
including their coordinates, is included in Appendix 3.

                               250
                                                                                                 210

                               200                                                               12
        Number of Structures

                                                                                                 41
                                                                                                                         145
                               150           128                                                                6
                                                                                            48                                   9
                                     4                   4                                                                13
                                                                           100
                                                 27                                                            27
                               100                                 3
                                     14                                     20
                                                                                       13
                                50                                                               109
                                             79                                                                           90
                                                                            64

                                 0
                                            CCC                            Other                 CCC                     Other

                                                      Remediation (R)                                  Fish Survey (F)

                                     Priority:         Priority:       1           2        3    4        5

Figure 4: The number of structures in each of the prioritisation categories, with ‘1’ being lowest and ‘5’ being
highest priority. Data are separated by asset owner, where ‘other’ includes unknown ownership.

A total of 1,945 structures in the database had not yet been FPAT assessed (Figure 5). Of the
244 high priority assessment structures (i.e., A4 or A5), 64 (26%) were identified as CCC
assets. Of the 64 high priority CCC assets for assessment, 40 were visited during the summer
2020–21 assessment project, but were unable to be assessed for a variety of reasons, which
are described in Appendix 1. A further 14 represent culverts in priority catchments that were
added after the summer assessments were carried out.1 Of the 180 high priority assessment
structures for assessment that were not identified as CCC assets, a large proportion were
weirs, dams, or flow restrictions (61%), with the remainder being flap gates or culverts (the

1 Wainui Bay, Ōkaruru / Goughs Bay, and Pireka Bay were added to the list of priority catchments after the 2020/21
field assessments were completed.

    Page 10                                                                                       Instream.2021_CCC_Fish_Passage.docx
latter in priority catchments). The weirs ranged from single boards in the bed of the waterway
to more substantial structures such as v-notch weirs and plate weirs.
1250
999
1000 946
36
7
Number of Structures
57 144
750 172
590
172
500
250 58 475
234
0
CCC Other
FPAT Assessment (A)
Priority: 1 2 3 4 5
Figure 5: The number of structures assigned a priority for FPAT assessment (i.e., incomplete records), with ‘1’
being lowest priority and ‘5’ being highest. Data are separated by asset owner, where ‘other’ includes unknown
ownership.
.
Instream.2021_CCC_Fish_Passage.docx Page 11Table 4: All high priority (R5, R4, F5, and F4) structures owned by CCC. The location of each structure is indicated below in Figure 6. Structures are ordered firstly by action
(i.e., Remediation or Fishing) and secondly by priority score. Structures with the same priority score have been ordered from highest priority to lowest priority, based on expert
ecology judgement and local knowledge. The CCC Asset refers to the relevant GIS layer and asset number of each structure.
Waterway (Catchment) FPAT ID Structure CCC Priority Comments Photographs
Type Asset Score
Ōtūkaikino Creek 130047 Weir WcWeirs R5 The most substantial barrier in the Ōtūkaikino
(Ōtūkaikino Creek) 199 catchment. Distribution of fish database records
indicates that the structure is a total barrier for
inanga. Velocities over fish ladder are too high for
inanga.
Takamātua Stream 1411 Weir Unknown R5 Upstream of CCC bridge A33. A fish survey in 2020
Branch No 7 (Takamātua identified abundant native fish downstream, including
Stream) bluegill bully, redfin bully, longfin eel, and whitebait.
No fish were caught upstream, confirming poor
passage.
Pūharakekenui / Styx 131907 Flap gate WcValve R5 High risk structure near the coast. The most
River with culvert 27 significant barrier in the Styx catchment.
(Pūharakekenui / Styx Recommend an investigation into the gate’s
River) operation (opening frequency and duration) and
impacts on fish movements and salinity (and
associated implications for plant communities and
inanga spawning).
Wainui Valley Stream 1140 Weir WcWeirs R5 ECan currently investigating fish passage
(Wainui Bay) 242 enhancement options.
Storer Diversion 130043 Culvert SwPipe R4 There is another significant structure upstream (see
(Ōtūkaikino Creek) 46740 next structure below). These would both need to be
remediated to gain the full benefit. Structure would
exclude most native species. Asset ownership is
uncertain.
Fisher Drain 130044 Pump WcWeirs R4 Historical pump station (not in service) containing a
(Ōtūkaikino Creek) station 200 substantial weir barrier. Gravity fed bypass ends in
flap gates. Substantial culvert barrier downstream,
these would both need to be remediated to gain the
full benefit.
Okuti River Branch No 9 278 Weir RAMM R4 Weir situated under bridge W11, but not listed in
(Lake Forsyth (Wairewa)) W11 CCC weir database. Likely owned by CCC. Would
need to remediate at the same time as another
(presumably private) weir immediately upstream.
Dunbar Waterway 132979 Culvert SwPipe R4 Structure may be scheduled for replacement with
(Cashmere Stream) 45899 proposed waterway realignments in the area. This
needs to be confirmed by CCC engineers prior to
remediation.
Totara Stream 1050 Culvert SwPipe F4 Large upstream catchment. The waterway this
(Pigeon Bay Stream) 60168 tributary flows into contains records of numerous
native fish, including bluegill bullies and longfin eels.
Opuahou Stream Branch 295 Culvert SwPipe F4 Structure c. 500 m upstream should be assessed at
No 14 58366 the same time as fishing this structure to determine
(Lake Forsyth (Wairewa)) the amount of potential upstream habitat.
Le Bons Stream Branch 1326 Culvert SwPipe F4 No fishing records present in this waterway, but
No 13 61976 numerous native species (including lamprey)
(Le Bons Stream) recorded in the Le Bons Bay mainstem.
Owhetoro Stream Branch 1194 Culvert SwPipe F4 Stream has good flow. Fish community is unsampled
No 4 59843 in both Branch No 4 and the mainstem.
(Port Levy (Potiriwi) /
Koukourarata)
Kinloch Stream 1234 Culvert RAMM F4 High risk private ford with culvert located c. 200 m
(Lake Forsyth (Wairewa)) W17 upstream. Fishing required upstream of both
structures, with a remediation plan for both structures.
Page 12 Instream.2021_CCC_Fish_Passage.docxWaterway (Catchment) FPAT ID Structure CCC Priority Comments Photographs
Type Asset Score
Rifle Range Waterway 134912 Flap gate SwValve F4 As per the CCC GIS layer, the normal position of the
(Estuary of the Heathcote with culvert 306 flap gate is closed. Likely a substantial barrier to fish
and Avon Rivers / Ihutai) migrating upstream, however, the fish community
has not been sampled.
Raupō Stream 1105 Culvert SwPipe F4 Substantial barrier and is the only known barrier in
(Raupō Bay) 60656 the catchment. Fish community has not been
sampled.
Stream Reserve Drain 134866 Culvert SwPipe F4 Fish passage improvements through the culvert, but
(Lyttelton Harbour / 76048 surveyors noted a large drop off the apron. Fish
Whakaraupō) community sampled downstream, which includes
eels, kōaro, and banded kokopu, but no fish
sampling upstream.
Charlesworth Drain 136467 Flap gate SwValve F4 Potential inanga spawning habitat upstream with low
(Estuary of the Heathcote with culvert 501 gradient banks and dense groundcover vegetation.
and Avon Rivers / Ihutai)
Miln Drain 130166 Other SwPipe F4 Fishing required to determine if this structure is a
(Cashmere Stream) 87535 substantial barrier. Investigation into other structures
built as part of the new stormwater infrastructure and
waterway realignments is recommended.
Cass Bay Drain 317 Weir SwPipe F4 Recommend further fish investigation. A recent
(Lyttelton Harbour / 57165 survey found no fish upstream, however, this
Whakaraupō) coincided with a very dry summer and reduced
aquatic habitat.
Church Lane Drain 286 Culvert SwPipe F4 Historic records of banded kokopu, but no recent
(Lyttelton Harbour / 76008 records. Downstream there is another perched
Whakaraupō) culvert of unknown ownership that would need to be
addressed at the same time. Local residents report
that the stream goes dry at times.
Figure 6: All CCC owned assets that are a high priority for fish surveys (F4, F5) or remediation (R4, R5). Structures labelled with their FPAT record ID.
Instream.2021_CCC_Fish_Passage.docx Page 13Culverts were the most common CCC asset to be assigned a high priority in the remediation
and fishing categories, accounting for 10 out of 20 (50%) structures in these categories (Table
5). Weirs, dams, and flow restrictions also appeared in these categories, representing a further
6 (29%) of high priority structures. While this appears to go against the assumption that weirs,
dams, and flow restrictions are of higher risk to fish passage relative to culverts, this is likely
an artifact of the number of structures in each of these categories. A total of 47 CCC owned
weirs, dams or flow restrictions were included in the database, of which 39 have been FPAT
assessed. For comparison, there were 820 CCC owned culverts included in the database, of
which 195 have been assessed. Therefore, weirs, dams, and flow restrictions contribute a
disproportionately high number of structures to the high priority categories, relative to other
structure types. Weirs and flow restrictions are often associated with stormwater treatment
and attenuation systems. Thus, these systems create high-risk environments for fish passage.
However, as structures in such systems are often bespoke, determining their impacts on fish
passage is difficult. Targeted surveys are therefore required to identify to what level fish are
utilising stormwater treatment facilities, to identify potential fish passage issues, and to
determine if providing passage into such facilities is appropriate.
Table 5: The number of structures per priority category, separated by structure type, for CCC owned assets.
Weir, Dam Ford Ford
or Flow Gate or with without
Priority Culvert Bridge Restriction Valve Pump Other Culvert Culvert Total
Remediation
R5 3 1 4
R4 2 1 1 4
R3 9 7 8 1 1 1 27
R2 10 2 2 14
R1 33 30 8 6 1 1 79
Fishing
F5 0
F4 8 2 2 1 13
F3 29 3 7 2 41
F2 40 2 6 48
F1 64 30 9 3 1 1 1 109
FPAT Assessment
A5 1 1 5 7
A4 35 1 7 11 3 57
A3 590 590
A2 58 58
A1 234 234
Total: 820 357 47 41 13 3 3 1 1,285
The distribution of high priority structures was not even over the Christchurch district. High
priority structures were far more numerous on Banks Peninsula than they were in Christchurch
city, with 29 of the 38 (76%) high priority structures identified being located on the peninsula
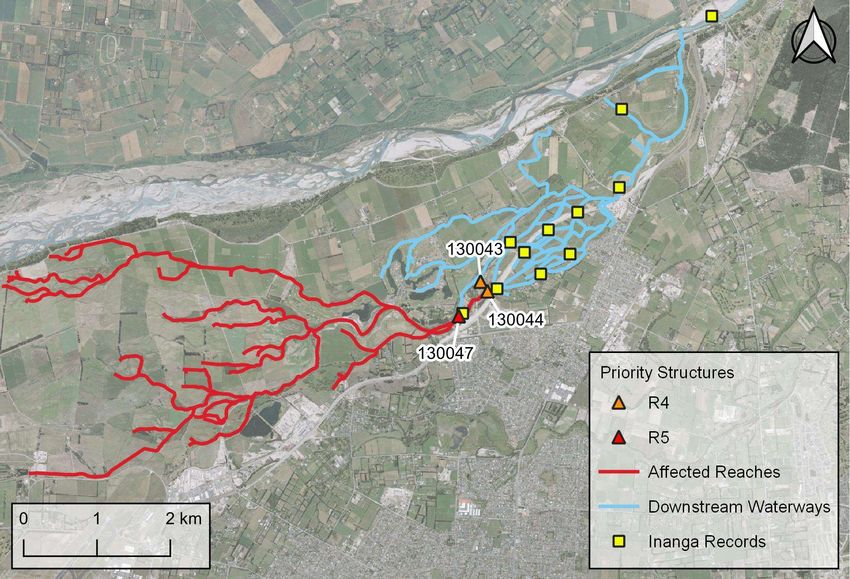
Page 14 Instream.2021_CCC_Fish_Passage.docx(Appendix 3). This pattern remained when this list was reduced to CCC owned assets, with 13 of the 20 (65%) high priority structures being located on the peninsula (Figure 6). A combination of factors may contribute to the high number of priority structures on the peninsula. These factors include the presence of large priority catchments (i.e., Whakaraupō and Wairewa), as well as the local topography and geology. The steep topography and highly erodible loess soils on the peninsula create an environment where culverts may become perched over time, due to erosion. Furthermore, culverts have typically been installed on a gradient closer to that of the road than the surrounding hillslope. The result of this is a perched culvert on the downhill side of the road. Culvert perching was associated with 13 of the 19 (68%) high priority structures on the peninsula, compared with three of the nine structures (33%) in the city. Within the city there was a more even spread of CCC owned high priority structure types. These included three culverts, three gates or valves, a historic pump station, and a weir. While these structures were spread among various catchments, the Ōtūkaikino catchment stood out as being highly impacted by fish barriers, containing three of the six high priority remediation structures. These structures were all identified as having a ‘Very High’ risk to fish passage by the FPAT application. These barriers may reduce access or exclude migratory fish from up to 35 km of upstream waterway (measured from the CCC waterways layer; Figure 7). This estimate assumes there are no further upstream barriers and does not make any assumptions around suitable fish habitat, or intermittently dry reaches. The impact on inanga distributions within the catchment can be clearly demonstrated by mapping recent NZFFD records for this species (Figure 7). Figure 7: The locations of the three high remediation priority CCC structures in the Ōtūkaikino catchment, labelled with FPAT IDs. Inanga NZFFD records in the catchment (since 2000) are also included. The catchment upstream of the barriers is symbolised as ‘Affected Reaches’ in red, totalling 35 km. Instream.2021_CCC_Fish_Passage.docx Page 15
Inanga records in the Ōtūkaikino are limited exclusively to reaches downstream of the
identified structures. Other potentially affected migratory species in the catchment, some of
which are of conservation interest, includes: ‘Threatened – Nationally Vulnerable’ lamprey
(Geotria australis; Dunn et al. 2018); ‘At Risk – Declining’ bluegill bully (Gobiomorphus hubbsi)
and longfin eel (Anguilla dieffenbachii); ‘At Risk – Naturally Uncommon’ giant bully
(Gobiomorphus gobioides); as well as shortfin eel (Anguilla australis). Due to the substantial
ecological values identified, and the considerable upstream habitat that can made accessible
through remediation, these structures represent some of the highest priority structures in the
Christchurch district.

3.2.    Other Notable Barriers

The current design of the prioritisation model places a strong weighting on priority catchments,
with structures outside these catchments receiving a maximum remediation priority of ‘R3’
(Figure 2). While this approach achieves its purpose, prioritising structures in catchments of
high ecological and stakeholder interest, it does exclude significant barriers in non-priority
catchments. One way of identifying such barriers is to organise the structures by the FPAT
“risk to fish passage” category. This is a qualitative measure of risk made by the assessor
during FPAT assessments. The risk category is selected following advice provide in the FPAT
user guide (Franklin 2018), as summarised in Table 6. Risk to fish passage also has a
quantitative counterpart that is calculated by the FPAT application. However, the quantitative
risk assessment does not assess risk in the context of the local fish community and the
gradient of the stream, and has a tendency for ‘Very High’ risk to be calculated when there is
little or no water. Therefore, the qualitative assessment made by the assessor reduces the
number of false positives when discussing the high-risk categories.

Table 6: Qualitative FPAT risk assessment categories that guide the FPAT assessors. From Franklin (2018).

 Risk Category           Description
 Very high               Very high chance that most fish species will be blocked most or all the time.
 High                    High chance that the movements of many fish species and life stages will be
                         restricted for much of the time.
 Moderate                Moderate chance that movements of some fish species and life stages are
                         commonly restricted.
 Low                     Some chance that movements of weaker swimming species are restricted
                         some of the time.
 Very low                Movements are unimpeded for most or all fish species and life stages for most
                         or all the time.
 Not assessed            Select this if you are not confident or do not have the knowledge to determine
                         the likely risk.

The division of high-risk structures (the combination of ‘High’ and ‘Very High’ risk categories)
was relatively even between priority and non-priority catchments, with a total of 63 high risk
structures in priority catchments and 80 in non-priority catchments (Figure 8). This indicates
that there are 80 structures that are very likely to be impeding fish passage, that have been
limited to a maximum ‘R3’ prioritisation in the current study. One notable example from this

 Page 16                                                           Instream.2021_CCC_Fish_Passage.docx
category is the Mona Vale weir in the Avon River, which was identified as a ‘Very High risk’ to fish passage by the assessor (FPAT ID: 1630). This weir has been previously identified as a major fish barrier, restricting fish distributions in the Avon River (Instream Consulting 2019a). It is the most downstream barrier in the Avon River mainstem, with a sizeable upstream catchment including 34 km of open waterway (based on the CCC watercourse GIS layer, without considering other barriers). This structure is discussed in further detail as a remediation case study in Section 3.3.2. Figure 8: The number of structures per risk level in priority and non-priority catchments, separated by ownership status. ‘Other’ includes structures of unknown ownership. Risk level assessed qualitatively by FPAT assessors. Structures without risk assessments (3) excluded. Pump stations and flap gates can also pose considerable risk to fish passage, however, most of these structures in the prioritisation database (48 out of 70; 69%) occurred outside of priority catchments. Examples of these structures include the pumpstation and associated tide gates at the Waikākāriki / Horseshoe Lake outlet (PS205; FPAT ID: 136500). The ecological values of the upstream catchment and the potential effects of this structure were discussed in a report prepared by Instream Consulting (2021) for CCC. Ecological values of the catchment included a diverse migratory fish community, including: ‘At Risk – Declining’ inanga, longfin eel, and bluegill bully; ‘At Risk – Naturally Uncommon’ giant bully; as well as shortfin eel and common bully (Gobiomorphus cotidianus). Upstream movements of juveniles of these species are likely impeded by the tide gates, which close on an incoming tide, coinciding with peak upstream fish movement. While one of the five gates is a “fish-friendly” design, CCC engineers observed negligible difference in opening duration between the standard and fish-friendly gates (Instream Consulting 2021b). Downstream migration of adult eels is also likely affected by this structure, with fish entrained into the pump screws potentially suffering injury or mortality. Instream.2021_CCC_Fish_Passage.docx Page 17
While the structure was assigned a remediation priority in the current study, further
investigation into the periodicity of the gate openings and closings, and the impact of the
pumpstation on downstream fish movements is recommended to inform remediation design.
The risk of pumpstations on fish passage is context dependent. While the above example
describes a pumpstation that is likely to have a high impact on fish passage, this is not true of
all pumpstations. A key consideration when determining the potential impact of a pumpstation,
and thus its priority for remediation, is the amount of pipe network both upstream and
downstream of the structure. The relative amount of pipe network to open waterway upstream
should be considered as it reflects the amount of potential fish habitat upstream. Pumpstations
downstream of catchments with a large proportion of open waterway should be considered a
priority for further investigation, as these pumps are likely to have a greater number of fish
migrating past them in a downstream direction. Pumps with large amounts of inline pipe
downstream can be considered to have a lower risk to fish passage. This is due to long lengths
of pipe creating partial barriers to fish passage, reducing the number of fish upstream, and
thus the risk of the pump to fish passage. Examples of these exist in the Dudley Creek
Diversion (SwPump 40 and SwPump 6). In a survey of the open reaches upstream of these
pumps (immediately downstream of Paparoa Street), Brown et al. (2021) caught only non-
migratory upland bullies, with one eel seen but not caught. Low fish diversity and eel
abundance was attributed to the long continuous lengths of downstream pipe acting as a
partial barrier. Given the low abundance of migratory fish upstream, the inline pumps in Dudley
Creek diversion pose lower risk to fish passage and are not a high priority for remediation.
While the Dudley Creek Diversion example demonstrates that pipe networks can present
substantial risk to upstream fish passage, these networks are not represented in the current
study, or explicitly considered by the FPAT application. We intentionally excluded pipe
systems via GIS routines, described in Appendix 2. Pipe networks were not included to reduce
noise in the dataset, with a focus on improving passage to open waterways. However, the
process of “daylighting”, restoring piped networks to natural open states, is becoming
increasingly common both overseas and in New Zealand. Daylighting may provide direct
benefits, through the creation of more open water habitat, and indirect benefits, by allowing
greater access to open upstream reaches. When compared to individual barrier remediation,
daylighting is very costly, with the relative ecological merit depending largely on factors relating
to the amount of open upstream habitat, the length of downstream piped sections, the species
present in downstream reaches, and a range of social factors. A prioritisation process involving
these principals could be used to determine which piped reaches are the strongest candidates
for daylighting locally. However, we suggest that CCC focuses on remediating other fish
passage barriers before daylighting parts of the pipe network, due to the lower associated
costs and clearer benefits of barrier remediation.

 Page 18                                                     Instream.2021_CCC_Fish_Passage.docx
3.3.    Fish Barrier Remediation Case Studies

3.3.1. Antigua Boat Sheds Weir

Waterway: Avon River
Location: Antigua Boatsheds
FPAT ID: 136460
CCC Asset ID: WcWeirs 151
Fish passage issue: The older rock weir created a vertical drop in the order of 0.5 m and fast
velocities that would have reduced fish passage for poor climbers (Figure 9). The weir was
unstable, with rocks rolling away from the weir causing upstream water levels to drop. Weir
removal was impractical, due to the historical significance of the upstream reach for boating.
Potential upstream habitat: Up to 48 km, excluding pipes. Potential habitat calculated from
CCC watercourse and stormwater GIS layers. The distance is likely an overestimate, as this
assumes that all reaches are habitable by fish and have permanent flow. Access to much of
the upstream habitat is limited by the Mona Vale Weir, located 5.3 km upstream.
Fish community: There are NZFFD records of numerous migratory species in the vicinity,
some of which are of conservation interest. This includes Threatened lamprey and At Risk
inanga, bluegill bully, and longfin eel (Dunn et al. 2018). Additionally, shortfin eel, common
bully, and brown trout (Salmo trutta) have also been recorded.
Solution: Proposed solutions included upgrading the current weir by adding more rocks, a
formal concrete weir, and a rock riffle, with the latter ultimately being selected (Figure 9).
Construction of the rock riffle was completed in 2008.

Figure 9: The unstable rock weir (left) and the replacement rock riffle weir (right).

Costs: Total renewal cost of $216,000. As there was no additional structure added to provide
fish passage, and renewal of the weir was to occur anyway, there were no additional costs for
fish passage enhancements beyond the design and construction costs for the weir.
Remediation effectiveness: Remediation of the structure was highly successful. The riffle
section was a suitable length as to not create a significant velocity barrier. From a fish passage

 Instream.2021_CCC_Fish_Passage.docx                                                     Page 19
perspective, the selected riffle design was far superior to the alternative design suggestions
and did not require any additional structures for fish passage. Many migratory species,
including inanga, have been recorded upstream of the structure since the riffle was installed.
Additionally, NZFFD records show bluegill bullies (riffle habitat specialists) are abundant
through the riffle section.
Lessons learnt:
The structure was due for renewal, creating an opportunity for “cost-neutral” fish passage
enhancement. Greatest efficiency is likely to be achieved when fish passage
enhancements can coincide with structure renewals.
By creating a raised platform constructed on top of concrete blocks, the excavator was
able to remain out of the water, minimising some associated construction impacts.
Coffer dams were installed across the river, one half at a time, allowing for sediments
disturbed in the construction zone to settle out of the main flow.
The water level drop over the riffle length is quite small (c. 0.5 m) and the channel is narrow
downstream, resulting in the riffle being fully submerged during even small floods. Thus,
the experience from this remediation may not be readily transferable to higher weirs, such
as Mona Vale (John Walter, 2021, Pers. Comm.).
3.3.2. Mona Vale Weir
Waterway: Avon River
Location: Mona Vale
FPAT ID: 1630
CCC Asset ID: WcWeirs 108
Fish passage issue: A large, stepped weir with drop heights of up to 0.6 m (Figure 10). Fish
ladders are present, but they do not provide passage for smaller non-jumping native fish and
they do not appear to be used by the original target species, brown trout, which have been
seen trying to jump over the weir (personal observation).
Figure 10: Photographs of the weir in the Avon River at Mona Vale.
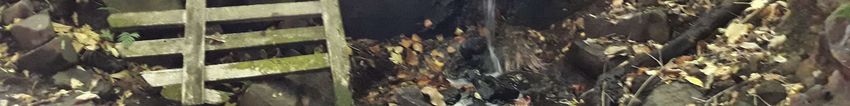
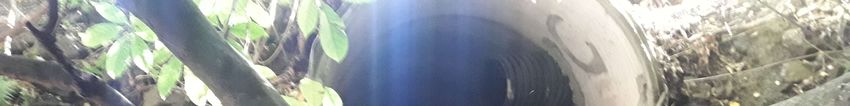
Page 20 Instream.2021_CCC_Fish_Passage.docxUpstream habitat potential: Up to 34 km, excluding piped sections (CCC watercourse GIS layer). This number is indicative only, as discussed in Section 3.3.1 above. Fish community: NZFFD records show numerous migratory species immediately downstream of the weir, many of conservation interest. Fish records include a single lamprey (Threatened), and longfin eels, inanga, bluegill bully, and giant bully (all At Risk species, Dunn et al. 2018). Additionally, shortfin eels, common bully and brown trout have also been recorded. All species except for inanga and lamprey have been recorded above the weir. Priority and values: This structure was assigned a medium priority for remediation (R3). This is the maximum priority for a structure in a non-priority catchment. The structure fulfils many of the suggested ecological prioritisation criteria (Table 1). While the structure is a long distance from the coast (c. 20 km), this is the first structure in the mainstem of the Avon River that is a substantial barrier to fish passage. The upstream catchment is large, including access to numerous tributaries. The local fish community includes migratory species that would benefit from enhanced passage, including many of conservation interest. This structure was previously identified as a significant fish passage barrier and a top priority for remediation in the Avon River catchment (Instream Consulting 2020b). Potential remediation and cost: Discussions are currently underway regarding remediation of this structure with the addition of a rock riffle downstream. Construction of a rock riffle at Mona Vale is estimated to cost in the order of $750,000 (Mark Mullaney, 2021, Pers. Comm.). From a fish passage perspective, the design should focus on achieving low marginal velocities and rest zones. Slopes of 1:30 are recommend to achieve passage of weakly swimming species such as inanga (Franklin et al. 2018). 3.3.3. Kaituna Valley Culvert Waterway: Kaituna River Branch No 6 Location: Kaituna Valley Road FPAT ID: 130205 CCC Asset ID: SwPipe 58799 Fish passage issue: A perched culvert with a drop height of 0.9 m below the culvert and shallow swift flow through the culvert (Figure 11). Upstream habitat potential: 1.8 km (CCC watercourse GIS layer), however a high-risk private ford is located 50 m upstream that limits the value of remediating the culvert. Fish community: Electric fishing and spotlighting upstream and downstream of the culvert prior to remediation identified a small number of At Risk longfin eels (Dunn et al. 2018), both upstream and downstream of the culvert. Longfin eels are strong climbers and no weak swimmers or climbers (e.g., inanga) were identified upstream or downstream of the culvert (Instream Consulting 2020a). Solution: The structure was considered a low priority for remediation, given the fish community present, and surrounding natural and artificial barriers (Instream Consulting 2020a). However, culvert repairs were being undertaken, so fish passage remediation was Instream.2021_CCC_Fish_Passage.docx Page 21
included in the repairs. This entailed the addition of a fish ramp (slope: 1:2.8) constructed of
rocks embedded in concrete, and the addition of baffles through the culvert (Figure 11).
Construction was completed in 2020.
Figure 11: The perched culvert in Kaituna Valley before (left) and after (right) remediation.
Costs: Construction cost of $25,500, including labour and materials, but excluding
professional services, monitoring, and fish salvage (which would be an additional c. $7,000).
Of the construction cost, $12,400 related to the downstream ramp and back filling, and $1,000
related to the baffles. It should be noted that this project was competitively priced by the
contractor, and relatively local to Christchurch for a Banks Peninsula site, which also reduced
costs (Neil Andrews, 2021, Pers. Comm.).
Remediation effectiveness: Electric fishing after remediation revealed similarly low numbers
of fish with only longfin eels caught, all of which were downstream of the culvert. Given the
low density of this species prior to remediation, it is difficult to quantitatively demonstrate
effectiveness of the installed fish passage enhancements. The slope of the fish ramp was
much steeper than the 1:30 slope recommended by the Fish Passage Guidelines to allow
passage of small bodied fish (Franklin et al. 2018), however, it was appropriate for the target
species (longfin eels). Given the natural barriers (cascades) downstream, weak climbing
species such as inanga are very unlikely to gain access to the culvert. Individuals that may be
able to pass through the remediated culvert would be introduced to limited upstream habitat,
as there was a high-risk ford 50 m upstream.
Lessons learnt:
The structure was a lower priority for remediation, given the limited number of species
present, low fish numbers, high position in the catchment, and presence of an additional
barrier upstream. However, remediation was legally required because the structure was
being repaired.
The rock ramp and baffles did enhance potential fish passage, by removing the fall height
and reducing culvert velocities.
The remediation design was appropriate for the fish species present.
Quantifying actual fish passage enhancement was not possible, due to low fish
abundance.
Page 22 Instream.2021_CCC_Fish_Passage.docxYou can also read