PROJECT SHOTOVER - WHAT DID WE LEARN? WHAT DID WE ACHIEVE? - Water New Zealand
←
→
Page content transcription
If your browser does not render page correctly, please read the page content below
PROJECT SHOTOVER – WHAT DID WE
LEARN? WHAT DID WE ACHIEVE?
John Crawford (Opus International Consultants Ltd / Beca Ltd) , Simon Mason (Downer /
QLDC), Derrick Railton (Fluent Solutions), Neil Smart (Downer)

ABSTRACT (500 WORDS MAXIMUM)
The Wakatipu Basin is experiencing a rapidly growing resident population and rapidly
growing tourist numbers in what is one of the most sought after destinations in New
Zealand. Since the early 2000’s, Queenstown Lakes District Council (QLDC) has been under
pressure, from Otago Regional Council, to upgrade the facilities which discharge into the
near pristine Shotover and Kawarau Rivers.

Project Shotover, serving the communities of Queenstown, Frankton, Lake Hayes, Lake
Hayes Estate, Shotover Country and Arrowtown, is a three stage project to completely
renew the wastewater treatment facilities.

This paper considers the Stage 1 project which was procured in 2014/15, built in 2015/16
and commissioned in 2017. At the time, it was the largest capital works project ever
undertaken by QLDC. It followed Project Pure, the equivalent facility servicing Wanaka,
which had encountered problems in its development and had left the Council nervous about
the ability of the industry to deliver such projects to a high standard, within time and
budget while meeting all of Council’s needs.

Like Pure, Shotover was delivered using a Design, Build and Operate procurement method.
However, for Shotover, the ‘Operate‘ period was increased to 5 years (using the FIDIC
Gold form of contract) emphasizing the importance of the operability/reliability of the plant
to the contractor.    While leaving the process selection completely up to proposers,
Shotover also came with a very prescriptive set of ‘Employer’s Requirements’ stipulating
the minimum standards required and guarantees on performance and operating cost.

Shotover was completed prior to commencement of the new consents, it was completed
within budget, with comparatively few and minor variations and the new MLE + UV process
is producing a very high standard of effluent. This level of success demonstrated the
Council team’s ability to work through complex projects successfully and has given the
Council the confidence to subsequently embark on its major infrastructure development
programme, starting with the Eastern Access Road.

As with all major projects, Project Shotover also offers up learnings and lessons that are
valuable to the wider water and wastewater industry. While D&B / DBO is still popular and
is a very good delivery mechanism, it is not a silver bullet and nor is it appropriate in all
situations. This style of delivery requires a substantial investment from the market to bid,
adds to the level of risk carried by the contractor, and also requires substantial input on
the client side to set up and manage. It does not do away with a consultant team and it is
not necessarily a quicker means of delivery. The size and nature of contract selected for
this delivery mechanism needs to be commensurate with the amount of risk that the
contractor is required to take on.

Keywords

Design, Build, Operate, Procurement, Delivery, Risk
1        INTRODUCTION
1.1          BACKGROUND
The Wakatipu basin, situated toward the southern end of Queenstown Lakes District, is a
mountainous location with a dry, almost continental climate with cold winters and ho dry
summers. The basin communities, comprising communities of Queenstown, Frankton, Lake
Hayes, Arrowtown, Arthurs Point, Jacks Point, Quail Rise and Hanley Downs are located
around the ‘knee’ of Lake Wakatipu. It is an area of outstanding natural beauty and home
to a vast array of year-round adventure tourism activities, making it ‘a’, if not ‘the’
premiere tourist destination in New Zealand.

The Shotover, Arrow, Kawerau and subsequently Clutha rivers drain the District down
through Central Otago, into and through Clutha District and into the Pacific Ocean at
Balclutha. These rivers are used extensively for adventure tourism but also for irrigation,
fishing, recreational boating and hydro-power generation.

The normally resident population of the District is approximately 28,000 persons and for
every local resident there are, annually, 34 international tourists visiting the District. As
can be imaged, this level of visitation places an enormous burden on infrastructure and,
consequently, the ratepayers who are funding the development and management of that
infrastructure. Residents and visitors alike expect1 of the District:

•      Stunning scenery in an unspoilt environment
•      World-class infrastructure and services
•      A safe, secure environment in which to live and recreate
•      Affordable facilities and accommodation
•      Friendly, hospitable people
•      A relaxing place in which to live or holiday
•      A place for outdoor adventure, no matter what time of year

The aesthetic and biochemical quality of the ‘waters of the District are therefore of
paramount importance to the wellbeing and economy of the entire Otago Region.

1.2          PROJECT SHOTOVER ORIGINS
The Queenstown/Frankton area has been serviced, since the 1970s, by a three pond
oxidation pond system, located on the delta of the Shotover River about 1.5km upstream
of the confluence with the Kawerau River. Since the construction of the ponds, the serviced
area has expanded to include the Arrowtown and Lakes Hayes communities, and more
recently, the new developments at Lake Hayes Estate and Shotover Country have
connected to the plant.

Project Shotover had its origins in 1998 when new consents were issued, whose conditions
envisaged a move away from direct disposal to the Shotover River and to land based
disposal. Investigation of various options commenced in 2002, following which, tenders
were called for construction of a land disposal scheme on the Shotover Delta. At that time.
All tenders were rejected and further investigations and options assessments followed.

 In 2008 the Otago Regional Council (ORC) applied additional pressure on Council to
improve the discharge. Further research was undertaken on disposal to ground and consent
applications were made in late 2008. These were defended and ‘orders’ of the Environment
Court were subsequently signed in October 2010. The main thrust of the new consents
was nitrogen removal, disinfection and removal of the direct discharge to water. Minor

1
    Priority expectations taken from an actual survey of residents and visitors.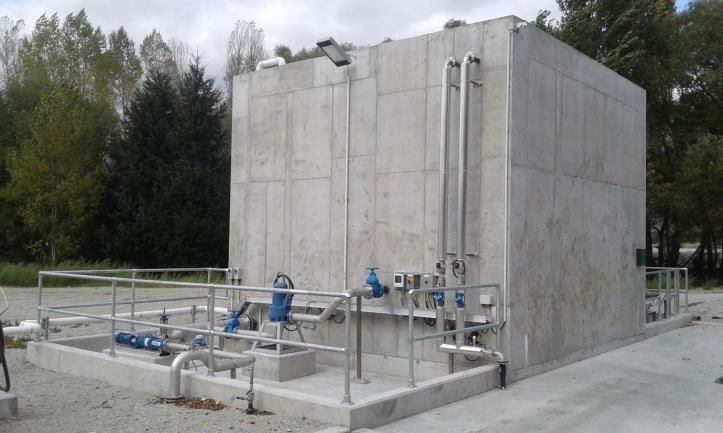
changes were made along the way with final sign off in 2015, just before award of the
Project Shotover DBO contract.

An external team was appointed in early October 2010 to assist Council with
implementation of Project Shotover. This included a legal team, technical advisors
specializing in WW process engineering and Employer’s Representative to manage the
FIDIC ‘Gold’ Book DBO contract. This latter role being similar to the ‘Engineer to the
Contract’ role under the NZS 3910 Book. Local authority elections were held toward the
end of October, and with considerable pressure on to reduce debt and reprioritize
infrastructure spending, Project Shot over was put on hold within days of the election.

The team was reconvened in May 2013 and from that point onward, Project Shotover
Procurement commenced in earnest.

2    GROWTH IN THE WAKATIPU BASIN

Because the reputation of the District for its natural beauty, the adventure that it offers
and the level of service provided to visitors is becoming widely renowned around the globe,
the popularity of the District is growing rapidly, as are both its resident and visitor
populations. With a current EP of approximately 42,400 (Residents PLUS Visitors), the
Wakatipu ward is predicted to grow through to 2040 at a rate of approximately 2.6%
compounding annually. Growth rates within that period however, will vary.

At the time, New Zealand was emerging from the global financial crisis and Queenstown
was not immune to the effects, with several large developments such as the Hilton complex
in Kelvin Heights and the Henderson development at Five Mile stalling. Flow and growth
projections provided to the team in mid-2013 suggested a comparatively modest growth
rate of approximately 1.4% compounding annually (from 8,068 to 10,000 m3/d over 15
years – see blue line in Figure 1).

In practice growth actually continued to increase at an average of 2.6% compounding
annually. Actual resident population statistics provide a guide to growth only and, given
the very high proportion of visitors making up the total equivalent population at any one
time, are of little use in a wastewater context.

                                                 Figure 1: Project Shotover - Projected Flows and Capacity

                                         18000

                                         16000
             Average Day Inflow (m3/d)

                                         14000

                                         12000
                                                                                           2013 Projection
                                         10000                                             2017 Actual
                                                                                           2017 Projection
                                         8000                                              Stage 1 Capacity
                                         6000                                              Stage 3 Capacity

                                         4000

                                         2000

                                             0
                                              2000        2010        2020        2030         2040           2050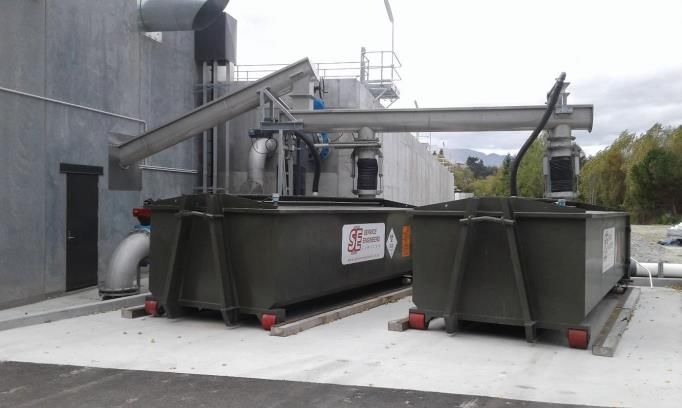
The exact cause of the sharp increase in AAF in 2015 is unclear but it may have coincided
with much of the new ‘Five Mile’ commercial / industrial area coming on line.

Table 1 below shows actual (2001 – 2013) and projected (2020 – 2040) Resident
Population the Wakatipu Ward of Queenstown Lakes District (Adapted from Statistics NZ,
2013 and from QLDC 2017 ‘Final QLDC Growth Projections’).

       Table 1: Actual and projected growth rates for Wakatipu Basin resident population 2001-2040
 Year              2001-A         2006-A         2013-A         2020-P       2030-P         2040-P
 Res. Pop’n        11,910         15,276         18,294         25,124       30,688         36,428
 P.A Growth                        5.1%           2.6%           4.6%         2.0%           1.7%

3     HISTORICAL PERFORMANCE
3.1    HISTORICAL LOADING
At the time that Project Shotover implementation commenced, loading to the facultative
portion of the pond system was approximately 191kg.BOD5/ha/d (221mg/L, 8,068m3/d,
9.35 ha), At the time the ponds were built, pond design was typically to a Ministry of Works
and Development (MWD) guideline of 84kg.BOD5/ha/day. While later researchers and
practitioners such as Mara have proposed more permissive, temperature based loading
rates, for the climatic conditions experienced in Otago, even these more modern guidelines
give similar loading outcomes to the old MWD guidance.

The treatment plant was configured as a three pond system with 60% raw inflow to pond
1, 40% raw inflow to pond 2 with all pond 1 effluent also entering pond 2. As Queenstown
grew and other communities such as Arrowtown were added, loading increased
significantly above the guideline values and 33 kW of supplementary aeration was provided
to Pond 1 and 21 kW to pond 2.

3.2    HISTORICAL PERFORMANCE
The historical performance of the 3 pond Shotover WWTP, for the period 2011 – 2013 was
as shown in Table 2. In 2013 the average daily flow was 8,068 m3/d.

                     Table 2: Historical Performance of Shotover Three Pond System

                         Pond 1           Pond 2                     Pond 3                Consent
 Parameter
                             Mean             Mean             Mean         95%ile         Mean
 cBOD5 (mg/L)                  68              53               36              56         50
 TSS (mg/L)                   130              106              65              101        65
 NH3-N (mg/L)                  30              32               31              37         25
 TN (mg/L)                     42              40               39              48         35
 TN (t/yr)                   Based on 8,068m3/d ADF            115*
 TKN (mg/L)                  44               43                38              47
 TP (mg/L)                    6                6                 6               7         7.5
 e. coli (cfu/100ml)       377,322          582,269           44,099          231,500      3.5x10⁴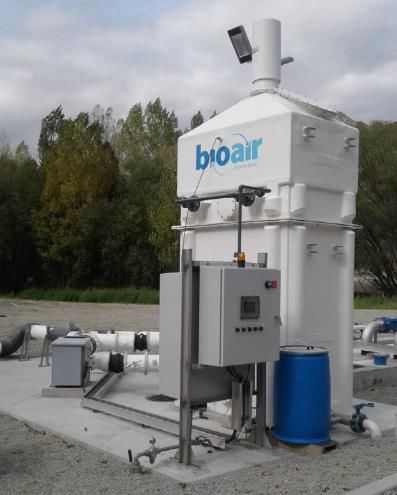
4      NEW CONSENTS
In July 2015, final versions discharge resource consents for the treatment plant were
issued by the Otago Regional Council. Table 3 below summarises the key numerical
conditions of those consents. Table 4 makes a comparison of historical, current and staged
future consented effluent quality requirements.

Some key points to note:

The new, long term consents principally target total nitrogen and e.coli reduction.
Even with projected growth increasing flows and loads by an additional 80% over 2013
values, the ultimate consent requires a 74% reduction in discharged nitrogen load when
compared to the load discharged in 2013.

                   Table 3: Performance Improvements Required by New Consents

 Parameter                          Improvement Required

              Over existing performance           Over Raw Waste

 cBOD5        72% reduction                       95% removal (221mg/l)

 TSS          85% reduction                       97% removal (287mg/l)

 NH3-N        NA. Driven by TN                    N/A (32mg/l)

 TN           74% reduction                       78% removal (46mg/l)

 TN Load      54% reduction                       78% removal (243 t/yr)

 TP           No Change                           Nil (7)

 e.coli       3.6 log10 reduction                 5.9 log10 inactivation (8.7x10⁶)

As can be seen from Table 5 below, the first-year performance of the MLE plant is ‘proof
of concept’ for achieving the requirements of Stage 3 and beyond.
Table 4: Staged Discharge Consent Requirements
Consent Historical 13.215.02** 13.215.04 13.215.03 2008.238.V1
To Water To Water To Water To Land To Land
Expiry April 2016 Feb 2017 Dec 2022 Dec 2031 Mar 2044
Qave m3/day 8,068 8,680 9,285 11,238 14,500***
Qmax m3/day 26,049 26,672 45,000
Mean 95%ile Mean 95%ile Mean 95%ile Mean 95%ile Mean 90%ile
BOD5 mg/l 50 100 50 100 30 50 30 50 10 20
TSS mg/l 65 130 65 130 30 50 30 50 10 20
Amm-N mg/l 25 30 35 40 15 25
TN mg/l 35 40 45 55 23 35 23* 35 10 15
TNtrigger T/yr 73.2 73.2
TNmax T/yr 142.6 75.5 75.5 53
TP mg/l 7.5 10 7.5 10 7.5 10 8 10
e.coli cfu/100ml 3 x10 4
1x10 5
5x10 4
3.5x10 5
260 260 260 260 10 100 (95th)
* Effectively18mg/l
** Temporary consent reflecting existing performance
*** Projected Average Day Flow at Consent horizon
Table 5: Stage 1 First Year Performance vs Current & future Consents
Consent 13.215.04 Stage1 Actual Stage 1 MLE 2008.238.V1
Actual
To Water Blended effluent To Land
75%:25%
Dec 2022 MLE:Pond Mar 2044
Qave m3/day 9,285 9,868 7,698 14,500
Qmax m3/day 26,672 14,998 8,900 45,000
Mean 95%ile Mean 95%ile Mean 95%ile Mean 90%ile
BOD5 mg/l 30 50 6.0 11.8 Not sampled 10 20
TSS mg/l 30 50 8.5 17.0 4.1 8.0 10 20
Amm-N mg/l 15 25 10.1 16.4 0.1 0.3
TN mg/l 23 35 19.4 28.0 5.5 7.6 10 15
TNtrigger T/yr 73.2 68
TNmax T/yr 75.5 53
TP mg/l 7.5 10 4.4 6.9 3.8 3.8 8 10
e.coli cfu/100ml 260 260 20 81 Only blended 10 100
effluent (95th)
disinfected5 WASTE CHARACTERIZATION
5.1 DAILY FLOW
Raw sewage feed to the treatment plant is through five separate pipelines from the various
communities in the area of benefit. All are now individually flow metered. However, that
was not always the case. In preparation for Project Shotover, there was reasonable dry
weather flow data available. However, sewer network predictive modelling had been used
to provide the team with peak flow information with which to go to tender. For the Stage
1 case, the predicted flows were: Average Day Flow (ADF) 9,960 m3/d, Peak Day Dry
Weather Flow (PDWF) 14,609 m3/s and Peak wet weather flow (PWWF) 28,018 m3/d. So
PWWF was predicted to be slightly less than three times ADF, which is not an unreasonable
estimation for New Zealand Conditions. Figure 2 below depicts the actual net plant inflows
over the first 14 months of operation. In practice, while the ADF has been 9,868 m3/d,
Average dry Weather Flow2 (ADWF) is 9,185m3/d, PDWF has been approximately
12,000m3/d and PWWF only 15,000 m3/d. This represents 1.6 x ADWF and 1.5 x ADF.
While it cannot be considered that this represents actual PWWF, the rainfall events of that
same period are significant enough that it can be said that the sewer system is
comparatively tight and that PWWF is going to be significantly less than 3 x ADF. Typical
rainfall events increase inflow by approximately 30%. For example, 22 May 2018, with
90mm of rainfall produced a daily inflow of 14,181 m3, or 1.5ADWF. This comparatively
low wet weather peaking behavior is highly beneficial to smooth operation of the treatment
plant
Figure 2: Net daily treatment plant inflows, first 14 months of operation
16000
14000
12000
Inflow (m3/d)
10000
8000
6000
4000
2000
0
5.2 FLOW TRENDS
Figure 3 below shows the seasonal trends in plant inflow. These traces represent 30 rolling
average net inflow to the treatment plant (net of plant recycles) there are two key points
of interest from this information as follows:
2
ADWF has been calculated as the 20th percentile of all net inflows5.2.1 SEASONAL VARIATION
It would be expected of a resort destination that there would be pronounced seasonal
variation in wastewater production, due to the influx of visitors taking advantage of the
seasonal ‘drawcards’. In the Wakatipu Basin, that might be expected to be snow sports
from July onward and the Christmas new year break in mid-summer. However, such has
become the popularity of this destination and such is the strain on accommodation, that
the seasonal peaks and troughs have largely been flattened and there are only very short
and not very pronounced shoulder periods. The measured variance from ADF was only
17% down to the troughs (June and November) and 17% up to the peaks (January &
February). Again this small variance across the year is beneficial in terms of consistency
of operation and minimizes the amount of plant process adjustment that must be made
during the year.
5.2.2 GROWTH
Significant growth in flows to the treatment plant is being observed on a monthly and
annual basis. Annual average flow (AAF) increases are shown in figure 2 above and
discussed in section 2. These demonstrated a rate of growth significantly greater than
projected in 2013. What is of note in Figure 3 is that the increasing trend appears to be
continuing in 2018 and at a rate which is greater than the current planning projections of
2.5%p.a compounding. Since January 2018, the month on month comparisons with 2017
have been -1.9%, +3.7%, +1.8% and +14.0%. If these significant increases are restricted
to ‘off-peak’ months, (i.e just maximizing use of accommodation across the entire year),
the treatment plant capacity and that of Stage 3 are not greatly threatened, however the
annual TN discharge load threshold is. This trend will be observed closely through the
balance of 2018 and early 2019. While the already experienced growth between 2013 and
2017 means that Stage 3 of Project Shotover will be brought forward to around 2020, the
current trend may dictate that an even closer look is taken at the ultimate capacity
requirements for the plant and whether adjustments are required to the treatment train
sizes allowed for in the current master plan.
Figure 3: Seasonal Variation -30 Day Rolling Average Inflow
12000
Raw Inflow (m3/d)
10000
8000
Net flow
6000
2018
4000
Linear (Net flow)
2000
0
5.3 WASTE COMPOSITION
In preparation for Project Shotover, QLDC invested in undertaking influent characterization
analysis from 2009 to 2013. This resulted in the characterization shown in Table 6 below.
Table 6: Shotover WWTP Influent characterization
Parameter Min Max Mean 95%ile
cBOD5 (mg/L) 88 360 221 290
Dissolved cBOD5 (mg/L) 2 130 63 98Parameter Min Max Mean 95%ile
Total COD (mg/L) 268 1980 601 829
Dissolved COD (mg/L) 40 349 143 203
Flocculated & Filtered COD (mg/L) 30 230 100 152
Ammoniacal Nitrogen (mg/L) 23 43 32 37
TKN (mg/l) 19 106 46 60
Dissolved TKN (mg/L) 23 44 34 41
DRP (mg/L) 2 6 4 5
TP (mg/L) 5 15 7 10
TN (mg/L) 24 120 46 54
Oil and Grease (mg/L) 5 384 100 216
pH 6.7 7.6 7.2 7.4
Total Alkalinity (mg/L) 101 361 189 220
TSS (mg/L) 130 2564 287 400
F.Coli (cfu/100ml) 2.9 x10 5
33 x 10 6
8.7 x 10 6
24 x 106
This characterization and the extensive raw data set that lay behind it highlight that the
Queenstown wastewater presents with an unusually high particulate slowly or
unbiodegradable COD and consequently a lower than would be expected fraction of readily
biodegradable COD. This was perhaps the most contentious and difficult of any issue that
had to be dealt with during the Proposal preparation, evaluation and due diligence phases.
6 PROCUREMENT
6.1 SELECTION OF CLIENT’S ADVISORS
QLDC, in October 2010, appointed a professional advisory team in three parts. These being
legal, technical and contractual to try to ensure that the best of historical experience and
available skills was brought to the project. The technical team was from consulting
engineer’s CPG which brought the consents team, civil, process and structural engineering
skill sets. The contractual team was selected from Opus International Consultants which
brought significant previous experience in managing design and build contracts for
wastewater treatment plants.
Immediately following the local authority election in late October 2010, the project was
once again put on hold as the new Council reassessed the project. The team was
reconvened in May 2013. At this time CPG had divided into a number of smaller private
companies including LEI, ADI and Fluent Solutions. However, the individuals originally
nominated as forming the advisory team all remained. A key success of this project was
that from that point onward, the individuals involved, although from separate and
competing companies, formed a close nit team that remained intact for the duration of the
project. Another key feature of this team was that, internally, a ‘best for project’ approach
was taken with people taking on responsibilities that they had not been engaged for,
without getting ‘precious’ about protecting fees and margins. A key quality of the QLDC
management of this team was that it was given the flexibility and the resourcing to ensure
that a good outcome was achieved.
6.2 PROCUREMENT MODEL
Prior to the advisory team being appointed in 2010, Council had determined that the works
would be procured under a design, build and operate model, using the comparatively new
(2008) FIDIC ‘Gold’ Book for Design, Build and Operate. This decision was partly helped
through demonstration of successful ‘Design and Build’ wastewater outcomes at Thames
Coromandel and Western Bay of Plenty Districts using very similar FIDIC based models.During the ‘On-Hold’ period the existing inlet works became almost completely dilapidated and at very high risk of complete failure. Opus was engaged to provide a concept and detailed design for and to manage construction of a new inlet works that would be capable of serving the existing and ultimate treatment plants. This and other ancillary services and replacement of associated trunk sewers cost approximately $3M. A prequalification process was used in late 2013 and, from that, three consortia were chosen to bid for the project. The Design and Build procurement process encourages bidders to economise because they are not given a specific design to price and are trying to find all avenues possible by which to gain a cost advantage over their competitors. This has led to problems in some previous DB / DBO contracts where the Employer has found it very difficult to achieve exactly the quality they want for the price they have agreed i.e. there is significant price / quality ambiguity remaining when the contract is signed. The Council team therefore assembled a comprehensive set of ‘Employer’s Requirements’ that set out the minimum requirements for undertaking the work on site, process expectations and the minimum technical standards to which the various work types had to be designed and constructed, commissioned then operated. The prescriptive nature of these specifications was a key learning from the Project Pure (Wanaka WWTP) experience, to help ensure the desired outcomes were achieved. Significant focus was also placed on ensuring the project risks were apportioned to the party most appropriately placed to manage the risks over the life of the project. The specifics of the risk allocation are discussed in Section 9.2. 6.3 PROPOSAL DEVELOPMENT A relatively conventional Design and Build proposal development process was used which included a common briefing followed by a series of confidential one on one meetings where Proposers were encouraged to come with their teams to discuss, with the Employer’s team, the development of their Proposal and any issues they were experienced. A probity auditor was appointed to oversee all ‘in confidence’ interactions between the Employer’s Team and each Proposer. This is a common practice to minimise the risk that any party is given important information that is not available or provided to others or that confidential information is not transferred from one party to another. In many of the interactions there is a hold point to determine whether the issue for discussion is actually confidential or needs to be shared with other Proposers. The key issue that arose during this period was that two of the design teams did not accept the wastewater characterization as presented, despite the length of the data record. The COD fractionation did not sit within the default or limits normally accepted in the two most commonly used commercial biokinetic models (BioWin and GPS-X) for the activated sludge biological process. A review of the laboratory testing methods indicated that the unusual characterization was not likely to be because of a laboratory protocol error. This issue was not resolved until late in the evaluation process. The implications and resolution method are discussed further in section 6.4 below. Two parties submitted full proposals. One withdrew without making a submission. One party, Downer submitted two proposals. One a well known, ‘safe’ Modified Ludzack-Ettinger (MLE) based technology and the other an innovative, technology (Organica) using an aeration system and hydroponically grown plants. The commercial part of the Proposal was ‘closed’ 1 week after the technical offer to allow proposers time to concentrate on adequately finalizing the price after all technical work was completed and to allow a ‘head start’ to be made on the technical evaluation.
6.4     PROPOSAL EVALUATION
The proposal evaluation and associated due diligence was a protracted process which was
frustrating and expensive for all parties. All up, this took a year to progress through to
Contract award. A significant portion of this time was due to two enforced stops made by
Council during the process to review the procurement process, and to change legal teams.
Neither of these stoppages resulted in any material changes to the approach being taken.

The process commenced with an evaluation for ‘completeness’. Requests were then made
for the information required to complete technical evaluation. Technical evaluation followed
to a) ascertain the suitability and robustness of the technical solution offered and to identify
both explicit and implicit ‘tags’ contained in the offer. It is critical for these, intended or
otherwise (many appear simply as a result of ambiguity of lack of explicit detail in the
Proposal) to be dealt with and closed out prior to contract award. Any ambiguity carried
over into the contract is likely to result in additional cost later. All three Proposals contained
numerous issues that needed to be dealt with in this manner. This took considerable time.

The Downer Organica proposal was very innovative and appeared promising. Given its
nature, it would also have had significant political support. Considerable effort was put in
into evaluation of the proposal, however, in the end, the proponents were not able to
demonstrate a site where it had delivered the nutrient removal capabilities required at
Shotover, and there was no ready way of using first principals or commercial modelling to
test the likely efficacy and as such it was eventually discarded.

The two remaining proposals involved MLE and intermittently decanted extended aeration
(IDEA) process configurations. Both are robust and both were known to be capable of
delivering the level of treatment envisaged by the Stage 3 consent conditions. The Downer
MLE proposal included a 63:37% split between the new plant and ponds with 10 years
capital deferral until the balance of plant was built. The IDEA proposal was to build all
required Stage 3 capacity at Stage 1, in a single large reactor. This proposal provided no
means of achieving capital deferral.

The key technical issue for resolution (and the one which took most time) was how the
measured COD fractionation would be adequately accounted for in the accepted Proposal.
The implications of the high Fup and low rbCOD included higher than normal sludge
production and potentially the need for a supplementary readily biodegradable carbon
source to achieve the required levels of denitrification. It is beyond the scope of this paper
to go into all the detail of how this was worked through. However, in the end, the Employer
negotiated an additional sum into the contract value to provide an additional 15% capacity
into the treatment plant to ensure that the sludge management and denitrification facilities
were sufficient to comfortably provide the required performance without supplementary
rbCOD addition.

Following completion of the technical evaluation and marking, the commercial proposals
were opened and evaluated. By contrast with the technical queries, the commercial
conditions were largely as would be expected with a Contract of this nature and were
comparatively easily dealt with and settled.

7     DESIGN AND CONSTRUCT PHASE
      7.1   OVERVIEW OF UPGRADE
The accepted proposal put forward by the Downer/Jacobs team consisted of a new
activated sludge reactor, clarifier, ultraviolet disinfection plant (UV), septage reception
facility, sludge dewatering facility and associated equipment.
The overarching philosophy was to utilize the pond based system, to streamline the capital
expenditure so as to align with the staged resource consent that had been negotiated with
Otago Regional Council (ORC). In this arrangement the incoming flow is split, following
preliminary treatment, between the new activated sludge process and the pond system,
with the effluent streams from each process being blended prior to ultraviolet (UV)
disinfection.
The plant was designed to treat wastewater to the quality as described in Table 4. The new
MLE process working in conjunction with the existing ponds was designed to accommodate
the wastewater flows as set out in Table 7 below.
Table 7: Summary of Design Flows
Stage 1 Stage 3
Peak day dry weather flow (l/s) 311 438
Peak instantaneous wet weather flow (l/s) 522 609
Full flow to treatment through MLE process (l/s) 215 430
Average day flow, ADF (m3/day) 9,960 14,391
Peak day dry weather flow, PDWF (m 3/day) 14,609 21,137
Peak wet weather flow , PWWF (m3/day) 28,018 32,979
7.1.1 GRIT REMOVAL AND FLOW SPLITTING
The upgrade to the treatment plant completed in 2013 did not include a facility for grit
capture. The pond based treatment process was not sensitive to grit, however, moving to
a mechanical treatment process meant this was a necessary inclusion to protect the
downstream equipment.
The screened wastewater leaving the screens enters a vortex grit removal system to
remove sand, grit and other fine inorganic materials. The chamber is designed to induce
vortices in the flow of wastewater which encourages the inorganic material to settle to the
bottom of the chamber.
The collected grit is then pumped through to a grit classifier where the grit is dewatered
prior to being conveyed into the shared screenings bin. The water separated from the grit
is conveyed by gravity through to the inlet works wastewater pump station from where it
is returned to the head of the works.
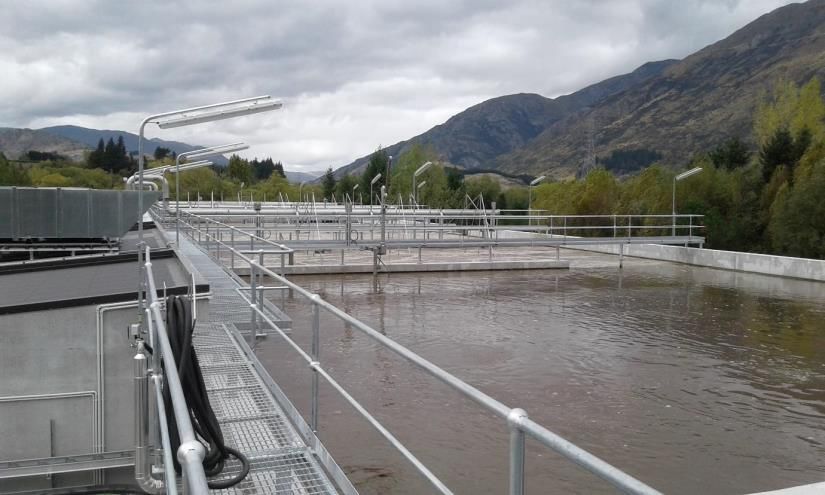
7.1.2 REACTOR TANK Figure 4: View across MLE reactor (Anoxic Zone 4 in foreground)
The Activated Sludge treatment
stream utilises the MLE process.
The main reactor consists of
several zones: three pre-anoxic
zones, an anoxic zone, swing zone,
and aeration zone.
MLE 1 receives screened sewage
into Pre-Anoxic Zone 1 and RAS
from Clarifier 1, the two streams
are perpendicular to promote
mixing. The exit from each Pre-
Anoxic zone has 900 x 900mm
undershot port which transmits
approximately 80% of the flow, with the remaining portion passing over a 2m wide
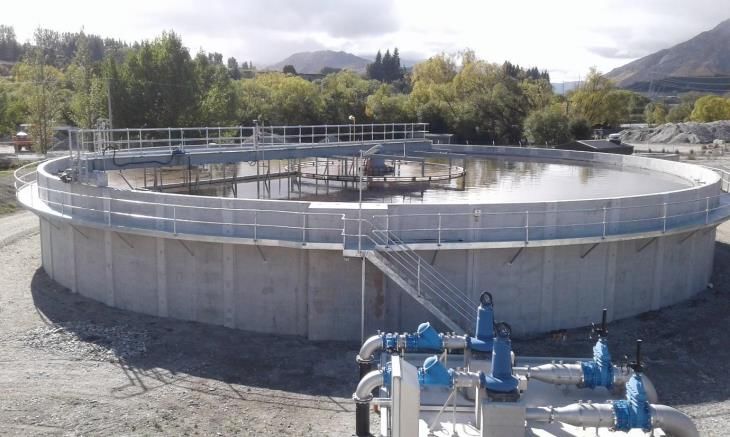
drowned overflow. The A-Recycle discharges in front of the undershot port from pre-anoxiczone 3, again to promote mixing of the two streams. Approximately 83% of the flow from the Anoxic Zone discharges through a 1.7 x 1.7m undershot port in the diametrically opposed corner, and the remaining portion passes over a 6m wide drowned overflow above. There is a similar undershot and overflow arrangement between the Swing Zone and the Aeration Zone. Mixed liquor flows over the outlet weir and is transferred to the clarifier via a DN900 pipeline. 7.1.3 CLARIFIER The Clarifier is 34m in diameter, 5m side Figure 5: Clarifier tank (RAS pumps in foreground) wall depth, and equipped with a syphon lift RAS withdrawal system. Scum on the clarifier surface is carried to the scum box by the scum skimmer. The scum box opens when the bridge and skimmer passes and the Scum Pump delivers scum to the WAS Holding Tank. Scum may be diverted back to the MLE reactor if not of a filamentous nature, reducing the water content of the WAS to centrifuge. Return Activated Sludge (RAS) is recycled from the Clarifier syphon withdrawal system back to Pre-Anoxic Zone 1 of the Bioreactor, via two dedicated dry mounted pumps. WAS is split from the RAS line and directed to the WAS Holding Tank 7.1.4 UV DISINFECTION Clarifier effluent and pond effluent from the Pond Discharge Pump Station combine in the blending chamber, then gravitate through the channel UV disinfection system. The concrete channel has been designed to accommodate two rows of seven banks of UV lamps (Banks A to G). The second series of banks is planned to be installed at a future time in a section of the channel that is isolated by removable concrete inserts in Stage 1. A motorised downward opening penstock controls the level in the channel so that it is in the required range for disinfection and is essential for disinfection performance. The output of the Pond Discharge Pump Station is controlled to minimise fluctuations in flow and UV transmittance that would require banks to be switched on and off. The target flow is a percentage of total UV flow that is determined from a table of blend percentage set points vs. UV transmittance. During periods of flow lower than the feasible output of the pump station, the pumps operate periodically so that the required flow is achieved without an excessively high proportion of pond effluent. The pumping ‘periods’ are sufficiently long that UV flow changes infrequently. The UV system is designed for a peak instantaneous flow to disinfection of 275 l/s. The design water quality of the effluent entering the system is E.Coli of 1x10⁷ cfu/100ml, maximum TSS of 25mg/l, and a mean UVT of 40%. 7.1.5 SOLIDS PROCESSING Part of the RAS flow is split as Waste Activated Sludge (WAS) and directed to the WAS Holding Tank. The WAS flow rate and volume is controlled by a WAS line actuated valve and a RAS line actuated valve, with measurement by the WAS Flowmeter and RAS flowmeters. The system wastes each day to achieve a daily volume set by the operators
via the PLC. When the system is asked to waste the WAS actuated valve opens and the
RAS control valve restricts to a set position to encourage flow to the WAS tank.

The WAS tank is a glass coated steel tank with a top water depth of 5.3 m, giving a working
volume of 100 m3. The tank is intended as a holding tank to keep a store of WAS to allow
for continuous WAS processing. The tank is continuously aerated to prevent odour
generation.
                                                     Figure 6: Sludge bins and loading conveyors
Two progressive cavity pumps feed WAS from
the holding tank to the dewatering
centrifuges. The pumps are operated via VSD
and have a maximum flow rate of 20 L/s.
Sludge is pumped from the WAS feed pump
station into either of the two centrifuge units.
As the sludge pipework enters the dewatering
building, polymer is dosed into either of two
locations along the pipework, one located just
inside the building, and secondly just prior to
the WAS entering the centrifuge feed chamber
(normal dosing point).

The sludge enters the centrifuge feed chamber through a central pipe. The denser solids
settle against the bowl wall under the influence of the centrifugal force implied on it by the
rotating bowls of the centrifuge. The lighter liquid is clarified from the bowl by flowing to
the liquid discharge port via an adjustable weir, which determines the clarifier pool depth.
Solids deposited on the bowl wall are transported towards the conical end of the bowl by
the internal conveyor scroll to the discharge ports. A series of three shaftless screw
conveyors, conveys the dewatered sludge from the dewatering building into one of two self
levelling bins. The centrate produced by the process is drained under gravity to the site
waste pump station, from where it is conveyed back to the head of the works. The
centrifuges are designed to process at a rate of up to 550 kg/hr, with a feed solid of 0.8%.

7.1.6   POND PROCESS STREAM
The facultative ponds are silt-lined ponds with concrete wave bands, which are
approximately 1.35m in depth. Pond 1 has an area of 5.5Ha and Pond 2 has an area of
3.9Ha. All three ponds were de-sludged in November 2012.

Both of the facultative ponds have mechanical aerators to add additional oxygen to the
ponds to assist in the breakdown of the organic matter. Pond 1 has seven Tornado 3kW
horizontal mixing aerators with subsurface propellers which are mounted on floating
platforms and four fixed position 3kW paddle wheels aerators. Pond 2 has four Tornado
3kW horizontal mixing aerators with subsurface propellers which are mounted on floating
platforms and three fixed position 3kW paddle wheels aerators.

Following the facultative ponds the effluent is polished in a single 6.5Ha maturation pond
which has a depth of 1.5m. The pond contains a rock groyne which is used to direct the
flow, increasing the retention time in the pond. The maturation pond is used to reduce
faecal coliform levels via treatment from the sun light and the retention time allows algae
passed over from the facultative ponds to settle out.

The Pond Pump Station is designed to lift effluent from the maturation pond (Pond 3) to
the blend chamber at the head of the UV channel.

The inlet to the pond pump station comprises of a concrete headwall and two DN450
stainless steel pipes, each inlet pipe is open to the atmosphere, while the downward facing
intakes are located approximately 550mm above the floor of the pond to limit the amount
of sludge or solids drawn into the pump station. The vertical pipes to atmosphere serve as baffles to prevent the top 500mm of algae rich water being drawn into the pump station. An isolation valve has been placed on both DN450 pipe lines entering the pump station. The pump station comprises of two 22kW pumps operating in a duty/assist configuration. The pump station is capable of conveying up to 240L/s to the UV channel. Each pump discharges into a DN300 stainless steel line with a non-return valve and manual isolation valve. These lines are then coupled into a DN400 line and pass through a single flow meter prior to entering the UV blend chamber. 7.1.7 ODOUR TREATMENT The plant includes an odour removal system for treatment of Figure 7: Odour treatment foul air extracted from the following areas: system • Sludge thickening / dewatering centrifuges • Sludge out loading conveyor / bins • Site Wastewater Pump Station • Septage Facility Septage Holding Tank The unit includes a biological scrubber followed by a carbon bed for polishing. The lower section of the scrubber contains media that supports a film of biomass. Sprays distribute recycled effluent across the media which trickles down in the opposite direction to foul air and exits via a drain to the site waste pump station. Above the sprays is a layer of carbon media, which adsorbs any remaining odorous compounds. The top of the unit is formed into a vent, where treated air exits to the atmosphere. The system is designed to treat up to 1,280m3/hr. 7.1.8 SEPTAGE RECEPTION The new septage reception system is designed to provide a controlled collection Figure 8: Septage reception system (mixing and transfer and metering of the septage loads to the pumping system visible) plant. The storage tank allows the septage to be fed into the process in a controlled manner so as to avoid shock loading. The septage trucks connect to the system at a male camlock fitting on the inlet to the rock trap. The rock trap is designed to capture heavy debris. The collected material is dumped manually by actuating the valve beneath the rock trap, into a basket. The incoming septic waste is macerated prior to being pumped into the holding tank. Access to the system is via a swipe card system. Upon swiping a legitimate card the actuated valve will open, the macerator will start and the inlet pump will also start. At this point the flow meter will commence logging such that a disposal record can be created against the card ID. The septage discharge pump transfers septage to the site waste pump station, allowing the fluids to get mixed with site wastes prior to transferring to upstream of the inlet
screens. The Septage return pump is a positive displacement pump to assist with keeping
a constant flow rate of 2 L/s being pumped from the septage tank.

    7.2     DESIGN PROCESS
7.2.1    GEOTECHNICAL CONSIDERATIONS
A key aspect of the design that was not recognized by the Downer/Jacobs team during the
tender stage was the liquefaction potential of the site. Further analysis and testing post
award identified that the site posed a higher risk than initially thought, and that additional
treatment was necessary to mitigate the associated risks of developing in the selected
location.

Learnings from the Canterbury earthquake also played a part in how the information
available at the time of tender was interpreted both pre and post tender. A significant
component of the geotechnical information made available to the proposers pre-dated the
earthquakes and some of the risk assessments made in these reports was inconsistent with
the thinking of the geotechnical community following the Canterbury events.

The primary geotechnical considerations for the design and construction of the upgrades
were; the relatively loose near surface sands and gravels and, the relatively high ground
water level. Ground improvement in the form of densification of the near-surface soils was
deemed necessary to provide uniform support of the structures comprising the new plant.

Densification of the upper layer of loose silty sand and gravel, and the placement of a
geogrid under the structures was provided to produce post liquefaction differential
settlements of 1/750 or less across the structures.

A Broon’s roller was used to densify the upper 2 to 3 meters of ground in the area of the
large structures (MLE and clarifier). Due to existing services and features this treatment
could not be applied universally across the site for all structures, and where improvements
by densification were not possible, a 3m deep gravel raft was constructed to reduce the
effects of liquefaction.

The Settled Effluent Chamber was unique due to its location, and was constructed on a
series of steel ‘H’ piles. The piled design consists of eight piles driven to approximately 6m
deep.

The late realization of this key design consideration placed significant challenges on the
project programme and required the construction team to reassess the proposed
methodology of the MLE reactor to minimize delays through the project critical path.

7.2.2    PEER REVIEWS & CLIENT REVIEWS
An element of the design phase, which had a material impact on the design process, was
the involvement of peer reviewers, the requirements for which were set out in the
Employer’s Requirements. The Contract required the Contractor to undertake peer reviews
for critical elements of the work, including:

   •    Geotechnical design
   •    Process design
   •    Structural design

In addition to these reviews, all design information was required to be submitted for review
by the Employer’s advisory panel. A key challenge developed through the design stage
regarding the timeframes associated with these reviews, coupled with inconsistencies in
feedback received between the client review and peer review.
These review processes are essential for ensuring the project outcomes are consistent with
requirements and wider expectations. They provide an opportunity for assumptions to be
challenged, and also for additional investment to be considered by the client to add value.
On reflection, the contracting organization could have improved the efficiency of this
process by including these steps in the design phase programme developed as part of the
tender. This exercise would have demonstrated how critical these functions were in regard
to overall project timing, as well as the overall programme sensitivity to any review
processes requiring multiple iterations. This information would have helped all parties
better understand risks to the critical path associated with the significant number of
reviews required, and may have motivated a more collaborative approach to streamlining
this process.
7.2.3 DESIGN WORKSHOPS
Throughout the design phase a number of workshops were held, bringing together the
various stakeholders to try and streamline the design process, and bring all parties along
on the journey. In total three workshops were held, as described below:
• Design ‘Kick off’ Workshop (1 day)
This review was largely focused at a Process and Instrumentation Diagram (P&ID)
and general layout level. Having an early workshop allowed the design team an
opportunity to present changes and improvements they were considering from the
tender design. One such change was the relocation of the dewatering room to be
adjacent to the reactor tank with a shared wall with the tank (the tender showed
this as a shared building with the operators.
• HAZOP 1 Workshop (2 days)
This workshop formed the first formal workshop as required under the contract. This
was conducted as a hazard and operability (HAZOP) study facilitated by an
independent specialist. During this session each aspect of the design was assessed
in detail, through pre-determined nodes, against a set of keywords representing
possible modes of failure, or unusual operation. The response of the system was
assessed in each condition and deficiencies noted for action by the design team.
A challenge at the time of this workshop was that the design team were waiting on
some suppliers to deliver detailed design information in order for them to complete
aspects of the design. This precluded these aspects of the plant from being reviewed
to the same level as the other features.
• HAZOP 2/Safety in Design Workshop (3 days)
The final workshop was held in November 2015, when the design work was largely
complete, and detailed layouts of each process area were available. A key outcome
from the workshop was that a review of the location of the septage facility was
triggered to allow for better traffic movement, and allow for the system to be more
easily serviced by the odour removal system. The change saw the septage system
relocated to the same side of the access track as the odour system and site waste
pump station. This removed a pipe bridge spanning across the road for the odour
ducting, with the advantage of deleting the operational task of condensate drainage,
and eliminating the risk of over height vehicles damaging the pipe bridge.
7.2.4 VENDOR DELIVERABLES TO INFORM DESIGN
A challenge across the design phase of the project was achieving the required level of
vendor design input in the constrained design timeframe. The typical issues in this regard
were complicated through changes made during the contract negotiations. These changes,
along with the significant time that had elapsed since the tender selection were made,meant that a number of the equipment selections at tender time needed to be revisited for the revised requirements. The process of amending specifications, tendering, evaluating and awarding consumed a significant amount of time, and prevented aspects of the detailed design from being progressed within the intended programme. Compounding these challenges was the intention for a small number of the supplier packages to be completed as ‘design and build’, most notably the aeration system. The introduction of these supplier led design packages caused some interfacing difficulties, requiring the parties to work together to resolve. 7.2.5 'JUST IN TIME’ DESIGN DELIVERY Given the relatively short planned design phase of 6 months, combined with the complex nature of the facility, the incremental delays associated with review process, the geotechnical issues, and delays around vendor design information became a significant concern to the project team. To offset the consequences of these factors, approval was sought on certain elements in isolation to feed work through to the construction team such that work on critical path items could progress prior to the design as a whole being accepted. At a high level some of the early/individual works approvals were: • Long lead time equipment • Ground improvement works • MLE reactor tank • Clarifier structure • Blower Building • Dewatering building • Operations building This approach ensured the consequence of design slippage on the project critical path could be managed. In a conventional procurement model this approach would not be possible, and project delays would have been unavoidable. 7.3 CONSTRUCTION 7.3.1 CRITICAL PATH The project critical path primarily ran through the MLE tank structure, mechanical fit out, electrical works and commissioning. The MLE tank had shared walls with both the blower building and the dewatering building, and as such the downstream consequences of delays associated with this structure would be significant. This was the critical path identified at project inception and this was representative of the actual critical path. Hydrostatic testing of the MLE tank had substantial programme implications due to the volume of water required for the test, restrictions on rate of fill and the risk of failure. Ultimately the tanks required re-test as a result of the appearance of fine longitudinal cracking, observed when under test with unacceptable levels of seepage. These cracks were treated with a surface applied crystalline treatment which reacts with the water and un-hydrated cement to form crystals which fill pores and micro-cracks. Given the treatment process is a biological system, the length of time to culture the biomass to provide the desired level of treatment was a distinct programme risk. 7.3.2 MLE REACTOR CONSTRUCTION The MLE tank was built as a fully poured in-situ concrete tank. Upon commencement of the reactor construction the project was tracking behind the baseline programme. To offset
the early delays the construction approach was reviewed to enable some of this time to be
recovered. The final methodology allowed for larger concrete pours than originally planned,
this reduced the number of construction joints to be catered for and allowed larger crews
to work on the structure at one time. To facilitate this change in methodology the quantity
of formwork available at one time needed to be increased.

The floor slab was constructed in two pours, each of approximately 400m3. At the time
these were the largest concrete pours ever completed in Queenstown and required detailed
planning to ensure continuity of supply. The pours were completed at night for two key
reasons; the cooler temperatures and the lower volumes of traffic.

The exterior walls were also poured in two sections, each of around 120 linear meters with
a height of 6.2m. Special Doka formwork was brought in from overseas suitable for the
concrete loading at this height. The reinforcing steel was pre-tied in panels (on-site) that
could be lifted into place against one side of the formwork. This allowed the steel tying
activities to be advanced whilst the inner formwork was erected. The steel fixers then
attached the splicing steel with the carpenters placing the formwork immediately behind
them. Panel vibrators were used during the pour to help ensure the concrete was effectively
vibrated across the full height and width or the pour.

7.3.3   CLARIFIER CONSTRUCTION
The clarifier tank consisted of a poured in-situ concrete base, and precast, post tensioned
walls. The pre-cast panels were precast locally in Cromwell. The clarifier mechanism rotates
about a central column on the top of the clarifier walls, due to this precision placement of
the cast-in centre column and precast panels was essential to ensure correct operation.

7.3.4   GRP DISCHARGE PIPE
Another significant element of the construction was the 1-kilometer section of DN1000 GRP
discharge pipework between the clarifier and the UV chamber located at the outlet of the
ponds. The pipe route was adjacent to the existing ponds and a busy track, which provides
access to two of the local quarries as well as forming part of the Queenstown cycle trail.

The length of trench open at any one time was minimised to reduce the risk of pond
embankment breach, which would have had significant adverse environmental
consequences.

7.3.5   CLOSE OUT
The project had a substantial requirement around handover documentation at completion,
including the O&M manual, as built drawings, asset register, producer statements etc. The
volume of documentation involved meant that the collation, submission and subsequent
review of the information was a lengthy process. A learning from the experience on this
project was that starting this process earlier, and addressing elements of this handover
package as the project progressed would have streamlined the process, and managed the
associated workload for all parties.

8     COMMISSIONING AND OPERATIONS
8.1     PLANT SEEDING
The plant was brought into commission without the use of an imported seed sludge. This
decision was made to avoid carrying over issues from other plants (such as filamentous
bacteria) and allowing the new process to have a ‘clean slate’. The plant commenced
receiving wastewater in November 2016, slightly later than planned, but more favorable
from the perspective of establishing the biomass due to the warmer temperatures.
The location of the plant, adjacent to SH6 and in full public view meant that all parties
were very conscious that common commissioning issues such as foaming or odour could
have significant reputational damages for QLDC, especially coming in to what was peak
tourism season. To manage the risks in this regard sewage was introduced very slowly, at
a fixed volume per day, and the levels kept low. This allowed any foaming to be kept within
the tank, without risk of being picked up by the wind. The sewage was well aerated at all
times which prevented odours.

Over time the level within the tank was steadily increased until all the facilities could be
brought into action i.e. mixers and A-recycle pump. At around day 30, sludge wasting was
commenced through the centrifuge. Discharge from the clarifier was closely monitored and
initially returned to the pond process prior to disposal. As the volumes increased return of
the effluent to the pond was no longer possible and the effluent was passed, following UV
treatment, to disposal. The MLE effluent at this time was equivalent, or better in quality to
the pond effluent. Initially the pond effluent was maintained through the existing outlet,
without UV treatment, this continued until the MLE effluent was within the desired quality
range. At this time the pond pump station was commissioned and the blend control
configured.

The blend proportion was gradually increased until the desired flow split (63% MLE to 37%
pond effluent) was achieved. During this time the key parameters were monitored to
ensure the required disinfection requirements were complied with.

An identified risk leading into this aspect of the plant commissioning was the potential
ultraviolet transmittance (UVT) of the blended stream. The design had been based around
an average of 40% and on site trials during the construction phase indicated this may be
difficult to achieve. To date this has not been a problem.

8.2    PERFORMANCE TO DATE
Table 5 in Section 4 summarised the plant’s performance over the first year of operation.
From this information it is evident that the new plant is performing well, with the effluent
quality within the required consent limits, and that a 2 train MLE will be able to meet Stage
3 effluent quality requirements.

However, a challenge that has arisen relates to the performance of the original pond
system. The design assumed an improvement in the performance of the pond process with
regard to Total Nitrogen (TN) removal as a result of the reduced loading (approximately a
two third reduction). In reality, whilst the pond performance has improved due to the
reduction in load (as measured by BOD5 and TSS in the effluent), the pond system is not
achieving a notable reduction in TN. To offset the poorer than anticipated pond
performance in regard to TN it has been necessary to treat more of the incoming sewage
through the MLE plant than was the design intention.

At the completion of the first year of operation the influent flow split was sitting at
approximately 70%, as compared with the design of 63% (a 10% increase in flow to MLE).

This issue combined with rapid growth in the Wakatipu basin is putting pressure on the
mass load of TN into the river. The trigger point for the subsequent upgrade is exceeding
a discharge of 200kg/day. At the end of the first year of operation the plant was discharging
an average of 192kg/day.
9       LESSONS LEARNED
9.1       LEARNING FROM PROJECT PURE
Project Pure (P.Pure), a new wastewater treatment serving Wanaka, was the predecessor
to Project Shotover. There were a number of failings with the project which lead to a
difficult outcome for Council. There was therefore considerable nervousness within Council
over a similar but larger undertaking at Shotover. Nervousness at both the project size
and procurement method. Nevertheless, based on observations of other successful DB /
DBO projects around the country, QLDC did decide to proceed with Shotover as a single
design and build contract.

Key learnings from P.Pure, which were carried forward to development of the P.Shotover
procurement process were as follows:

•    The Employer’s requirements needing to be more prescriptive, while allowing for the
     generalised nature of the approach to process selection. For example, “If you wish
     to use this equipment, these are the minimum acceptable requirements for such
     equipment”. Another example is having the contractual effluent quality
     requirements slightly more stringent than the discharge consent conditions in case
     there are misinterpretations of the statistical compliance meanings.
•    Invest in good quality influent characterisation data. By all means provide a
     summary of that data but require that Proposers interrogate the full data sets for
     issues such as seasonality and legitimate ‘outliers’
•    Use of purpose written Design and Build Conditions of Contract rather than relying
     on a rewrite of NZS3910.
These learnings were necessary to reduce the risk to Council of an overall project failure
while also providing the opportunity to more equitably apportion key individual risks as
described in section 9.2 below.

9.2       TREATMENT OF KEY RISKS
A comprehensive risk register was developed at the start of the Project Shotover
procurement process and maintained and update all the way through the project.

The following table provides a very brief description of how key implementation risks were
addressed in Project Shotover. The team attempted to assign these mitigation strategies
and risk assignments on the basis of the party best able to manage the risk. All too often
it seems contractors are required to cover the risk of circumstances over which they have
no control or ability to mitigate (through investigation or other means). The result is that
the owner pays a significantly higher (than necessary) price for the works.       The risk
assignments are presented here in the context of a design and Build procurement model.

         Risk                              Risk Allocation & Comments
    Influent beyond    Employer: This is an issue over which the Contractor has no control.
    limits in          Part of the mitigation is to ‘require’ that contractor builds in additional
    Employer’s         capacity. Part of it is for the Employer to maintain an appropriate
    Requirements       contingency fund and for a master plan that provides for expansion.
    Effluent Quality   Contractor: While the influent flows and loads remain within prescribed
                       limits, it is the D&C contractor who has control over this. Facility needs
                       to be provided so that if the influent flows and loads venture outside
                       the required limits, there is a mechanism for calculating fair
                       reparations, rather than this being a one sided, carte blanche process.
You can also read