Promoting Healthy Smiles through Education & Prevention
←
→
Page content transcription
If your browser does not render page correctly, please read the page content below
Promoting Healthy Smiles through Education & Prevention
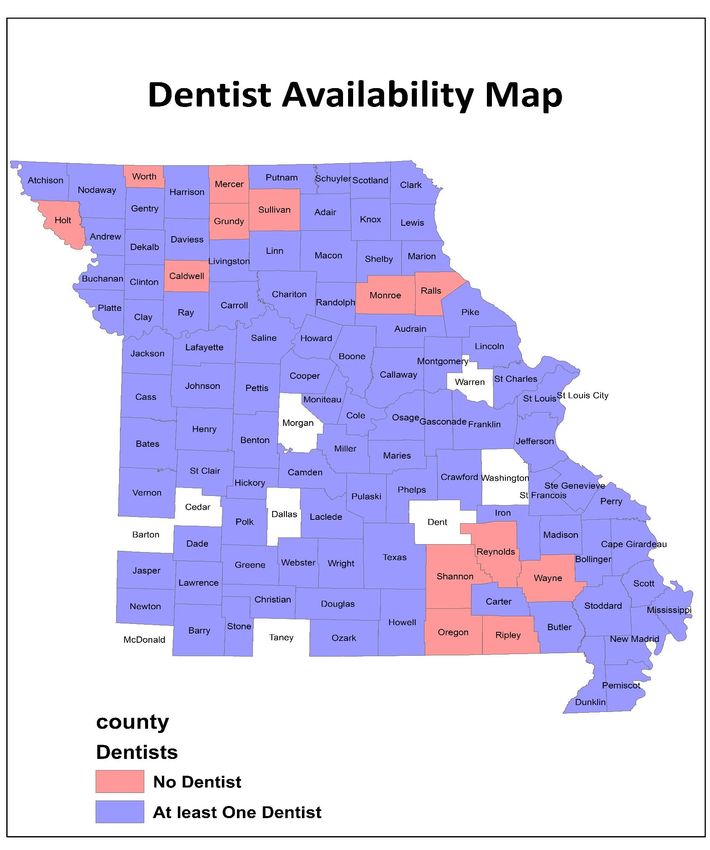
Table of Contents
What is PSP? .......................................................................................................................................................... 3
Why is Oral Health Important? ............................................................................................................................... 5
Demographics of PSP Participants .......................................................................................................................... 7
Oral Hygiene of PSP Participants .......................................................................................................................... 13
Sealants of PSP Participants.................................................................................................................................. 16
Treated Decay of PSP Participants......................................................................................................................... 18
Treatment Urgency for PSP Participants ............................................................................................................... 26
Caries for PSP Participants ................................................................................................................................... 27
Early Childhood Caries for PSP Participants ..........................................................................................................30
White Spot Lesions of PSP Participants ................................................................................................................. 33
Conclusion ........................................................................................................................................................... 37
Glossary ............................................................................................................................................................... 38
References............................................................................................................................................................ 39
Appendix............................................................................................................................................................. 40
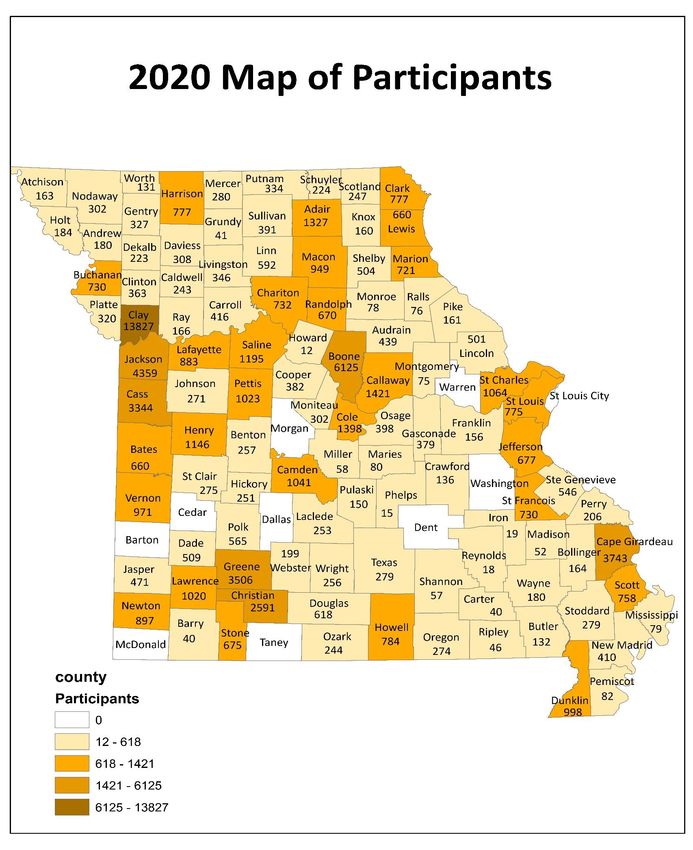
What is PSP? An Oral Health Program administered through the Missouri Department of Health and Senior Services/Office of Dental Health. The Preventive Services Program (PSP) is dedicated to promoting and improving healthy smiles for all Missouri children through education and preventive services. The program goal is to assess Missouri children’s oral health status while implementing a public health intervention designed to dramatically reduce tooth decay. The program uses community involvement to implement evidence -based prevention strategies to improve oral health outcomes for school-age children. Community-wide support is essential to the implementation and success of the program. The Missouri Oral Health Preventive Services Program (PSP) was created by the Missouri Department of Healt h and Senior Services (DHSS) to help children with various oral health needs. The program is operated under the guidance of the State Dental Director, and carried out by the Office of Dental Health. The program is coordinated with five regional oral health program consultants, all of whom are Registered Dental Hygienists. The consultants support their regions by promoting oral health care at: daycares, schools, head start centers, preschools, health clinics, and other settings where children are present. The consultants facilitate the ordering of PSP supplies for events, all of which are funded through the Office of Dental Health, including: Technical Assistance Offering DHSS Educational Materials Providing Oral Health Supplies (Toothbrushes, Floss, Toothpaste) Providing Oral Health Screening Supplies (Disposable Mouth Mirrors and Screening Forms) Fluoride Varnish Online Calibration for Licensed Dental Professionals Who Conduct Oral Screenings, and Online Training for Parents and Volunteers Who Apply Fluoride Varnish One of the main reasons for PSP’s success is the community-based aspect. If it were not for the engagement and interest from the school nurses and others promoting the program, this program may not have the level of success it has gained over the last few years. Local volunteers include dentists and hygienists who provide the screenings and other volunteers who apply the fluoride varnish.
Figure 1:2020 Map of PSP Participants

Why is Oral Health Important?
Oral Health Care is a growing concern in the United States for several reasons. Chronic oral health problems can
be precursors to more serious heart and lung diseases, they can be symptoms of serious viral infections such as
HIV and Herpes, and they can also cause more serious health issues such as severe bacterial infections.
The Oral Health in America: A Report of the Surgeon General defined a four-pronged approach to combating oral
health issues in America:
1. Oral health means much more than a healthy teeth;
2. Oral health is integral to general health;
3. Safe and effective disease prevention measures exist that everyone can adopt to improve oral health and
prevent disease;
4. General health risk factors, such as tobacco use and poor dietary practices, also affect oral and craniofacial
health.1
Since the Missouri Preventive Services Program (PSP) focuses on children, this report will focus on how oral health
impacts children only. Studies have shown that children with dental pain and poor oral health often miss school and
have difficulties with speaking, eating, and learning.1 More than 51 million school hours are lost each year due to
children having a dental-related illness.1 Even more concerning, children aged 5-17 years old are 5 times more
likely to have had at least one cavity or filling than a reported history of asthma.1
51.6% of children ages 5-9 have had at least one cavity or filling in the coronal (crown of the tooth) portion
of their primary or permanent teeth. 1
77.9% of 17 years old have had at least one cavity or filling in the coronal (crown of the tooth) portion of
their primary or permanent teeth. 1
84.7% of individuals ages 18 and older have had at least one cavity or filling in the coronal (crown of the
tooth) portion of their primary or permanent teeth. 1
There were a total of 79,869 participants in the Preventive Services Program (PSP) for the 2019-2020 school year.

Figure 2: Total PSP Participants by School Year
Demographics of PSP Participants

PSP events are mostly held in school settings. Due to the timing of these events being held during the school year
months, it is easier to categorize children based on their school type rather than their specific grade level.

Figure 3: PSP Participants by Grade Category

                               Middle School, 9.40%
                                                      High School, 2.79%
                                                                           Preschool, 10.06%
               Not Specified, 0.24%
                                                                                          Kindergarten, 13.90%

                          Elementary School, 63.61%

Similar to previous years, the bulk of students seen are Elementary School aged students.

Table 1: Total Number of PSP Participants by Grade Level

Preschool Kindergarten                Elementary School             Middle School              High School       Not Specified

 8034          11102                  50807                         7507                       2230              189
PSP Participants by Gender

There were 1,677 more male students than female participants. While the major split comprises female and male
participants, an additional category of ‘Gender Not Specified’ is noticed in the data sets. There were 180
participants whose gender was not specified which are 0.23% of the total number of PSP participants.

Figure 4: PSP Participants by Gender

                                                                                                Male, 50.94%

         Female, 48.84%

                                                Gender Not Specified,
                                                       0.23%

                                       Female     Male      Gender Not Specified

Table 2: PSP Participants by Gender

 Gender                                   Number                                   Percentage
 Female                                   39006                                    48.84%
 Male                                     40683                                    50.94%
 Not Specified                            180                                      0.23%
Table 3: PSP Participants by Age Group
Female Male Gender Not Specified Total Number
Age Classification Number Percentage Number Percentage Number Percentage
0-5 years old 7806 9.77% 8367 10.48% 29 0.04% 16202
13years and older 2091 2.62% 2298 2.88% 8 0.01% 4397
6-12 years old 29059 36.38% 29968 37.52% 121 0.15% 59148
Age Not Specified 50 0.06% 50 0.06% 22 0.03% 122
Grand Total 39006 48.84% 40683 50.94% 180 0.23% 79869
Figure 5: Age Group by Gender
The highest number of participants among both genders can be seen under the ‘6-12 years old’ age group category,
followed by ‘0-5 years’ and ‘13 years and older’ category respectively. Section ‘Gender Not Specified’ shows data
for which gender is not stated based on the data collected but the age group division can be see n, as stated in the
graph above.Table 4: PSP Participants by Race/Ethnicity Totals African-American Asian or Pacific Islander Hispanic White Others Not Specified Grand Total 6031 1213 3351 64824 3845 605 79869 Figure 6: PSP Participants by Race/Ethnicity A majority of participants were identified as ‘White’. The Category named ‘Others’ includes all the categories that the screeners have identified as ‘Unknown Non-White’, ‘American Indian’, and “Multi-Racial”. Table 5: Geographic Distribution of PSP Participants Rural Vs Urban Number of Participants Percentage of Rural Vs Urban Rural 36042 45.13% Urban 43827 54.87% Grand Total 79869 100.00% Out of 115 counties in Missouri, students were screened from 105 of them. Ninety of the m are designated as rural counties and fifteen are designated as urban counties. There are 9.74% more PSP participants in urban counties than rural ones.
Figure 7: Geographic Distribution of PSP Participants

     60.00%
                                                                               54.87%

     50.00%
                                 45.13%

     40.00%

     30.00%

     20.00%

     10.00%

      0.00%
                                  Rural                                        Urban

Geographic distribution accounts more for urban than for rural participants amongst the total participants.
Figure 8: PSP Participants by Number of Dentists
97.50%
2.50%
At least 1 Dentist No Dentist
Table 6: PSP Participants by Number of Dentists
Number of Dentists Number of Participants
At least 1 Dentist 77870
No Dentist 1999
Grand Total 79869
The percentage of PSP participants which has at least 1 dentist in the county accounts for 97.50% (77,870) of the
overall PSP participants and 2.50% (1,999) of participants have no dentists in their county.Oral Hygiene of PSP Participants Poor oral hygiene is defined by moderate to heavy plaque on the teeth with red gums and tissue. Males in the 6- 12 years age group have the highest percentage of unsatisfactory oral hygiene than females of any age group. Females falling under 6-12 years of age group are the ones that hold the highest percentage of satisfactory hygiene. Figure 9: Oral Hygiene by Age Group and Gender
Figure 10: Poor Oral Hygiene by Race/Ethnicity

The highest percent of poor oral hygiene was detected in children whose race was marked as ‘White’. The second
highest group was children marked as ‘African-American’.

Figure 11: Oral Hygiene by Geography

             Satisfactory                                                                            41.86%
 Urban

         Not Satisfactory                        13.09%

             Satisfactory                                                                35.85%
 Rural

         Not Satisfactory              9.21%

Urban children had a higher percentage of children with poor oral hygiene (13.09%) compared to rural children
(9.21%). At the same time, urban children had a higher rate of good oral hygiene (41.86%) compared to urban
children (35.85%).
Figure 12: Oral Hygiene by Number of Dentists
Satisfactory 75.65%
At least 1 Dentist
Not Satisfactory 21.86%
Satisfactory 2.05%
No Dentist
Not Satisfactory 0.44%
Children who lived in a county with at least one dentist had a higher rate of poor oral hygiene (21.86%) than
children in counties with no dentist (0.44%).Sealants of PSP Participants Dental sealants are clear plastic coatings that are applied to the chewing surface of permanent molars to help prevent cavities. Once a permanent molar erupts, it is best to have a dental staff member apply sealants as soon as possible. Typically, around the age of 7 is when the first permanent molar will erupt, and age 10 is when the second permanent molar erupts. Figure 13: Dental Sealants by Gender and Age The number of children screened that did not have dental sealants were more than those that have sealants. However, among those that had sealants, females ages 6-12 years old were more likely to have had their teeth sealed than males of the same age group. A percentage of 20.15 of both the genders falling under 0-5 years of age group that have sealants (0.41%) and do not have sealants (19.74%) are removed from the visualization above as our surveillance forms only ask for sealants on permanent molars.
Figure 14: Dental Sealants by Race/ Ethnicity

White children had the highest percentage of dental sealants, and Asian or Pacific Islanders children had the
lowest amongst the ones for which we had data for the Race/Ethnicity.

Figure 15: Dental Sealants by Geography

Children in urban counties were 3.07% more likely to have dental sealants than those in rural ones.
Figure 16: Dental Sealants by Number of Dentists

                                       19.63%
    At least 1 Dentist
                                                                                                 77.87%

                         0.32%
          No Dentist
                          2.18%

                                                Sealants   No Sealants

Children who resided in counties with at least 1 dentist had a higher percent of sealants present compared with
children who resided in counties with no dentist.
Treated Decay of PSP Participants
Treated tooth decay is determined by the presence of any type of filling in a tooth (either primary or permanent),
or missing tooth due to decay observed during the screening. Primary teeth are more colloquially referred to as
baby teeth.
Table 7: Treated Decay by Gender and Tooth Type
Female Male Gender Not Specified Total
Treated Decay Number Percentage Number Percentage Number Percentage Percentage
No Decay 26646 33.36% 27265 34.14% 112 0.14% 67.64%
Permanent Only 1758 2.20% 1568 1.96% 7 0.01% 4.17%
Primary and Permanent 1576 1.97% 1646 2.06% 8 0.01% 4.04%
Primary Only 8957 11.22% 10130 12.68% 40 0.05% 23.95%
Not Specified 69 0.09% 74 0.09% 8 0.01% 0.19%
Grand Total 39006 48.84% 40683 50.94% 175 0.22% 100.00%
Figure 17: Treated Decay by Gender and Age Group
Males of age 6-12-year-olds had the highest percentage of total treated decay followed by males from 0-5 years
of age group.Table 8: Treated Decay by Gender and Age Group
African- Asian or Pacific
American Islander Hispanic Others White
Treated Decay # % # % # % # % # %
No Decay 4305 5.40% 716 0.90% 2102 0.48% 2582 3.24% 43939 55.12%
Permanent Only 264 0.33% 45 0.06% 157 0.03% 127 0.16% 2718 3.41%
Primary and
Permanent 199 0.25% 51 0.06% 161 0.03% 167 0.21% 2625 3.29%
Primary Only 1254 1.57% 400 0.50% 927 0.19% 965 1.21% 15429 19.36%
Grand Total 6022 7.55% 1212 1.52% 3347 0.73% 3841 4.82% 64711 81.18%
Figure 18: Treated Decay by Race/Ethnicity
Overall, children identified as ‘Asian or Pacific Islander’ had the lowest percent of treated decay. Children
identified as ‘White’ had the highest percent of treated decay followed by ‘African American’.Figure 19: Treated Decay by Geography
37.89%
29.88%
17.00%
15.22%
Rural Urban
Decay No Decay
As seen on the graph above, urban children have a 17.00% decay rates, and rural children have a 15.22% decay
rate. Therefore, urban counties have more percentage of treated decay than rural counties.
Figure 20: Treated Decay by Number of Dentists
No Decay 66.16%
At least 1 Dentist
Decay 31.34%
No Decay 1.61%
No Dentist
Decay 0.88%
Counties that have at least one dentist have participants with higher rates of treated decay than counties that
have no dentist.Untreated Decay of PSP Participants
Untreated decay is determined during the oral screening when obvious decay is noted with a flashlight and
disposable mouth mirror. Decay is caused by plaque, a sticky substance that forms on the teeth which causes a
breakdown in the tooth’s enamel and eventually leads to cavities also called decay, and can be found on primary
or permanent teeth.2
Table 9: Untreated Decay by Gender and Tooth Type
Female Male
Untreated Decay Number Percentage Number Percentage
No Untreated Decay 30875 38.80% 32017 40.23%
Permanent Only 1598 2.01% 1425 1.79%
Primary and Permanent 1020 1.28% 1067 1.34%
Primary Only 5458 6.86% 6117 7.69%
Grand Total 38951 48.95% 40626 51.05%
Male children had slightly higher rates of untreated decay on primary teeth and primary and permanent teeth.
Untreated decay on permanent only is higher among female participants.Figure 21: Untreated Decay by Gender and Age Group
Teenagers had the lowest amount of untreated decay, with females slightly better than males. 6-12-year-old
males and females had the highest percent of untreated decay. Males have more untreated decay than female
children.
Table 10: Untreated decay by Race/Ethnicity and Tooth Type
by
African- Asian or Pacific
American Islander Hispanic White Others
Treated Decay # % # % # % # % # %
No Untreated Decay 5.60% 4464 1.14% 912 3.04% 2428 64.99% 51828 3.71% 2957
Permanent Only 0.48% 381 0.08% 64 0.20% 158 2.84% 2261 0.17% 139
Primary and
Permanent 0.32% 257 0.04% 35 0.17% 135 1.92% 1528 0.15% 117
Primary Only 1.16% 923 0.25% 200 0.79% 629 11.45% 9127 0.79% 627
Grand Total 7.56% 6025 1.52% 1211 4.20% 3350 81.19% 64744 4.82% 3840Figure 22: Untreated Decay by Race/Ethnicity
64.99%
White
16.20%
5.60%
African-American
1.96%
1.14%
Asian or Pacific Islander
0.37%
3.04%
Hispanic
1.16%
3.71%
Others
1.11%
0.52%
Not Specified
0.20%
No Untreated Decay Decay
Overall, children identified as ‘Asian/Pacific Islander’ had the lowest percent of untreated decay. Children
identified as ‘White’ had the highest percent of untreated decay for primary only tooth and permanent only tooth.
Also, ‘White’ children have the highest untreated decay for primary and permanent teeth.Figure 23: Untreated Decay by Geography
44.36%
Urban
10.55%
34.65%
Rural
10.44%
No Untreated Decay Decay
Table 11: Total Number of Untreated decay by Geography and Tooth Type
Number of Untreated Percentage of Untreated
Rural Vs Urban Untreated Decay Decay Decay
Rural No Untreated Decay 27634 34.65%
Permanent Only 1413 1.77%
Primary and Permanent 945 1.19%
Primary Only 5966 7.48%
Urban No Untreated Decay 35371 44.36%
Permanent Only 1627 2.04%
Primary and Permanent 1150 1.44%
Primary Only 5638 7.07%
Grand Total 79744 100.00%
Urban untreated decay accounts to be slightly more than rural decay.Figure 24: Untreated Decay by Number of Dentists
77.25%
At least 1 Dentist
20.25%
1.76%
No Dentist
0.74%
No Untreated Decay Decay
Children who live in a county with at least 1 dentist have a higher percentage of decay than the children who live
in counties with no dentists.Treatment Urgency for PSP Participants One of the biggest services PSP offers is that parents and guardians are informed when an unmet dental need is identified during screening. If a problem is detected, PSP organizers will provide referrals to local dental offices or clinics so the child can receive proper follow-up. There are two classifications for the need of treatment; early dental care and urgent dental care. Early dental care is recommended for injuries or conditions that need to be addressed within the coming months. Urgent dental care is recommended for injuries or conditions that need to be addressed immediately and are typically recommended they be remedied within the next 24 hours. Figure 25: Treatment Urgency by Age Group
Table 12: Treatment Urgency by Gender and Age Group

                                                          Female                  Male
 Age Classification              Treatment Urgency        Number      Percentage  Number     Percentage
 0-5 years old                   No Obvious Problem              6143       7.78%       6478       8.21%
                                 Early Dental Care               1293       1.64%       1439       1.82%
                                 Urgent Care                      227       0.29%        297       0.38%
 13 years and older              No Obvious Problem              1723       2.18%       1890       2.39%
                                 Early Dental Care                307       0.39%        342       0.43%
                                 Urgent Care                       52       0.07%         61       0.08%
 6-12 years old                  No Obvious Problem            22845       28.95%      23477      29.75%
                                 Early Dental Care               5052       6.40%       5309       6.73%
                                 Urgent Care                      986       1.25%        994       1.26%
 Grand Total                                                   38628       48.95%      40287      51.05%

Male Children Ages 6-12 years had the most referrals for early dental care. Male children ages 6-12 years had the
most referrals for urgent care. Teenage girls had the lowest number of referrals for dental care among all age
groups for both genders.
Figure 26: Treatment Urgency by Race/Ethnicity Table 13: Treatment Urgency by Race/Ethnicity Treatment Urgency African-American Asian or Pacific Islander Hispanic Not Specified Others White Grand Total No Obvious Problem 5.60% 1.15% 3.08% 0.50% 3.71% 65.19% 79.22% Early Dental Care 1.66% 0.29% 0.90% 0.15% 0.94% 13.51% 17.45% Urgent Care 0.31% 0.09% 0.24% 0.04% 0.16% 2.49% 3.32% Grand Total 7.57% 1.53% 4.21% 0.69% 4.81% 81.19% 100.00% White children had the highest percentage of students needing early dental care. At the same time, White students had the highest percentage of students needing urgent care. Overall, Asian or Pacific Islander students had the lowest percentage for any treatment urgency.
Figure 27: Treatment Urgency by Geography

Children living in rural counties have a higher percentage of ‘Urgent Care’ than children in urban counties.
Children living in urban counties have a higher percentage of ‘Early Dental Care’ than children in rural counties.

Figure 28: Treatment Urgency by Number of Dentist

Children living in counties with at least one dentist have higher rates for treatment urgency referrals than those
residing in counties with no dentists.
Caries for PSP Participants

Dental Caries is one of the most common childhood diseases. Caries is the Latin word for “rotten.” 1
Caries is just a more technical term for a cavity. A cavity is a late manifestation of a bacterial infection.1

A cavity is the result of plaque-forming over a tooth and dissolving the enamel. Plaque occurs when
bacteria form a gelatinous film that adheres to the tooth’s surface. 1 When plaque is considered
cariogenic (causing decay) a single site on a tooth could have close to half a billion bacteria living there,
including Streptococcal mutans. 1 Once these bacteria are on the tooth, they begin to ferment sugars
and carbohydrates that form lactic and other acids that lead to the eventual erosion of the enamel
covering the tooth. 1 Once that protective enamel layer is gone, the tooth begins to decay from bacterial
infection.

Rampant caries- Decay, restoration, or missing teeth due to decay on 7 or more teeth.

Figure 29: Rampant Caries by Age/Group

Males of group 6-12 years of age had the highest rate of rampant caries. Females ages 13 years and older
had the lowest rate of rampant caries.
Table 14: Rampant Caries by Gender and Age Group

 Rampant Caries                         0-5 years old      6-12 years old      13 years and older   Not Specified

 Female                                            9.20%              35.55%                0.93%              0.11%

 Male                                             11.26%              41.68%                1.04%              0.08%

Figure 30: Rampant Caries by Geography

Children in urban counties have a slightly higher percent of rampant caries than children in rural counties.
Figure 31: Rampant Caries by Race/Ethnicity

Children who were identified as ‘White’ had the highest rate of rampant caries and early childhood caries. Children
who were identified as ‘Asian or Pacific Islander’ had the lowest early childhood caries and lowest rampant caries.

Figure 32: Rampant Caries by Number of Dentist

Children in counties with at least 1 dentist had higher percentages of rampant caries and early childhood caries.
Early Childhood Caries for PSP Participants

Decay, or history of decay on at least one primary maxillary anterior tooth. Includes decay, restoration, and
missing teeth due to decay.

Figure 33: Early Childhood Caries by Age Group/Gender

Table 15: Early Childhood Caries by Age Group and Gender

                                                       0-5 years old
 Gender                       Early Childhood Caries   Number                        Percentage
 Female                       No                                              6500                        43.67%
                              Yes                                              648                         4.35%
 Male                         No                                              6911                        46.43%
                              Yes                                              766                         5.15%

Males aged 0-5 years old had the highest percent of childhood caries while the female had the lowest childhood
caries.
Figure 34: Early Childhood Caries by Geography Children in rural counties have a slightly higher percentage of early childhood caries than children in urban counties. Figure 35: Early Childhood Caries by Race/Ethnicity
Figure 36: Early Childhood Caries by Number of Dentist
White Spot Lesions of PSP Participants

White spot lesions are the first signs of decay in children under the age of 5 on at least one primary maxillary
anterior tooth. White spots appear pale and chalky just around the gum line. 3 While white spots are a sign of
decay, they are reversible. When treated with fluoride early enough, the enamel can strengthen and help fight
off the decay. If fluoride isn’t applied, the spots will continue to decay and turn yellow or brown. 3

Figure 37: White Spot Lesions by Gender
Figure 38: White Spot Lesions by Race

Children identified as ‘White’ had the highest percentage of white spot lesions, and children identified as
‘Asian or Pacific Islander’ had the lowest percentage of white spot lesions.
Figure 39: White Spot Lesions by Geography

Children in urban counties had a higher percentage of white spot lesions than children in rural counties.
Figure 40: White Spot Lesions by Number of Dentist

Children residing in counties with at least one dentist had a higher percentage of white spot lesions compared
with those who resided in counties with no dentist.
Conclusion

The 2019-2020 school year had a 12.6% decrease in students participating in PSP in comparison to the previous
year due to the COVID-19 pandemic. Schools were shut down starting March 2020 making it impossible to hold
PSP events after that time.

Preventive Factors:

77.46% of the children that participated in PSP events had what was conside red good oral hygiene. Males and
females of 6-12 age group, and those marked as ‘Whites’ had the highest frequency of poor oral hygiene.

Dental sealants were found on 17.84% of children screened ages 6-12 year age group. ‘Asian or Pacific Islander’
children were the least to have dental sealants while ‘Whites’ have the most because of lesser number of ‘Asian
or Pacific Islander’ participants.

Tooth Decay:

67.43% of screened students had no treated decay, and 78.67% had no untreated decay. Children of ‘White’
races had highest signs of treated and untreated decay.

Rampant caries were seen in 9.05% of screened students. Children identified as ‘Asian or Pacific Islanders’ had
the lowest percent of rampant caries. Children identified as ‘Whites’ had the highest percent of rampant caries
because of lesser number of ‘Asian or Pacific Islander’ participants.

Treatment Urgency:

20.59% of students screened were identified as needing early or urgent dental care. These students were sent
home with a notification to their parent/guardian about the issue. Urgent dental care was required most in
female children ages 6-12 years old.

White Spot Lesions:

White spot lesions were found in approximately 15.6% of screened children under the age of 5 years. White spot
lesions were observed more in children whose race was marked as ‘White’.

Early Childhood Caries:
Males aged 0-5 years old that have ‘Early Childhood Caries’ had the highest percent (5.15%) of childhood caries
while the females had the lowest childhood caries (4.35%).
Glossary

Caries: Technical term for cavity.

Decay: The breakdown of the enamel surface or staining in pits or fissures of primary or baby
molars. 6

Dental Sealants: Clear plastic coating that is applied to the chewing surface of
permanent molars that help prevent cavities.

History of Decay: The presence of decay and/or filled teeth. 6

Poor Oral Hygiene: Moderate to heavy plaque on teeth with red gums and tissue.

Rampant Caries: Suddenly appearing, widespread, rapid burrowing types of caries that result
in early pulp involvement in 7 or more teeth. 7

Treated Decay: Defined as having a dental filling, crown, or a tooth extracted because of decay .

Untreated Decay: Defined as having dental cavities/tooth decay that have not received
appropriate treatment.

Early Dental Care: A child who needs care within the next few weeks.

Urgent Care: A child who needs care within the next 24-48 hours due to pain or an infection.

White Spot Lesions: First signs of decay in children under the age of five whose primary
maxillary anterior teeth appear pale and chalky around the gum line. 7

Early Childhood Caries: Decay, or history of decay, on at least one primary maxillary anterior
tooth. Includes decay, restoration, and missing teeth due to decay.
References

1. U.S. Department of Health and Human Services, Oral Health in America: A Report of the Surgeon General,
2000.
Retrieved from https://www.nidcr.nih.gov/sites/default/files/2017- 10/hck1ocv.%40www.surgeon.fullrpt.pdf

2. American Dental Association. (2017). Decay. Retrieved September 28,                  2017,   from http://
www.mouthhealthy.org/en /az-topics/d/decay

3. Freeman, A. (2015, October 23). What Causes White Spots on Baby Teeth? Retrieved September 29, 2017,
from http://www.colgate.com/en/us/oc/oral-health/life- stages/infant-oral-care/article/what- causes-white-
spots-on-baby-teeth-1015

4. Centers for Disease Control and Prevention. (2019). Community Water Fluoridation. Water Fluoridation
Basics. Retrieved from https://www.cdc.gov/fluoridation/basics/index.htm

5. American Dental Association. (2019). 5 Reasons Why Fluoride in Water is Good for Communities. Retrieved
from https://www.ada.org/en/public- programs/advocating-for-the-public/%20fluoride-and-fluoridation/5-
reasons-why- fluoride-in-water-is-good-for-communities

6. Iowa Department of Public Health. Bureau of Oral and Health Delivery System. 2019 WIC Oral Health Survey
Report. Des Moines: Iowa Dept. of Public Health, 2019. Web. https://idph.iowa.gov/ohds/oral-health-
center/reports.

7. Varghese S, Bhat V, Devi LS. Adult rampant caries: A clinical report. Indian J Oral Sci [serial online] 2016
[cited 2019 Dec 13]; 7:42-6. Available from: http:// www.indjos.com/text.asp?2016/7/1/42/176388
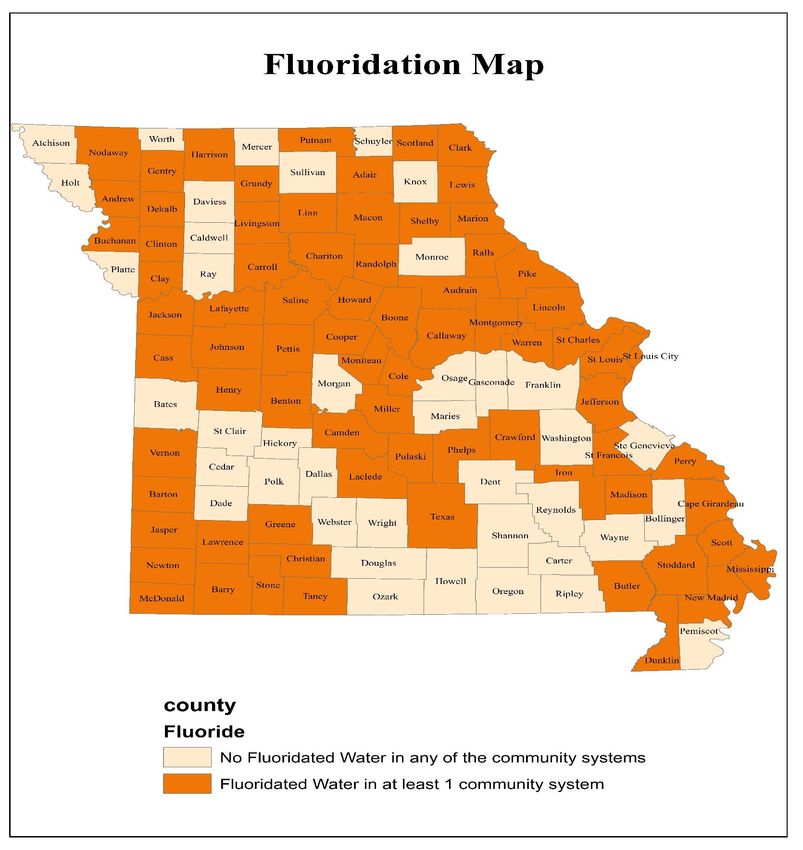
Appendix

Figure 41: Fluoridation Map
Figure 42: Dentist Availability Map

Note: We don’t have any data available for the counties that are represented in ‘White’.
You can also read