PROSPERITY AND JUSTICE AFTER THE PANDEMIC - George Dibb, Carsten Jung, Henry Parkes and Shreya Nanda - IPPR
←
→
Page content transcription
If your browser does not render page correctly, please read the page content below
The Centre for Economic Justice

   PROSPERITY AND
   JUSTICE AFTER
   THE PANDEMIC

                                      George Dibb,
                                     Carsten Jung,
                                  Henry Parkes and
                                     Shreya Nanda
                                     September 2021
2
CONTENTS

Summary...........................................................................................................................6
Introduction: Shifting power to build a new economy.........................................8
1. To employees and workers from employers and shareholders...................16
2. To companies that work in the interest of society from those
   that extract from society.......................................................................................24
3. To those who are locked out of wealth from a system that has
   locked up wealth......................................................................................................34
4. To nations, regions and towns of the UK from Whitehall..............................42
References.................................................................................................................... 50

                                                                                                                                      3
THE IPPR CENTRE FOR ECONOMIC JUSTICE
The Centre for Economic Justice at IPPR is our ambitious initiative to
provide the progressive and practical ideas for fundamental reform
of the economy. We want an economy where prosperity and justice
go hand in hand.
The Centre for Economic Justice is carrying forward the work of the
acclaimed IPPR Commission on Economic Justice, producing rigorous
research to show how the commission’s ten-part plan for the economy
can be put into practice.
www.ippr.org/cej
ABOUT IPPR
IPPR, the Institute for Public Policy Research, is the UK’s leading
progressive think tank. We are an independent charitable organisation
with our main office in London. IPPR North, IPPR’s dedicated think tank
for the north of England, operates out of offices in Manchester and
Newcastle, and IPPR Scotland, our dedicated think tank for Scotland,
is based in Edinburgh.
Our primary purpose is to conduct and promote research into, and the
education of the public in, the economic, social and political sciences,
science and technology, the voluntary sector and social enterprise,
public services, and industry and commerce. Other purposes include
to advance physical and mental health, the efficiency of public services
and environmental protection or improvement; and to relieve poverty,
unemployment, or those in need by reason of youth, age, ill-health,
disability, financial hardship, or other disadvantage.
IPPR, 14 Buckingham Street, London, WC2N 6DF
T: +44 (0)20 7470 6100
E: info@ippr.org
www.ippr.org
Registered charity no: 800065 (England and Wales),
4ABOUT THE AUTHORS
George Dibb is head of the Centre for Economic Justice at IPPR.
Carsten Jung is a senior economist at IPPR.
Henry Parkes is a senior economist at IPPR.
Shreya Nanda is an economist at IPPR.
ACKNOWLEDGEMENTS
We are extremely grateful to our colleagues and external experts who have
supported this work or shared their time and expertise. In particular we would
like to thank Finlay Collings, Carys Roberts, Harry Quilter-Pinner, Russell Gunson,
Marley Morris, Clare McNeil, Luke Murphy, David Wastell, Rachel Statham, Marcus
Johns, Jonny Webb, Chris Thomas, Rosie Lockwood, Nicky Hawkins, Trevor Chinn,
Michael Jacobs, Robert Palmer, Christine Berry, Laurie Macfarlane, Nick Shaxson,
and Michelle Meagher. We’d like to thank Abi Hynes and Richard Maclean for their
work in designing and producing this publication.
Download
This document is available to download as a free PDF and in other formats at:
http://www.ippr.org/research/publications/prosperity-and-justice-after-the-pandemic
Citation
If you are using this document in your own writing, our preferred citation is:
Dibb G, Jung C, Parkes H and Nanda S (2021) Prosperity and justice after the pandemic, IPPR.
http://www.ippr.org/research/publications/prosperity-and-justice-after-the-pandemic
Permission to share
This document is published under a creative commons licence:
Attribution-NonCommercial-NoDerivs 2.0 UK
http://creativecommons.org/licenses/by-nc-nd/2.0/uk/
For commercial use, please contact info@ippr.org
5SUMMARY
‘BUILDING BACK BETTER’: A NEW ECONOMIC CONSENSUS
Covid-19 has exacerbated many of the existing challenges facing the UK economy
- but it has also created an opportunity to ‘build back better’. The pandemic has
brutally highlighted the structural weaknesses and injustices within our society.
Whilst small businesses have faced closure, the big six tech firms added more than
$4 trillion to their market value. Those on the lowest wages were most likely to
lose their job or be furloughed, yet more billionaires were created this year than
ever before. As a result, people across the country are clear about their desire, as
we emerge from the crisis, to ‘build back better’. Only 6 per cent of the population
want to return to the ‘pre-pandemic’ economy, whilst 58 per cent want to see
‘changes in the way the economy is run’.
‘Building back better’ after the pandemic must mean creating an economy that
delivers both prosperity and justice for all citizens. We envision a future better
than the past: a society where everyone is able to lead a fulfilling life. Delivering
on this vision after the pandemic must mean more than just delivering increases in
economic growth. Instead, we must broaden our definition of prosperity to take into
account of all of the dimensions of a ‘good life’. In recent months IPPR has hosted
a series of citizens’ juries across the country. We asked people what a ‘good life’
meant to them. They spoke of fundamental goods like health, security, connection
to others, access to nature and feeling in control of their own lives. This is what we
must prioritise – for all people and places – as we emerge from the pandemic.
A new consensus on economic policy is beginning to emerge with the government
embracing unprecedented stimulus measures during the crisis. Achieving this shift in
the lives of people across the UK will require a fundamental shift in economic policy.
We must move from a model built on consumption, extraction, and concentration,
to one that’s built on investment, sustainability, and distribution of the gains from
growth. In recent years, this shift has started to become visible. In particular, the
government’s response to the pandemic involved rapid intervention
in markets to support firms and individuals, successfully keeping
unemployment low. They have also committed to addressing
deep-set regional inequalities by ‘levelling up’, increasing R&D
expenditure, and setting up a new ‘green’ infrastructure bank.
But, to really ‘build back better’ we will have to do much more than
increase investment: we need to challenge damaging concentrations
of power. The question we now face is not just whether the state
should invest – the majority of economists and both major political
parties agree that it should - but how can the economic benefits of
that investment be shared in a just way? Simply increasing investment
in an economy that has structural flaws won’t solve problems in the
long-term. The state must act to structurally reform the economy
to shift the balance in favour of the majority. This means shifting
economic power in favour of ordinary people to ensure everyone
shares in the rewards of a thriving economy.
6IPPR’s Centre for Economic Justice (CEJ) has identified four key power shifts that
we believe policy makers should address. These are set out in more detail below.
We believe that by speaking to people’s concerns and their disempowerment,
these shifts have the potential to build towards a better economy that works for
everyone. We do not yet have all the answers. Instead, this paper aims to set out
some initial policy responses that we believe could be enacted now as part of
a national effort to ‘build back better’. In the coming months and years we will
undertake a new and exciting programme of work to develop this agenda and
refine ambitious but realistic policy solutions to the deep structural challenges
that we face as a country.
SHIFTING POWER IN OUR ECONOMY
1
Power needs to be shifted to employees and workers, from
employers and shareholders. Remedying the imbalance of power
between employees and their employers will enable workers to
negotiate better pay and ‘good’ work. As a first step we propose
government should target full employment where companies
compete for workers, not workers competing for jobs. We also
propose the introduction of sectoral collective bargaining to
address poor pay and conditions, including the underpaid and
undervalued key workers who kept us safe during the pandemic.
2
Power needs to be shifted to companies that work in the interest of
society from those that extract from society. Levelling the playing
field between large corporates and local businesses will help drive
productivity, create new jobs, rebalance economic activity and
ensure all firms pay their fair share. To begin this shift, we propose a
windfall tax on excess profits reaped during the pandemic alongside
a new industrial strategy – building on the vaccine success – that
works with business to target ‘moon shot’ social problems.
3
Power needs to shift to those who are locked out of wealth from a
system that has locked up wealth. Wealth is unequally distributed
in the UK. Tackling this will help ensure that everyone has the
opportunity to thrive and access to the basic goods, such as
housing, needed for a good life. To begin to unlock wealth for
the have-nots we propose the foundation of a Citizens’ Wealth
Fund, to invest in and share the benefits of the recovery of the
UK economy. To tackle property wealth in particular we propose
a new commitment to make secure housing available to all. This
includes measures to increase housebuilding and a new house
price inflation target for the Bank of England.
4
Power needs to be shifted to the nations, regions, and towns of
the UK from Whitehall. The pandemic has once again exposed how
geographically unbalanced our economy is. We need to empower
places to fully grasp local economic opportunities and revitalise
communities. To do this we propose transferring tax and borrowing
powers away from Whitehall and matching London’s levels of
investment spending across England distributed by a fair formula.
Local leaders should give citizens real power over decisions
through new forms of economic democracy.
78
INTRODUCTION:
SHIFTING POWER
TO BUILD A NEW
ECONOMY

                 9
THE PANDEMIC AND THE ECONOMY
A good society is one that makes it possible for everyone to lead a fulfilling life.
A global pandemic has been a ‘shock to the system’, prompting many to reflect on
what makes up a good life; be it personal health and wellbeing, time with family
or friends, or a satisfying and fulfilling job. The economy should enable people
to live this life, not hold people back, and it should work for everyone. Only 6 per
cent of the population want to return to the ‘pre-pandemic’ economy, while 58
per cent want to see ‘changes in the way the economy is run’ (Proctor 2020). For
policymakers, the pandemic should be a point of reflection to consider how the
economy can better share prosperity for all.
In the 20 months since the first cases of Covid-19 were detected in the UK, the
economy has been through its second once-in-a-generation shock in just over a
decade following the 2007/08 financial crisis. The pandemic brutally highlighted
the ways in which unfairness is embedded within our economy. Whilst small
businesses were more likely to close due to lockdowns (Bank of England 2020),
the big six tech firms added more than $4 trillion to their market value. Those on
the lowest wages and in the most precarious jobs were most likely to lose their
job or be furloughed, meanwhile more billionaires were created this year than
ever before (Sunday Times Rich List 2021).
But if the past year and a half has taught us anything, it is that we as a society
are adaptable. We can change the systems we have built if we want or need to.
The pandemic has prompted many people to think differently about how they
live their lives. They want politicians and policy makers to reflect similarly on our
economic system (Proctor 2020): to ensure that it enables people and communities
to flourish rather than holding them back. We need to hardwire our economy
“
for prosperity and justice.
Only 6 per cent of the
”
population want to return to the
'pre-pandemic' economy
10Prosperity
Governments have historically used gross domestic product (GDP) (and GDP
growth) as the main measure of economic success. However, while important,
there is a growing recognition that GDP is far from the only measure of what
really matters to most people in society. It fails to take account of the value of
our shared natural environment, individual health, wellbeing, social connections,
and informal care. Moreover, GDP growth has now decoupled from the earnings
people receive as a result of growing economic inequality (IPPR Commission on
Economic Justice 2018).
Creating a more prosperous society after the pandemic will therefore have to
mean more than just economic growth. Instead, we must broaden our definition of
prosperity to take into account of all of the dimensions of a ‘good life’. In recent
months IPPR has hosted a series of citizens’ juries across the country. We asked
people what a ‘good life’ meant to them. They prioritised fundamental goods like
health, security, connection to others, access to nature and feeling in control of
their own lives (figure I.1).
As we emerge from the pandemic citizens are making it abundantly clear: they
want more than just a return to ‘growth as normal’.
FIGURE I.1
The combined wellbeing framework of the IPPR Environmental
Justice Commission’s citizens’ juries
We believe in a better life for all. This means a future where everyone:
is able feels protected is able to access
has good to access from crime, and enjoy a
nourishing antisocial diversity of natural
physical and
food and has behaviour and environments
mental health the shelter climate threats and play a role in
they need protecting nature
is empowered
to make change has the ability is able to is free to express
happen directly and to move around relax, enjoy
is able to meet
themselves
through using their affordably, varied cultural and enjoy time and has choice,
voice in democratic, efficiently, safely, and leisure with friends control, and
meaningful and and sustainably and family
activities, and be independence in
transparent decision- in clean air physically active their own lives
making processes
is able to do has continued
has a support satisfying and access to lifelong
network and feels like they purposeful paid learning and has
connection to belong to a place, and unpaid work opportunities to
a close-knit with community that helps others develop, create,
community spirit and pride and which offers and pursue
opportunities for interests, and grow
personal growth spiritually
Source: IPPR Environmental Justice Commission 2021
11Justice
Prosperity alone is not enough; our economy must be fair. The pandemic must
mark the end of the previous era of growing inequality and the beginning of a
transition to a new one in which shared opportunity across people and places
is a core objective of economic and social policy. We call this economic justice.
We define a just economy as one where:
no person lives in absolute poverty
everyone can have dignity, and no one is
exploited in work or driven to destitution by
insufficient welfare support
no group in society is systematically or
institutionally excluded
inequalities of wealth, income, and power
narrow over time
every place gets their say in determining
the policies and institutions that impact
them and no places are left behind
we look after the future – including the
ability of future generations to live on a
healthy planet.
Economic justice is essential on a moral basis, but there is growing evidence that
a fairer economy is also a stronger, more resilient economy (Berg and Ostry 2011,
Cingano 2014, Ostry, Berg and Tsangarides 2014). Finally, it is essential for the
public to buy in to economic change. As set out by the IPPR Environmental Justice
Commission, the public will not accept big change – such as addressing the climate
and nature crises - if it is not fair, or they do not perceive it to be. The public have
a veto on all policies – a veto they can exercise at the ballot box or in the streets.
12PLENTY TO BE PROUD OF
There is much to be proud of in the UK economy, and many strengths to build
on. The pandemic has shown us that the UK can be and is world-leading. The
successful development of the Oxford-AstraZeneca Covid-19 vaccine alone is
testament to the strength of the UK’s life sciences industry and has been cited
by the Industrial Strategy Council as a case study of government-private sector
collaboration (Balawejder et al 2021). The UK is the 10th largest economy in the
world.1 Prior to the pandemic, the UK was both the fifth largest exporter and
importer globally and attracted the third largest foreign inward investment.
We have the world's second-largest financial centre and despite many
preconceptions the UK remains the ninth largest manufacturer in the world.
“ The pandemic brutally highlighted
the ways in which unfairness is
embedded within our economy
We have outstanding universities and scientific expertise and are an international
”
cultural powerhouse across film, music, and literature. We have established and
respected institutions: our legal systems, the civil service, the NHS, and the BBC.
But we can do better: these clusters of success are not large enough and there
are not enough of them. Earnings have not kept up with our rate of economic
growth and too many remain in low-pay and insecure work. At least in part, this
is due to the changing economic make-up of the UK. Since the middle of the 20th
century, UK manufacturing has declined as an employer, supplemented by a
vast increase in the service economy, in particular professional and technical
services and hospitality (ONS 2019). Many of these newly created jobs haven’t
offered the same levels of status or pay as those they supplement, or aren’t
available in the places where manufacturing was strongest. The creation of the
City of London as an international financial centre has not led to the creation
of new world-leading firms in the real economy – quite the opposite (Edgerton
2020). As finance has become more dominant, productivity and innovation
have stagnated (Christophers, 2020). The UK’s clusters of success are not
well distributed across the country. Almost half (46 per cent) of public R&D
expenditure is in the London-Oxford-Cambridge ‘golden triangle’ (Forth and
Jones 2020) and London accounts for 19 per cent of new jobs created but
attracts 38 per cent of the highest achieving graduates (Swinney and
Williams 2016).
1 Measured in GDP based on purchasing power parity. (IMF 2021)
13A SHIFT IN THE CONSENSUS
In 2018 the IPPR Commission on Economic Justice called for the UK economy to
move from a model built on consumption, extraction, and concentration, to one
that’s built on investment, sustainability, and distribution of the gains from growth.
We argued that this would require a fundamental shift in economic policy. Since
then, the start of such a shift has become visible. The government’s response to the
pandemic involved rapid intervention in markets to support firms and individuals,
successfully keeping unemployment low. The UK government has committed
to addressing deep-set regional inequalities by ‘levelling up’, increasing R&D
expenditure, and setting up a new ‘green’ infrastructure bank.
But the evidence is clear that so far rhetoric has not been translated into the
scale or kind of actions needed to make aspirations reality. To genuinely build
back better, policy makers will have to go further than this in three main ways.
First, the UK government’s actions have failed to live up to its
ambition on investing in a better economy. The UK isn’t set to
achieve its pre-pandemic level of GDP until next year, whilst the
USA – where Biden has pursued a more ambitious stimulus – has
already achieved this milestone. Meanwhile, longer term levels
of investment in the UK are amongst the lowest in the OECD –
in 2019 only Italy, Greece, and Luxembourg invested less as a
percentage of GDP.2 Now is the time to ‘boost it like Biden’ and
commit to an ambitious programme of long-term investment
to protect the environment, develop new areas of industry and
innovation, and create new high-quality jobs.
Second, a consensus is emerging on both left and right that
state intervention can be good for businesses and workers
while also achieving important societal goals. As Martin
Sandbu argues, goals such as levelling up and building
back better ‘require confidence in the ability of the state to
coordinate and steer private sector behaviour and a willingness
to establish a desired destination’ (Sandbu 2020). To solve the
challenges that our society and economy face, we need a state
that will work with businesses, communities, and workers to
coordinate and direct the economy towards democratically
determined societal goals.
And, finally, the question now is not just whether the state
should invest but how can the economic benefits of that
investment be shared in a just way? Of critical importance is
how the crisis and the recovery will affect the balance of wealth
and power in the economy. Simply increasing investment in
an economy that has structural flaws won’t solve problems in
the long-term. The state must act to structurally reform the
economy so that it works for everyone. This means shifting
economic power in favour of ordinary people to remedy a
lack of justice and ensure everyone shares in the rewards
(in the broadest sense) of a thriving economy.
2 The analysis is based on OECD figures for capital investment as a share of GDP, available on their Annual
National Accounts database (http://stats.oecd.org/). ‘Investment’ corresponds to ‘gross fixed capital
formation’ (System of National Accounts code ‘P5’).
14POWER TO SHAPE THE ECONOMY
There is nothing inevitable about our economy. The system we have today was
shaped by the rules and institutions established by successive governments and
generations of policy makers. We can – and must – now reshape our economy for
justice. This demands that we rethink how it is governed and managed. We believe
that to reshape our economy for justice, those who have so far been unable to
influence the system must be empowered to do so. Power is held by individuals
and institutions and emerges through arrangements and relationships that shape
our lives. We must rebalance economic power across the economy and across
society. Citizens and communities must be empowered so they are able
to influence how the economy works for them.
Citizens’ juries hosted by IPPR told us that being empowered to engage in
decision-making and creating change is one of the cornerstones of a good quality
of life. People need to feel that they are part of change, that they have a sense of
ownership over the actions taken and are committed to what comes next; they want
to see that decisions will improve things for them and the people they care about.
Change cannot be done to people; it must be done with and by them.
Today the economy is characterised by concentrations and imbalances of power
that are both a cause of some of our economy’s problems and a barrier to their
solution. But where is power concentrated and who do we need to distribute it to?
In this report, we focus on four specific imbalances of power and the shifts we
need to see to truly ‘build back better’. In our view, in addition to measures to
support and grow the economy, such as significant economic stimulus and long-
term investment, these power shifts should be the priorities of economic policy
through and after the recovery. We believe that by speaking to people’s concerns
and their disempowerment, these shifts have the potential to build towards a
better economy that works for everyone. This views people across the UK as
part of the solution, not a problem (electoral or otherwise) to be managed.
1
Power needs to be shifted to employees and workers, from employers
and shareholders. Remedying the imbalance of power between
employees and their employers, will enable workers to negotiate
better pay and achieve ‘good’ work.
2
Power needs to be shifted to companies that work in the interest of
society from those that extract from society. Levelling the playing
field between extractors and innovators will help drive productivity,
create new jobs, rebalance economic activity and ensure all firms pay
their fair share.
3
Power needs to shift to those who are locked out of wealth from a system
that has locked up wealth. Wealth is unequally distributed in the UK.
Tackling this will help ensure that everyone has the opportunity to thrive
and access to the basic goods, such as housing, needed for a good life.
4
Power needs to be shifted to the nations, regions, and towns of the UK
from Whitehall. Geographical inequalities cut across these dimensions of
power. Empowering places will allow them to fully grasp local economic
opportunities and revitalise communities.
We believe that addressing these power imbalances is the only way to achieve
prosperity for all as the UK recovers from the pandemic.
151 16
›
TO

  ›
EMPLOYEES
AND WORKERS

      FROM
      EMPLOYERS AND
      SHAREHOLDERS

                      17
Good work provides people with a decent income and standard of living, purpose,
and identity. Many employers across sectors offer this - good pay, working conditions,
and prospects for progression. Pre-pandemic rates of unemployment were at a
45-year low (ONS 2021c).
Yet record low levels of unemployment have not triggered rising wages. For those
who lack training, or who live in a post-industrial town with few large employers,
work is failing to pay. If there is one statistic that epitomises the moribund state
of the UK labour market, it is that in the decade since 2009 a shocking two in five
employees have seen real terms fall in their hourly pay (figure 1.1). This is more
than twice as high a proportion as saw a fall in the preceding decade.
FIGURE 1.1
Since the 2007/08 financial crisis almost 40 per cent of employees have seen
a decline in incomes and a majority have seen less than 2 per cent real increase
per year over that period
Compound average real-terms hourly pay growth
Decrease 0–2% 2–4% 4–6% 6%+
1998- 17% 20% 23% 18% 23%
2008
2010-
2019 39% 21% 16% 10% 14%
Source: IPPR analysis of University of Essex 2020 (Understanding Society Waves 2 & 9 and British
Household Panel Survey Waves H and R). Incomes adjusted to CPI-H to January 2019 prices for 2009-
2019 analysis, and August 2008 for 1998-2008 analysis. Growth rates are compound average annual
growth (CAGR). Percentages may not sum to 100% due to rounding.
Our analysis underlying figure 1.1 shows that declining real wages were affecting
people in a broad range of jobs. We find that about half of jobs in the 40th-80th
percentile for pay saw a real decline between 2010 and 2019. This implies that the
labour market is not working for people with very different skills and backgrounds.
Taking for example, transport drivers and operatives – a bus driver earns about
£27,000 per year compared to the median full-time salary of £31,000. Many above-
median earners are also affected, in both the private sector (eg functional managers)
and in the public sector (eg teachers and health workers).
Work is increasingly not a route out of poverty (McNeil et al 2021). This is a
fundamental breach of the social contract that has underpinned our society: if you
work hard, you will get on. Despite rises in the minimum wage, almost one in five
people in working households were below the poverty line prior to the pandemic,
up from 13 per cent 15 years prior, with the situation worse still in some parts of
the UK (ibid) (figure 1.2).
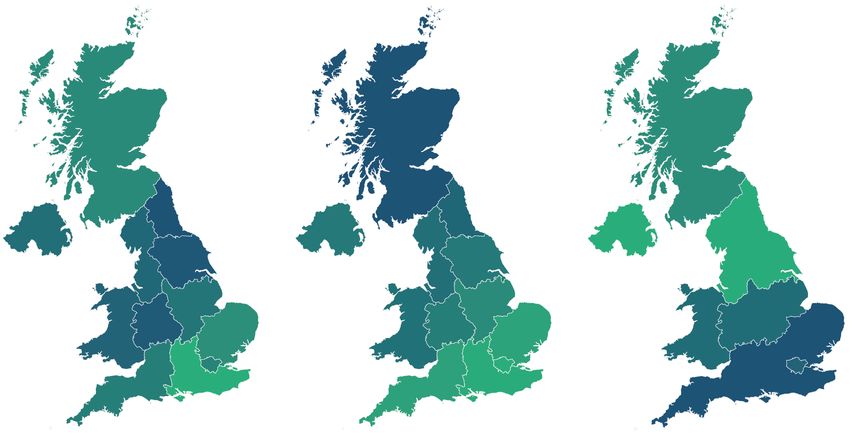
18FIGURE 1.2
In-work poverty has risen across the country but most notably in London
In-work poverty rates by geographic area, Great Britain
25%
London
North of
20% England
Midlands
Wales
15%
South of
England
and East
of England
10%
Scotland
5%
0%
1998/99
1999/00
2000/01
2001/02
2002/03
2003/04
2004/05
2005/06
2006/07
2007/08
2008/09
2009/10
2010/11
2011/12
2012/13
2013/14
2014/15
2015/16
2016/17
2017/18
2018/19
2019/20
Source: IPPR analysis of Households Below Average Income (DWP) and Family Resources Survey, McNeil et al (2020)
Insecurity in the labour market has risen dramatically over the last decade:
5.5 million people are now estimated to be in insecure work such as temporary
work, ‘bogus’ self-employment, non-standard contracts, agency and ‘gig’ work, or
working on a zero-hours contract. The use of the latter has grown precipitously in
recent years, such that now more than 960,000 people are employed this way – up
from just 168,000 in 2010 (ONS 2021b). It is indicative of a labour market that has
shifted risk from employers to individuals. Of those in insecure work, 2.5 million
workers are underemployed in the UK3 (Jung and Collings 2021).
Headline numbers hide individual stories. For example, somebody working
full-time in the social care sector – a crucial public service - makes on average
£19,959 per year, far below the average of £31,461 (ONS 2021a), and there are
often challenging working conditions, uncertain hours, and few prospects for
progression. This is in part caused by historic underfunding of social care which
must be addressed after the pandemic. But just as important is the imbalance of
power in a fragmented sector between many providers of social care and workers
who tend to be low skilled, un-unionised and often not from the UK. This allows
large care providers to extract significant profits whilst underpaying staff (Dromey
and Hochlaf 2018, Blakeley and Quilter-Pinner 2019).
From this poor starting position, the UK labour market was dealt a shock by
Covid-19. During the pandemic the furlough scheme (or formally the Coronavirus Job
Retention Scheme) has helped the economy to recover and kept people in jobs. Yet
despite this level of state support, unprecedented in the post-war period, by the
end of June the ‘jobs gap’ – defined as the number of jobs furloughed plus those
lost since the beginning of the pandemic – was still about 2.1 million (HMRC 2021).
3 Using the ONS definition of underemployment that follows the International Labour Organisation
19Existing economic injustices have been exacerbated whilst a focus on key workers
raised questions about who was valued in our economy. Those on low pay were
much more likely to cease working during the crisis than those on high pay (figure
1.3). At the same time, whilst the economy looks to be beginning a recovery and
all coronavirus restrictions on businesses have been removed, there are still 1.9
million people on furlough who could potentially be plunged into unemployment.
The decline in employment has been unevenly spread across sectors. Figure 1.3
shows several striking trends. Firstly, there is a clear split along income lines with
most jobs lost being low-paid and low-skilled, while most of the newly created
roles are high-paid and high-skilled. But given the coincidence of low-pay with
low qualification levels (shown in figure 1.3), most of those who have lost their
job because of the pandemic might lack the skills and training needed to obtain
one of the newly created roles. If the demand for these job remains subdued or
precarious, then the pressures on low earners will continue.
FIGURE 1.3
The majority of jobs lost during the pandemic have been low-paid and low-skilled while those created have
been highly-paid and largely high-skilled
Change of employment of occupational groups between Q1 2020 and March-May 2021, by average wage level
700
Corporate managers
and directors
600 Business, media and public
service professionals
Skilled metal,
electrical and
Average weekly pay Q1 2021
electronic trades 500
400
Skilled construction
and building trades Administrative
occupations
UK living wage
300
Caring personal
service occupations
Sales
Elementary administration 200 occupations
and service occupations
Skill level (SOC)
1 2 3 4
100
-30 -20 -10 0 10 20 30 40 50
Percentage change in hours worked 2020-21
Note: The size of the bubbles shows the current size of employment by occupation.
Source: IPPR analysis of ONS LFS
The mistakes of the decade following the financial crisis must not be repeated.
Any definition of ‘build back better’ in the UK must mean more than just creating
more jobs to prevent unemployment and underemployment, but also creating
better-quality jobs. This means higher pay, better progression, decent working
conditions and greater autonomy and control for workers.
20We believe the way of achieving this ambition is by empowering workers to negotiate for better pay and conditions of employment. Lack of worker power in the economy has been linked to stagnant wages (Bryson and Forth 2017), growing inequality across the entire economy (ibid), poor productivity improvements (Acas 2015), stagnant growth (Onaran et al 2015), and exploitation. It is reflected in the decline in labour’s share of national income by ten percentage points since the 1970s (figure 1.4). When workers are not empowered, their employers are able to keep pay low to reduce their costs. This might benefit company owners, but it does so at the expense of workers in terms of lost pay, and it costs the state who must pick up the welfare bill and the cost of treating health impacts (Dromey 2018). There are two main mechanisms through which workers have lost power in the economy. Firstly, the way that workers have conventionally collectively fought for greater power in the workplace is through association through trade unions. Unions and collective bargaining allow workers to exert power and negotiate better conditions (Reeves 2018). Rates of trade union membership have been falling in the UK since the 1980s and were at an all-time low in the UK in 2017 (figure 1.4). The public sector is the main area where trade unions have retained a grip. Since 2017 there has been a small increase in membership (BEIS 2021) and some trade unions reported that the shock of pandemic job insecurity had driven a ‘revival’ in membership (Financial Times 2020) but workers with the lowest pay (
The second way workers can gain power relative to their employers is if there are
      fewer people competing with them for their job. In theory, when unemployment
      is high, it keeps wages low as there are more people seeking fewer jobs. When
      numbers of jobseekers are low – when the economy has a so-called ‘tight labour
      market’ – it means that companies have to fight for employees, rather than the
      other way round, driving up pay and conditions for workers.

      However, despite low levels of unemployment pre-pandemic, we failed to see an
      uptick in average worker pay, indicating the labour market was not ‘tight’ in the
      conventional sense. Low rates of overall unemployment disguise a malaise in
      the labour market of poorer job quality since 2008, fuelled by lack of business
      confidence to take on workers on a permanent and reliable basis (Stirling 2019).
      That business confidence is in turn linked to levels of aggregate demand across
      the economy. If people are employed but the work is precarious or they cannot
      get sufficient hours for example, they are in no place to bargain for greater wages,
      with efforts further undermined by a freeze in public sector pay and a weaker
      social safety net which have put a greater emphasis on an ‘any job’ economy.

      Low pay is often associated with precarious work. Insecure work has decreased
      over the last 5 years but is still higher than before the financial crisis. As shown
      above, lower paid occupational groups are more likely to have been lost during
      the pandemic. More generally, low-paid jobs had significantly higher levels of
      insecure employment, as shown in figure 1.5. More than one in four workers in the
      lowest income decile were in insecure employment – almost twice the rate of
      median-income workers. This includes many hospitality jobs such as bar staff,
      kitchen porters and cleaners. Ethnic minorities were significantly more likely to be
      in insecure work. Ethnic minorities in the lowest wage decile were 13 per cent more
      likely to be in insecure jobs than people of white background.

      FIGURE 1.5
      About one in four jobs in the lowest pay decile are insecure
      Share of jobs that are insecure, by wage decile Q2 2021
                       30

                       25

                       20
     Insecurity rate

                       15

                       10

                        5

                        0
                            1   2      3        4     5       6       7      8                    9        10
                                           Employment-weighted hourly pay decile

      Note: For the purposes of our analysis, we defined a job as insecure if it is: temporary, agency work, on
      a zero-hours contract; or if a worker is, looking for another job because of lack of security or sufficient
      hours or looking for a job on top of their current job; or if a worker would work more hours at the job’s
      basic pay rate; or if a worker is classed as self-employed but paid by agency.

      Source: IPPR analysis of ONS (2021g)

22
› EMPLOYERS SHOULD BID FOR WORKERS,
NOT WORKERS FIGHTING FOR JOBS
Building back better from the pandemic means more than simply being in a job.
That is not enough. Workers need the power to negotiate for better conditions of
employment; we need to rebalance power at work. In the US, the Biden administration
is pursuing a bold and progressive policy agenda, premised on an era of full
employment and a ‘high pressure’ economy. It is essential that government in
the UK prioritises this transition as a way of truly building back better.
To achieve that we propose the following.
A right to a good job: commit to full employment
• Government should target full employment in the post-pandemic world.
This means moving beyond the government’s current objective to ‘achieve
strong, sustainable and balanced growth’ (Bank of England 2021b) and
include an additional focus on jobs. HM Treasury in close coordination with
the Department for Business, Energy and Industrial Strategy (BEIS) should
explicitly target and track progress towards full employment and associated
tight labour market conditions. We define full employment as low levels of
unemployment, low levels of underemployment and low levels of insecure work.
• Government should ‘boost it like Biden’ by committing to new public
investment to create good green jobs (Roberts and Jung 2020). Government
should pursue a targeted stimulus to achieve full employment, increasing
annual public investment by £47 billion, which would take it to the level of
countries such as Sweden (ibid). This includes £30 billion additional annual
investment in green projects and about £17 billion investment in social
infrastructure such as health and social care (ibid, IPPR Environmental Justice
Commission 2021). These investments would have a rebalancing effect on the
economy, countering job polarisation by creating mid-skilled jobs that could
provide progression opportunities (Williams et al forthcoming).
More and better: a plan for good work
• Government should introduce and fully fund a ‘right to retrain’ scheme for
workers at risk of losing their job.4 This should be available to anyone of any
age, and contain elements targeted at workers impacted by the pandemic and
upcoming changes driven by the push for net zero. It should focus not just on
getting people into jobs but allowing people to transition from the low-paid
low-skill roles that have been lost during the crisis to higher pay and higher skill
roles in sectors that are set to grow in the future. This should include a roll-out
of personal lifelong learning accounts (Dromey, McNeil and Roberts 2017) and a
significant increase to the government’s adult skills budget (Murray 2020).
• Government should introduce sectoral collective bargaining to address poor pay
and conditions, including underpaid and undervalued key workers who kept us
safe during the pandemic. Full employment means more than just more jobs. It
means significantly driving down underemployment and improving conditions
as well. BEIS should promote a renaissance of sectoral collective bargaining
particularly in low-productivity, low-paid sectors, such as social care or retail, as
well as more widespread firm-level bargaining (Dromey 2018). Government should
explore sector-specific structures for achieving this; IPPR has previously proposed
a license-to-operate model in the social care sector (Dromey and Hochlaf
2018) which could be combined with a Royal College for Care Workers (Reeves
2018) charged with bargaining for pay and conditions. Collective bargaining
should be incorporated into future ‘sector deals’ within the Plan for Growth.
4 Equivalent funding should go to devolved nations.
232
TO

› ›
COMPANIES
THAT WORK IN
THE INTEREST
OF SOCIETY

       FROM
       THOSE THAT
       EXTRACT FROM
       SOCIETY
The Covid-19 pandemic and the restrictions put in place to stop the spread of the
virus have shaken businesses across the UK. Overwhelming state support has been
needed to prevent the collapse of firms and in some cases entire sectors. But as
with all stories of the pandemic, the effects, both negative and positive, have not
been distributed equally. Some sectors have been able to continue operating during
lockdowns – notably online retailers – and as a result have seen massive increases
in sales, whilst businesses based on tourism or hospitality have been closed for
months on end (figure 2.1).
FIGURE 2.1
Small firms are more concentrated in sectors affected by lockdowns than large firms
Share of total assets owned by sector for large (turnover of more than £10 million)
and small (turnover of less than £10 million) firms with sectors ordered by the
degree to which they were affected by lockdowns
20 More affected by lockdowns Less affected by lockdowns
18
16
14
Small firms (£10m)
12
10
8
6
4
2
0
n
g
tio nt
as r
ag t
w nd
at nd
fo n
ta e
w te
or or
in
tio
re al
d tio
ea e
n
te
e
k
n
al a
ic a
d Wa
od
il
ur
st p
cr m
d es
or
io
uc
d ns
ci lth
un IT
an oda
t
re in
an hol
ac
tr
an Tra
d rta
so ea
ns
uf
m
W
H
an nte
m
an
Co
an
co
m
M
,e
m
Ac
ts
co
Ar
Note: Sectors ranked based upon ONS (2021d) data on percentage of firms in each sector that had to
close due to lockdowns from highest proportion on the left to lowest on the right. Assets are total
assets reported on company balance sheets.
Source: Bureau van Dijk (2021), ONS (2021d)
26Small businesses were more likely to close due to lockdowns (Bank of England
2020), disproportionately used government loans5 and were more likely to have
higher debt repayments (figure 2.2). By comparison tech giants such as Amazon
saw their profits triple (BBC 2021). Apple became the first trillion-dollar company in
2018 but added an additional $1.1 trillion to its market value during the pandemic.
Just six tech firms have added more than $4 trillion to their market value since the
pandemic began: Amazon, Microsoft ($950 billion), Amazon ($761 billion), Alphabet
(parent company of Google) ($643 billion), Facebook ($433 billion), and PayPal
($196 billion).6 Firms in the pharmaceutical, healthcare and gaming sectors also
saw increases in value during the pandemic and some companies have reported
significant increases in profits (Tax Justice UK 2021).
FIGURE 2.2
Small firms, with fewer than 50 employees, were more than twice as likely to have
significantly larger debt repayment costs
Percentage of businesses reporting a more than 20 per cent increase in debt
repayment costs compared to last year
30%
25%
20%
15%
10%
5%
0%
0–9 10–49 50–99 100–249 >250
Size of business (number of employees)
Source: ONS (2021h)
It is vital that we ask whether these shifts will help or hinder our society as
a whole. The behaviours of businesses have profound impacts on people and
communities. From paying their fair share of tax, to investing in high streets, the
decisions taken in company boardrooms affect the lives of citizens. A company
may choose to invest its profits in new technology to reduce carbon emissions,
or alternatively it may choose to shift those profits to an overseas tax haven
(Dibb et al 2021). A firm might invest in training and upskilling for its workers,
or equally it could pay those same funds out to a small number of shareholders.
Companies may opt for sustainable investment plans that allow high streets to
thrive. Alternatively, as we have seen in the case of Toys R Us, Topshop, and BHS,
companies can be ‘asset stripped’ before going bankrupt allowing their owner to
walk away with the assets and profits and hollowing out the high street.
5 In the form of Bounce Back Loans and Coronavirus Business Interruption Loans.
6 Values for market capitalisation gains are calculated by comparing values on 11 August 2021 to 31
December 2019 (CompaniesMarketCap 2021).
27If we are to ‘build back better’, there’s an urgent need to tilt the playing field in
favour of companies who do the right thing. The context within which business
decisions are made is affected by balances of power between companies,
governments, and citizens. Critically, it is also driven by power imbalances
between firms themselves, where large firms are sometimes able to consolidate
large amounts of market power. Unchecked, some firms, especially those that hold
monopoly positions, are able to simply extract profit and value from society and
give little back. We need to shift power in our economy away from those companies
that extract from society, towards companies that work in the interest of society.
Some companies do the right thing for their employees, the environment, and
society. They play a crucial role in prosperity and justice, and they should be held
up as examples for the minority of companies who do not. When companies seek
to focus on just maximising profits, there is a real harm to ordinary people. This
has increasingly been recognised by business leaders themselves. Just before
the pandemic 181 American CEOs came together to ‘redefine the purpose of
the corporation’, moving emphasis away from shareholders and towards wider
stakeholders (Business Roundtable 2019). The Covid pandemic has been a true
test of this rhetoric. Taxpayers around the world have stepped in to support
companies and entire sectors. We need companies to shift to contributing to
wider society in order to build back better.
REWARDING INVESTMENT, PUNISHING EXTRACTION
Too often the ‘free market’ fails to reward companies that work in the interests of
society. The state can use its power to correct this but too often governments have
failed to do so. For example, people involved in IPPR’s citizens’ juries told us that
government needs to show greater leadership in rewarding companies that do the
right thing for the environment and punish those that don’t. However, in the UK,
57 per cent of all energy-related funding commitments since the pandemic started
have gone towards fossil fuels with no conditions attached, while only 4 per cent
of fossil fuel support has green strings attached (Tearfund 2021).
Similarly, while the state stepped in to support asset markets, businesses, and
wealthy asset owners, this came without any obligations on their part (Berry et al
2020). For example, the incomes of banks and property owners were underwritten
without any obligation to shoulder risk, whilst tenants went unprotected. Small
businesses took on financial debt but if they fail it is the lender who will be
compensated by government. In effect, those least able to weather the crisis
were being asked to make further sacrifices in order to protect the incomes
of those most able to weather it.
Government can take back power from extractive companies. It can take an active
role in coordinating and steering the economy towards shared societal goals,
creating strong markets and fostering opportunities for businesses working
towards those goals. It can use investment, taxation, regulation, and procurement to
help create the right incentives and conditions to ensure doing the right thing for
society aligns with the right thing for your business (Mazzucato and Willetts 2018).
Indeed, the pandemic, and the UK’s government’s role in supporting British firms
to create effective vaccines and treatments, is evidence of this (Balawejder et al
2021). The climate and nature crises and Covid-19 are the most urgent examples
where this new partnership between the state and private sector is needed. But
they are far from the only ones: markets need to be steered towards challenges
such as geographical inequality, an ageing society, delivering financial stability,
and the transition of digitalisation.
28THE POWER TO EXTRACT VALUE
One way in which some companies fail to work in the interests of society is by
opting to pay out large profits to shareholders rather than reinvest those profits.
This matters because investment is crucial to improving productivity, skills
and training, job creation and the shift to net zero. Additionally, many of these
companies channelling profits to (overwhelmingly the wealthy) shareholders have
also been the recipients of public funding, tax incentives, and direct grant support.
There are two notable ways this manifests: dividend payments which direct
excess profits to shareholders and share buybacks where a company purchases
its own shares to boost their price benefitting executives and investors. For
example, between 2009 and 2018, on average, 25 per cent of FTSE100 firms paid
out more money to their investors than they earned in net income over that same
period (Baker et al 2020). In other words, firms were paying out their underlying
financial buffers to investors even though they are crucial for their long-term
sustainability. Relatedly, large multi-national firms are often able to avoid paying
their fair share in corporation tax (Dibb et al 2021), funnelling profits away from
where they are generated. Globally profit shifting to tax havens is estimated to
cause $500 billion in losses to public coffers each year – a number that has sharply
“
increased over recent decades (Tax Justice Network 2020).
When companies seek to focus
”
on just maximising profits, there
is a real harm to ordinary people
During the pandemic, companies receiving public support through business rates
relief or a state-guaranteed loan were paying this out to shareholders, yet the
UK government didn’t restrict firms in their dividend or buyback practices, as the
Danish and French governments did. There have also been accusations of poor
practices and potential corruption involved with outsourcing of test and trace
and procurement of PPE (personal protective equipment) during the Covid-19
pandemic (Transparency International 2021). As the economy returns to growth
after unprecedented public support, companies have returned to paying out
large dividends. In 2021 30 UK-based companies have announced share buybacks
totalling £8 billion in a ‘share buyback bonanza’ (Armitage 2021, Kasumov and
Venkataramakrishnan 2021).
As we demonstrated in Who wins and who pays, the government’s flagship support
scheme during the pandemic, CBILS, secured £330 billion of loans from banks to
businesses (Berry et al 2020). Crucially, these guarantees are for the lending bank,
not the business itself. A business that found itself unable to make the repayments
on a CBILS loan would still face bankruptcy whilst the lending bank would be
unaffected. Businesses still bear the risk of borrowing during a downturn, while
the bank’s risk is substantially transferred to the state. In the words of Jamie
Dimon, JPMorgan Chase chief executive, ‘Our cup runneth over’ (Kasumov and
Venkataramakrishnan 2021). In July 2021 the Bank of England removed temporary
‘guardrail’ restrictions on banks paying out dividends and share buybacks, with
an instant increase in the share prices of those banks (Jones and Milliken 2021).
29BALANCE OF POWER BETWEEN LARGE AND SMALL COMPANIES
Another way in which extractive firms consolidate power is through their position
and size within markets. When firms grow extremely large and monopolise a
sector, competition between firms declines. This can manifest in many ways
that matter to people; prices can rise as companies increase their profit margins
free from competitors. If they have no chance of losing their dominant position,
companies can rest on their laurels and cease investing in innovation and
improving productivity. Workers in a place or sector that’s dominated by just
one major player face few options and therefore may have to accept worse jobs
(Eckhout 2021). Unbalanced markets can also make macroeconomic policy less
effective (Duvall, Fuceri and Tavares 2021) because, if firms have a lot of power,
they react less strongly to market signals including monetary policy (Syverson
2018). And the shareholders of dominant firms can pull away from society in
their wealth and power.
The pandemic is likely to exacerbate problems of concentrated market power.
As we have set out above, small and large firms experienced the pandemic
differently, with the former more likely to be struggling as we emerge from the
pandemic. For example, we know that small firms were more likely to be in sectors
hit hard by lockdowns (Bank of England 2021a) and as a result were more likely to
take out government loans in order to survive. Unsurprisingly, the majority of firms
reporting significant increases in their debt repayment costs are those with less
than 50 staff (figure 2.2). This could lead to smaller firms going bust or getting taken
over and therefore greater market concentration.
“ Small firms were more
likely to be in sectors
hit hard by lockdowns
”
Indeed, the IMF (2021a) finds a global ‘pandemic-driven rise in market power
across multiple industries. Global price markups have risen by more than 30 per
cent, on average, across listed firms in advanced economies since 1980. And in the
past 20 years, markup increases in the digital sector have been twice as steep as
economy-wide increases.’ The Competition and Markets Authority (CMA) also finds
that the pandemic could exacerbate inequality between firms and increase market
concentration (CMA 2020). The increase in recent takeover activity, combined with
weakened and highly indebted small firms, could be a harbinger of that.
Figure 2.3 shows that higher profits margins indeed tended to be higher for
bigger firms (as measured as the size of their revenues). But this was not
uniformly so: some sectors with large businesses do have tight competition
while in others regulation keeps market power at bay. This indicates that
competition is one solution to dominance, but it’s not the only solution.
Changes to ownership, governance, and regulation can also be used to
tame sectors that are extractive and unbalanced.
30Indeed, competition when conceived of too narrowly or within a rigid ‘free market’
context can also facilitate the kinds of extractive business practices we seek to
avoid. Competition has to be conceived of more widely than solely prices and
should include the wider interests of consumers, suppliers and entrepreneurs,
alongside taxpayers, workers and the wider public value of innovation (CEJ 2018).
More competition may be good for some sectors but there are also areas which are
simply not large enough to support effective competition (aerospace is a classic
example of this) or natural monopolies make this impossible (Christophers 2020).
FIGURE 2.3
Larger firms tend to charge higher profit margins
Profit margins in 2019 for UK-based firms (median, 25th and 75th percentiles) by
decile of earnings before interest, taxes, depreciation, and amortization (EBITDA)
40
75th percentile
30
Larger firms
tend to have
higher profit
rates
20
Median firm’s
profit
10
25th percentile
0
-10
-20
Smaller firms Larger firms
-30
1 2 3 4 5 6 7 8 9 10
Company earnings, by decile
Note: The figure is based on a sample of 41,793 UK-headquartered firms, with turnover over £10 million.
The data only includes firms that have profit margins and turnover data listed.
Source: IPPR analysis of Bureau van Dijk (2021)
31You can also read