Adarsh Bagaria Celine Dascarolis Stan van Hare Thomas J. Muldoon Jr. Lennart Padberg Raul Prey - United Nations ...
←
→
Page content transcription
If your browser does not render page correctly, please read the page content below
Adarsh Bagaria
Celine Dascarolis
Stan van Hare
Thomas J. Muldoon Jr.
Lennart Padberg
Raul Prey
Plastics Circularity Index (PCI) 2020 - The EU Edition - is prepared by the
authors in the scope of Policy in Emerging Markets co-training of Economics
and Strategy in Emerging Markets programme, School of Business and
Economics, Maastricht University and UNU-MERIT. The index addresses how
EU countries perform relative to each other in their circular management of
plastics and related waste products. A circular economy, encompassing plastics,
is complex and entails several decisions and actions of actors. PCI analyses
activities undertaken by governments, businesses and consumers that stimulate
the circular usage of plastics. The PCI EU Edition covers each stakeholder
category with a collection of indicators to gain an initial view of the state of
plastics circularity in EU countries. In addition to 21 indicators in total from
each actor category, the index also considers country profiles on plastics and
circularity. Data and online map is available from the Lab of UNU-MERIT.

                                                           Dr. Serdar Türkeli
                                                                   Supervisor
                                                           UNU-MERIT | UM

                                                                       Authors

                                                            Adarsh Bagaria
                                                           Celine Dascarolis
                                                              Stan van Hare
                                                       Thomas J. Muldoon Jr.
                                                           Lennart Padberg
                                                                  Raul Prey

© Authors, 2020

                                                                              2
TABLE OF CONTENTS

1.      Literature Review .................................................................................................................................... 8
     1.1       Definition of Key Concepts ............................................................................................................. 8
        1.1.1     The Key Concept of Circularity ........................................................................................................ 8
        1.1.2     The 4R Framework & Waste Hierarchy ........................................................................................... 9
        1.1.3     Systems Perspective ........................................................................................................................ 9
        1.1.4     Enablers ......................................................................................................................................... 10
        1.1.5     Types of Plastic Waste ................................................................................................................... 10
        1.1.6     Reduce, Reuse, & Recycling of Plastic ........................................................................................... 11
     1.2       Importance of Circular Plastic Waste Treatment .......................................................................... 12
        1.2.1Global Developments .......................................................................................................................... 12
        1.2.2 Plastic Waste Treatment .................................................................................................................... 13
     1.3 Incumbent Policy Frameworks ............................................................................................................. 14
     1.4       Current Main Impediments .......................................................................................................... 17
        1.4.1     Operational Barriers ...................................................................................................................... 17
        1.4.2 Policy Barriers ..................................................................................................................................... 18
        1.4.3 Firm Barriers ....................................................................................................................................... 18
        1.4.4 Information Asymmetries ................................................................................................................... 19
     1.5       Potential Opportunities ............................................................................................................... 19
        1.5.1 Policies ................................................................................................................................................ 19
        1.5.2 Cost Reductions & Fiscal Incentives ................................................................................................... 20
        1.5.3 Business Practices ............................................................................................................................... 21
        1.5.4 Consumer Incentives .......................................................................................................................... 21
        1.5.5 Demand for Plastic Waste .................................................................................................................. 22
     1.6       Requirements to Realise a Transition Towards Circularity ........................................................... 23
     1.7 Existing Methodologies ........................................................................................................................ 27
2.      Methodology, Limitations & Future Research ....................................................................................... 31
     2.1      Selection of Indicators ................................................................................................................. 32
        2.1.1     General Benchmarks ..................................................................................................................... 34
        2.1.2     Social Indicators ............................................................................................................................ 35
        2.1.2     Business Indicators: ....................................................................................................................... 37
        2.1.3 Regulatory Indicators: .................................................................................................................... 37
     2.2 Survey .................................................................................................................................................. 39
     2.3 Limitations & Future Research ............................................................................................................. 40
3.      Results & Discussion ............................................................................................................................. 43
     3.1     Overall Results ............................................................................................................................. 43
     3.2     Benchmark Scores ........................................................................................................................ 45
     3.3     Consumer Scores ......................................................................................................................... 47
     3.4     Industry Scores ............................................................................................................................ 49
     3.5     Regulatory Scores ........................................................................................................................ 51
4.       Recommendations ................................................................................................................................ 54
5.       Conclusions .......................................................................................................................................... 59
References ..................................................................................................................................................... 60
Appendix A: Indicators Considerations ........................................................................................................... 66
Appendix B: Plastic Bag Ban Methodology ..................................................................................................... 69
Appendix C: Detailed Scorecard Methodology ............................................................................................... 70
Appendix D: Survey Results ............................................................................................................................ 72

                                                                                                                                                                       3
ction

        4
In 2015, the European Union (“EU”) initiated the Circular Economy Action Plan, which
aimed to foster sustainable development through the recovery and reuse of waste in all
member states. The main benefits of the circular economy (“CE”) are twofold. Firstly, an
economy that minimizes waste and maximizes values of existing waste will be more
competitive on a global stage (Stahel, 2012). Secondly, a reduction in resource extraction
inherent in a functioning CE provides environmental benefits to all members of European
society and abroad. Meeting these goals has spillover benefits into technological
development, employment rates, and other critical economic metrics (Stahel, 2012). In
addressing the entire lifecycle of waste streams from design to reuse, the current EU approach
to attaining a circular economy is comprehensive. Meanwhile, as the CE allows for
differentiation between member states in how goals are met, it is a versatile framework
capable for sustainable development in Europe.

Besides the waste streams of paper, metals, and glass that are measured under the CE goals,
plastic waste is by far one of the more infamous challenges to our local ecosystems and global
environment. There now appears to be plastic waste debris in every ecosystem on the planet
(United Nations, 2018). The seriousness of this trend is reflected by the 2018 adoption of the
EU Strategy for Plastic in a Circular Economy (European Commission, 2018) which marked
the first continental drive towards enhancing circularity of our plastic goods networks. The
remainder of this paper will be dedicated to the circular economies of plastic waste. This is
due to its increasing environmental importance, as well as its economic gravity. Plastic
production has skyrocketed since the 1950’s (United Nations, 2018) and is only increasing as
industries like packing and shipping are increasing in relevance to the average consumer.
Likewise, plastic is prevalent in public discourse due to these concerns. There is not a better
time to analyse how our policies and production cycles are performing in relation to plastic
than now.

Our report addresses the research question: How do EU countries perform relative to each
other in their circular management of plastics and related waste products? The circular
economy, encompassing plastic, is extensive and entails several actors. Therefore, to answer
our research question, we will analyse actions undertaken by the government, businesses and
consumers that stimulate the circular usage of plastic. We will cover each stakeholder
category with a comprehensive collection of indicators to gain an extensive view of the state
of circularity in certain countries. In addition to the indicators per actor category we will also
consider country data on plastics and circularity. The respective indicators and our
methodology will be explained in more detail at a later stage in this paper.

Our research is operationalized by a scorecard. This scorecard incorporates the
comprehensive collection of the afore mentioned indicators that determine the CE
performance of the EU member states.

The goal is to measure the relative performance of EU member states in achieving circular
plastics usage in comparison to other EU countries. By doing so, policy recommendations that

                                                                                                5
address shortcomings in respective indicator performances will be formulated to stimulate
improvement and enhance the progress towards a circular economy across EU member states.

Furthermore, we hope that the provision of a CE performance ranking, based on a transparent
measurement of quantifiable indicators, will incentivize the average citizen to consider their
own habits and stimulate individual research. Likewise, the outputs of this report should
motivate analysis and policy action at both Member State and EU Commission levels. Finally,
we aim to contribute to the methodology of other institutions who have stakes in circular
economy research: The United Nations University MERIT, Maastricht University, and the
Ellen MacArthur Foundation.

Following this introduction to the CE, we engage in a sweeping literature review that tackles
CE concerns at all stakeholder levels. This is done by first further defining aspects of CE
systems, specifically related to plastic wastes. We include discussion on the economic and
political justifications for circularity, as well as current impediments and opportunities for the
implementation of CE. Furthermore, a review is conducted on how previous studies have
empirically studied the CE in order to enlighten the reader towards potentials for further
research in this field. Next, we introduce our set of indicators and the scorecard structure. This
section will also include rationales for each indicator’s inclusion. Subsequently, we report our
scorecard findings. A discussion section follows that analyses notable results and trends seen
in the scorecard reports before. The report will conclude with policy recommendations that
can help to further close the gap to full circularity of plastic usage in Europe.

                                                                                                6
7
1. Literature Review

1.1 Definition of Key Concepts

1.1.1 The Key Concept of Circularity
The circular economy has become an increasingly important facet of modern environment
policy. To fully understand what the circular economy entails it is vital to establish a clear
definition. According to Kirchherr et al (2017) there is no clear overarching definition for
circular economy. The authors analysed 114 different definitions of various practitioners and
scholars. This analysis revealed strong disparities in definition and a lack of consensus. The
author’s work further reveals that the most commonly adapted definition is that provided by
the Ellen MacArthur Foundation (2013, p.7).

       “A circular economy is an industrial system that is restorative or regenerative by
       intention and design. It replaces the ‘end-of-life’ concept with restoration, shifts
       towards the use of renewable energy, eliminates the use of toxic chemicals, which
       impair reuse, and aims for the elimination of waste through the superior design of
       materials, products, systems, and, within this, business models.”

To better assess what the Ellen MacArthur Foundation’s definition of circular economy
encompasses, it is important to further dissect the definition. The restorative and regenerative
aspect of the circular economy implies that circular economy shall be sustainable in the sense
that it aims to decrease the amount of ‘virgin’ material necessary for producing goods and
services. The current model of make-take-dispose, ergo the linear economy, is clearly not a
sustainable model as it relies on a perpetual supply of raw materials amidst finite global
resources.

Figure 1 below showcases how the circular economy is envisioned to function. The figure
shows how more utility is derived from virgin materials if circular practices are adopted to

                                                                                              8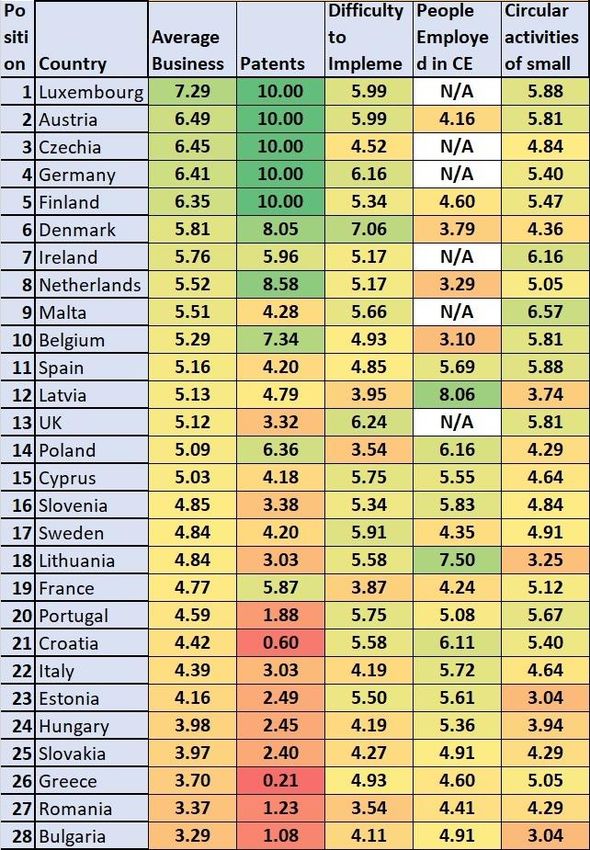
production and consumption processes. The depicted circular practices encompass both
biological and technical components.

   Figure 1: The functioning of the circular economy (Ellen MacArthur Foundation, 2013)

1.1.2 The 4R Framework & Waste Hierarchy

Following established literature, the circular economy entails two core principles: The
systems perspective and the R-framework(s). The latter functions as an implementation
guideline to circular activities. It consists of four main concepts - namely the reduction, reuse,
recycling and recovery of materials (Kirchherr et al, 2017). Specific definitions for each
aspect are provided in section 1.6.

There is also a hierarchy to the 4R-Framework. While this so-called waste hierarchy is less
implemented in practitioner’s definitions, scholars declare it to be crucial in order to
guarantee the concept’s efficiency. The proposed hierarchy puts the different 4R components
in a priority-related ranking order so that e.g. recycling only takes place if reusing is not
possible anymore. The highest priority is attributed to reduce, followed by reuse, recycle,
recover.

1.1.3 Systems Perspective

The systems perspective addresses circular economy as a holistic system that consists of a
micro-, meso- and macro system and understands the successful implementation of circular
                                                                                                9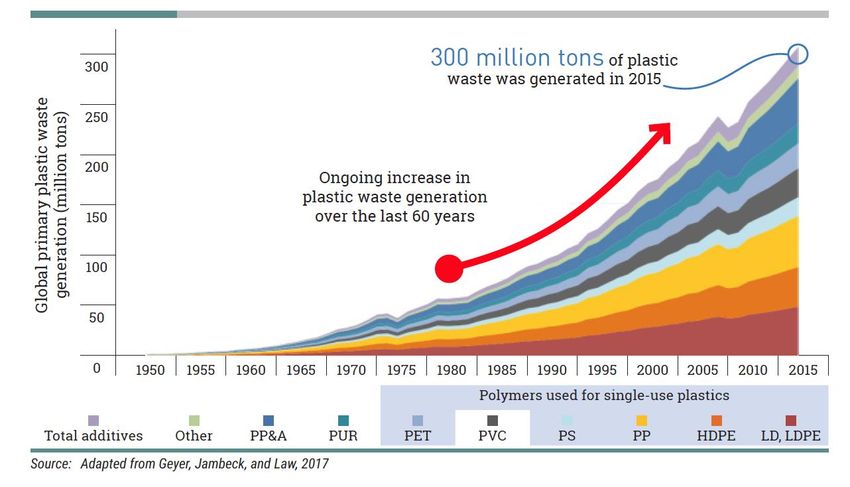
economy as a matter of change on all three levels. The micro system focuses on the product
and consumer level, the meso system focuses on adjustments at the regional level and the
macro system encompasses the structural modification of the economy and industry. The
systems perspective is well in line with the underlying principles and goals aimed for by the
concept.

1.1.4 Enablers

The circular economy comprises various stakeholders, also referred to as enablers. While the
Ellen MacArthur Foundation was the first to introduce companies as an integral part to their
definition, new business models seldom remain in the spotlight when analysing circular
activities. Further enablers are constituted by consumers and policy makers. There seems to
be a debate about which stakeholder is most important when striving for circularity. While
some argue that businesses are at the core, others mention consumers as the main drivers
(Kirchherr, 2017). To our understanding, it cannot be pointed out who is the core enabler,
since it is a holistic system and as such needs to be addressed at all levels.

1.1.5 Types of Plastic Waste

Single-Use Plastics
Single use plastics (SUPs) are often referred to as disposable plastics that are used for
packaging and include items intended to be used only once before they are thrown away or
recycled (United Nations, 2018). Hence, the definition should exclude plastic products that
are conceived or designed to accomplish multiple usages within their life span (European
Parliament, 2019b). Such items may, among others, include grocery bags, plastic bottles,
straws, food containers, plates, cups, and cutlery. Figure 2 introduces the main polymers used
to manufacture SUPs.

           Figure 2: Division of different plastic materials (United Nations, 2018)

Microplastics
Unlike organic materials, plastics do not biodegrade but instead photodegrade, thus slowly
breaking down into small fragments known as microplastics (GESAMP, 2015b). Such
fragmentation is commonly observed in coastal areas and beaches due to high UV irradiation
and abrasion by waves, while the degradation process is much lower in the ocean due to

                                                                                           10
cooler temperatures and lower UV exposure (GESAMP, 2015a). Not only do Microplastics
that entered the ocean take longer to biodegrade, they may also be consumed by maritime
organisms and thus re-enter our food value chains (Thiele & Hudson, 2018)
Bioplastics
Bioplastics are plastic substitutes made from polymers derived from plants (Lam et al 2018).
As a result, bioplastics decompose extremely fast compared to oil-based plastics, and they are
also more readily reusable and recyclable. Bioplastics are significantly less harmful to
ecosystems, though they are currently more expensive than oil-based plastics (Lam et al
2018).
1.1.6 Reduce, Reuse, & Recycling of Plastic
Reduce
Reduction strategies are twofold in that they need to address both the overall generation of
plastic products by businesses as well as consumer behaviour at lower parts of the value
chain. From a business perspective, incentives for the reduction of plastic may entail push
factors such as e.g. increased taxation or extended producer responsibility schemes (European
Commission, 2018a). Consumer incentives, by contrast, build on an understanding that long-
lasting changes in behaviour need to be voluntary and based on choice (United Nations,
2018). Consequently, a vital component of incentivising consumers to reduce their usage of
plastic and hence the generation of waste is the provision of attractive and cost effective
alternatives. Section 1.3 (Policy) and Section 1.5 (Opportunities) will delve deeper into the
specificities of such schemes.
Reuse
According to the Ellen MacArthur Foundation (2013 p. 25), the reuse of goods refers to the
“use of a product again for the same purpose in its original form or with little enhancement or
change.” According to Plastic Recyclers Europe (2018), the responsibility to reuse would
primarily lie with the consumer by finding creative and novel usages for acquired plastics.
Recycling
In the broadest sense, plastic recycling refers to the process of recovering plastic waste and re-
processing it into novel products or product components. However, the rising of share of sub-
types of plastics as well as varying degrees of recyclability complicate the creation of a single
suitable definition. To counteract this rising complexity, Plastics Recyclers Europe and the
Association of Plastic Recyclers have developed a global definition governing the use of the
term ‘recyclable’. As published by Plastics Recyclers Europe (2018), plastics should meet
four conditions to be considered recyclable.
1. The product must be made with a plastic that is collected for recycling, has market
value and/or is supported by a legislatively mandated program.
2. The product must be sorted and aggregated into defined streams for recycling
processes.
113. The product can be processed and reclaimed/recycled with commercial recycling
processes.
4. The recycled plastic becomes a raw material that is used in the production of new
products.
Recovery
The concept of recovery more specifically refers to energy recovery within waste treatment
processes that generates energy in the form of electricity, heat or fuel (Energy Information
Administration [EIA], 2018). Due to the energy generated in the process, recovery is seen as a
more preferable waste handling practice than e.g. landfilling (United Nations, 2018).
However, the EIA (2018) stresses that, in line with section 1.2, it should be considered as one
of the last options at the end of a product’s lifecycle, after reusing and recycling.
1.2 Importance of Circular Plastic Waste Treatment
1.2.1Global Developments
Since the 1950s, growth in the production of plastic has outpaced that of any other material
(Geyer, Jambick, and Law, 2017). At the current rate of production growth, the World
Economic Forum (2016) estimates that by 2050, the plastic industry may account for 20% of
the world’s total oil consumption.
Figure 3: Plastic waste generation (United Nations, 2018)
Of the total share of global plastic waste generated, the majority of it is accounted for by
packaging material, which is mostly single-use in nature (United Nations, 2018). Geyer,
Lambeck and Law (2017) further show that generated plastic packaging waste can vary
significantly when differentiating between total and per capita plastic packaging waste
12generation. Interestingly, although the EU has a greatly smaller generation of total packaging
waste, its per capita generation is very close to that of China. (Figure 4). The European
situation around plastic waste will be assessed more thoroughly in the next section.
Figure 4: Total packaging waste in absolute numbers and per capita (United Nations, 2018)
According to Geyer, Lambeck, and Law (2017), 79% of all plastic waste generated now sits
in landfills, dumps or the environment, while 12% are incinerated and only 9% has been
recycled. Apart from environmental concerns, this clear lack of circular usage of plastics also
represents a significant source of unused economic value. According to Unilever (2017),
annually, USD 80-120 Billion in economic value are lost by not recycling the profound
amount of plastics generated each year.
1.2.2 Plastic Waste Treatment
According to recent estimates by the European Parliament, the potential for recycling and
reuse of plastic waste remains largely unexploited in the EU (European Commission, 2018).
Of the 25.8 Million tonnes of plastic waste generated each year, only 30% are collected for
recycling (Plastics Europe, 2019). Conversely, landfilling and incineration rates of plastic
waste remain high at 31% and 39%, respectively (European Commission, 2018). Not only
does recycling remain a small share of plastic waste management, a significant share of
material collected for recycling also leaves the EU to be treated in third countries, where
different environmental standards may apply. As such, plastic value chains are increasingly
cross-border in nature and should thus be considered in light of international developments
such as e.g. China’s recent decision to restrict imports of certain types of plastic waste. A
schematic representation of the global value chains underlying the recycling of plastics waste
is provided by Hestin et. al (2015)
13Figure 5: Structure of plastic waste value chain model (Hestin et al, 2015)
The relatively low share of domestic recycling within the EU reflects a clear lack of cost-
effective and economically viable alternatives to landfilling, incineration, or export of plastics
waste (European Parliament, 2018a). This is further reflected by the fact that demand for
recycled plastic accounts for only 6% of total plastics demand in the EU while the share of
single use plastics has continued to rise over recent years (European Parliament, 2018a). The
presence of such low demand, insufficient recycling rates and lack of attractive alternatives
for both consumers and businesses outlines the clear need for regulatory frameworks that
incentivise a stronger circular usage of plastic waste. The next section will assess the current
state of EU frameworks and legislations in more detail.
1.3 Incumbent Policy Frameworks
From an EU policy perspective, there are three major policy frameworks that need to be
considered: The EU Plastics Strategy, the EU Single Use Plastics Directive, and the EU
Waste & Packaging Waste Directive.
EU Plastics Strategy
The EU Plastics Strategy serves as an overarching guideline on how to reduce the amount of
plastic waste being generated, as well as incentivising its reuse and recycling. More
specifically, it aims to increase the share of recycled and reused plastic in the EU, increase the
share of recycled plastic finding its way into new products, as well as raising the share of
recycled and reused plastic packaging. Additionally, the presented measures shall reduce the
share of plastic waste being generated in the EU while also increasing the attractiveness of
recycling to both businesses and consumers.
14Date Intended Policy Goal
2025 10 million tonnes of recycled plastics shall find their way into new products in
EU markets
2030 All plastics packaging placed on the EU market shall either be reusable or
recyclable in a cost-effective manner
2030 More than half of all plastics waste generated shall be recycled
2030 Sorting and recycling capacity shall have increased fourfold compared to 2015
levels. This is expected to create 200,000 jobs throughout Europe
Outstanding Develop quality standards for sorted plastic waste and recycled plastics &
make it easier to trace chemicals in recycled streams
Outstanding Restrict the use of oxo-plastics in the EU. The Commission has requested the
European Chemicals Agency to review the scientific basis for taking
regulatory action at EU level
Outstanding Process to restrict the use of intentionally added micro plastics, by requesting
the European Chemicals Agency to review the scientific basis for taking
regulatory action at EU level
Single Use Plastics Directive
The Single Use Plastics Directive’s objectives clearly follow the objectives outlined by the
EU Plastics Strategy. In essence, its approach is two-pronged. For one, it aims to promote the
transition to a circular use of plastic waste through innovative and sustainable business
models, products and materials. Secondly, it serves to promote the usage of reusable products
opposed to single-use products, thus reducing the quantity of waste generated.
Date Intended Policy Goal
3 October The Commission shall request EU standardisation organisations to develop
2019 harmonised standards relating to the requirement referred to in Article 6(1)
153 July 2020 The Commission shall publish guidelines, in consultation with Member
states, including examples of what is to be considered a single-use plastic
3 July 2021 Member states shall notify the Commission of rules on penalties applicable to
infringements of national provisions adopted pursuant to this Directive
3 July 2021 Member States shall prepare a description of the measures which they have
adopted pursuant to the first subparagraph, notify the Commission and make
it publicly available
3 July 2021 Member states shall bring into force the laws and regulations required to
comply with this Directive. However, member states shall apply the measures
necessary to comply with Article 6(1) by 3 July 2024, Article 8 by 31
December 2024, but in relation to SUP products listed in Section III of Part E
of the Annex by 5 January 2023
2025 Beverage bottles listed in part F of the Annex should contain at least 25%
recycled plastic. This threshold shall be raised to 30% by 2030.
2026 Measures towards consumption reduction as outlined in Article 4 shall
receive a measurable reduction in the consumption of SUP products listed in
Part A of the Annex by 2026 compared to 2022
3 July 2027 The Commission shall carry out an evaluation of this directive
EU Waste & Packaging Waste Directive
Overarching objectives of this Directive include increasing the recycling of packaging waste
as well as reducing the waste’s environmental impact. This shall be achieved through
extended Producer Responsibility Schemes as well as reducing the EU’s import dependency
on imported plastic raw materials. Moreover, the Directive aims to set long-term objectives
for waste management and set clear direction for required investments
16Date Intended Policy Goal
31 December A minimum of 65% by weight of all packaging waste shall be recycled
2025
31 December No later than this date, the following minimum targets shall be met: (1)
2025 50% of plastic
(2) 25% of wood
(3) 70% of ferrous metals
(4) 50% of aluminium
(5) 70% of glass
(6) 75% of paper & cardboard
31 December A minimum of 70% of weight of all packing waste will be recycled
2030
31 December No later than this date, the following minimum targets shall be met:
2030 (1) 55% of plastic
(2) 30% of wood
(3) 80% of ferrous metals
(4) 60% of aluminium
(5) 75% of glass
(6) 85% of paper & cardboard
1.4 Current Main Impediments
1.4.1 Operational Barriers
Villalba (2002) developed an index measuring the deteriorating quality of plastics after
recycling. ‘Deteriorating quality of plastics after recycling’. This index, which is measured by
a ratio of the value of recycled material to the value of its virgin state, shows that recycled
plastics typically are less valuable than new plastics. The indicator takes a value of 1 for when
the value of the recycled material is equal to a brand new material. Furthermore, the index can
change as valuations change. While some materials such as steel can have an index higher
than 1, that is not usually the case for any type of plastic. Policy intervention is needed to
keep recycled plastic competitive as plastics typically have a recyclability index lower than 1
(Villalba, 2002).
Furthermore, plastic collection is lacking as only 41% of the packaging waste is collected for
recycling. Increasing this rate is essential for a circular economy. Existing methods and
guidelines for glass and paper can be used as a model (Hestin et al, 2015). Additionally, the
number of sorting and recycling facilities need to be improved upon. Hestin et al (2015) show
that a moderate amount of investment can lead to high environmental and societal benefits
17through improved economies of scale and reduction of waste exports. Hestin et al measure
that to achieve 2020 EU goals, net costs of 1.1 billion euro a year are needed. An option could
be to improve intra-European waste management. However, this could skew this research
paper’ indicators as recycling rates of countries with a high amount of recycling facilities
would appear as further along in the implementation of circular economy.
1.4.2 Policy Barriers
Besides operational barriers, there are policy implementation barriers as well. Di Maio et al
(2015) determine a key barrier in the policy implementation and evaluation of circular
economy to be the lacking precision of indicators. Indicators for the recycling rates of
materials and products have been calculated inconsistently, thus often overestimating the
amounts actually recycled. Therefore, Di Maio et al propose the Circular Economy Index
(CEI) which is the ratio of the material value produced by the recycler (market value) divided
by the material value entering the recycling facility. This indicator has the benefit of adjusting
to substitution of materials in case of price changes while staying simple to calculate. In order
to calculate the CEI accurate data from recycling plants is necessary.
The need for a sound and standardised indicator is further stressed by Hestin et al (2015),
advocating for increased accountability and transparency in the way data is calculated since
the reporting of recycling rates is currently voluntary by recyclers. Exporting waste to be
recycled abroad could further skew the actual recycling rates as foreign recycling standards
may differ significantly. Requiring certifications of international recyclers could be made
mandatory but appears not to be translated into specific policy action.
Hennlock et al (2015) identify the limitations of recovering plastic products in order to reduce
their usage. High taxes could lead to producers and consumers substituting other products
with equal or higher externalities. Likewise, efforts to full recovery rates may reduce
sustainability, as the costs to collection and processing plastic may be socially inefficient.
Recovery strategies should therefore be carefully considered and only implemented if the
efforts improve social efficiency and sustainability. Hennlock et al suggest a two-tiered
system that focuses on reducing the pool of products produced and then aiming for high, but
not full recycling.
1.4.3 Firm Barriers
Hestin et al (2015) report lacking demand in recycled plastics as a barrier for plastic recycling
companies. The quality of recycled plastic has to be increased and more uses for it have to be
found, while ensuring a competitive price. This can be done through policy incentives like
subsidies and improved plastic waste quality assurance.
Kirchherr et al (2017) conducted a survey with businesses, governments and circular
economy experts. They found that a major barrier to the implementation of circular economy
stems from cultural barriers. This includes lacking consumer interest and hesitant company
culture. Businesses encounter problems attempting to apply circular economy concepts in a
18linear economy as suppliers and retailers have limited knowledge of circular economy and
thus rarely incorporate circular economy strategies.
Schaltegger & Figge (2000) highlight that corporate actions regarding environmental
protection will only go as far as is required to protect shareholder value. The differences
between a shareholder valuation and societal valuations of environmental protections are
directly related to the public policy decisions surrounding this system.
1.4.4 Information Asymmetries
Information asymmetries between suppliers of plastic and the purchasers of recycled plastics
constitute another reason why the adoption of circular economy practices towards plastic
recycling faces barriers. Hennlock et al (2015) writes that both sellers and buyers of recycled
plastics face negative effects of adverse selection. Sellers of low quality plastics and high
quality plastics are treated equally by the purchaser of plastics because the purchaser does not
have the same information about the plastic quality. Because of the information asymmetry,
purchasers are cautious when buying recycled plastic as quality may be low. Therefore, the
purchaser will likely try to pay the lower price for plastic - fostering producers to only create
lower quality plastic as the information asymmetry will prevent proper pricing of high quality
plastics - making them less profitable. This is assuming that the cost of recycling high quality
plastic is higher than the cost of recycling low quality plastic.
Related to this information asymmetry problem is another barrier highlighted by Messenger
(2017). The author states that one of the biggest reasons for lower adoption rates of recyclable
plastic as a raw material is that producers have difficulties finding high quality recycled
plastics to use in their products. This is partly a result of the information asymmetry where
low quality plastic production is fostered and high quality plastic production lags behind. The
logic flows as follows: due to information asymmetry, lower quality plastic recycling is
promoted while higher quality plastic recycling lags behind - meaning that producers who
rely on high quality plastics have difficulties sourcing that plastic from recyclables, which
means adoption of recycled plastic lags behind.
1.5 Potential Opportunities
Apart from environmental and economic considerations, a well executed circular strategy
around plastics may enable a range of potentially valuable synergies.
1.5.1 Policies
Plastics have the potential to be recycled many times while retaining their value and
functional properties. However, as highlighted by Hestin et al (2015) and the European
Parliament (2018a), a large share of plastic is currently not recycled, landfilled or incinerated
19for energy recovery. Increased recycling performance, as per proposed EU targets, could save
up to 8 Mt of GHG emissions per year by 2020 and up to 13 Mt by 2025.
Job creation with a rising population is considered to be a high priority for various policy
makers at this time. It is estimated that nearly 50,000 new jobs could be created directly in the
recycling value chain of plastics by 2020, with over 75,000 additional indirect jobs supporting
the sector and its operations. By 2025, employment could increase considerably by 80,000
direct jobs and 120,000 indirect jobs (European Parliament, 2018a). Figure 6 below shows the
magnitude of potential job creation.
Figure 6: Number of extra direct jobs created along the plastic recycling value chain in
Targets2020 and Targets2025 (Hestin et al, 2015)
1.5.2 Cost Reductions & Fiscal Incentives
Monetary incentives often act as a motivation to get the attention from corporates. According
to the World Economic Forum, plastic packaging waste represents an $80–120 billion loss to
the global economy every year. New, innovative delivery models and evolving use patterns
are unlocking a reuse opportunity for at least 20% of plastic packaging (by weight), worth at
least USD 9 billion (Unilever, 2017). Section 5.3 goes into more details about such business
models.
A McKinsey (2017) study of 28 different industries found that at least 10 can adopt 5 or 6
circular activities and that all analysed industries can benefit by adopting at least 3 or 4
activities.
20Figure 7: Circular economy activities, cost reduction & performance improvement
(McKinsey, 2017)
1.5.3 Business Practices
Circularity around plastics brings about potential economic benefits for businesses. If
practiced ethically, businesses have a lot to gain as highlighted by a variety of sources. The
Ellen MacArthur Foundation (2017) evaluated the actions required to create a positive
transition around circular use of plastics. The identified actions cover top down approaches
with business enterprises driving the changes.
There is a push for business enterprises to recreate a positive design which is easier to
recycle/reuse (Unilever, 2017). Plastics Europe (2019) stress the importance of increasing
efficiency when the responsibilities are shifted to the producers. Villalba (2002), showcases
that the sector is mostly market driven but with proper incentives, efficiency can be
increased.
In their 2017 case study, Unilever e.g. introduced a new category of plastic packaging which
achieved a significant reduction of annual plastic usage. As such, designing for circularity at
the very beginning of a product’s value chain is essential in enabling subsequent steps of
reuse and recycling.
1.5.4 Consumer Incentives
The circular economy is such an all-including system as essentially everyone will be affected
by the system. Therefore, not only producers, but also consumers are an important part of the
21circular economy value chain. Consumers are the people that use recycled plastic and also the
people that have to make sure that plastic, once used, returns to the producers of plastic
products so that the plastic can start a new life. If these consumers neglect sorting their trash
well, not only will there be less plastic to recycle, the quality of the recycled plastic would
also be worse due to contamination. This means that plastic recycling companies will lack
access to enough plastic to recycle meaning producers of plastic will again have to look for
more virgin materials to create new plastic products.
To increase consumer engagement with recycling plastics, they need to be incentivized to
properly dispose of plastic waste. This incentive schemes can be achieved in multiple ways.
For example, consumers could be punished or rewarded for properly/improperly disposing of
waste. They could also be rewarded for using less plastic and instead use other more
sustainable materials. Prices of non-circular goods can also be increased to incentivize
consumers to instead buy more sustainable products. Furthermore, consumers can be
incentivized through ‘green’ packaging to choose the environmentally friendly choice.
An example of when consumers were incentivized to use less plastic is when plastic bag taxes
were introduced. In an effort to reduce the use of single use plastic bags, many countries have
started enforcing laws that require either a complete ban of plastic bags or they require that
plastic bags have to be sold for a certain price or at least not free. Ireland is a success story of
how a levy on plastic bags reduced consumption of plastic bags by 90% (Nielsen et al, 2017).
Other examples include Schotland (80%), Portugal (74%), Belgium (86%).
Linderhof et al (2019) determine that deposit return schemes (DRSs) are extremely useful at
incentivizing consumers to return their used bottles. They name the success of the
Netherlands where a DRS for large bottles has achieved a 95% recycling rate for these bottles.
In their paper Linderhof et al argue that also other products would benefit from a DRS, such
as batteries.
Gitlitz (2013) shows that that DRS is an effective way of increasing the recycling rates. She
compares the recycling data of states with and states without DRSs in place. The data points
out that states with DRS have average recycling rates of 70.2% while states that do not have
DRS in place reach recycling rates of 27.6% on average.
Moreover, sustainable packaging does help in increasing the consumer likeliness to buy more
circular goods. Rokka & Uusitalo (2008) determine that sustainable packaging has a positive
influence on the preference of a consumer. In their conjoint analysis they find that sustainable
packaging is an important factor in the decision making process of a customer. If packaging is
clearly made from more sustainable materials, consumers are more likely to buy them.
1.5.5 Demand for Plastic Waste
The use of bioplastics represents an opportunity to replace conventional plastics with a less
persistent, degradable solution (Lam et al, 2018). Bioplastics have the additional quality of
22acting as a carbon sink (Owen, Brennan, & Lyon, 2018). As bioplastics require plant material,
CO2 is removed from the atmosphere and processed into a solid good. At the end of
bioplastic’s lifespan, they can be recycled back into the system, or reused for ecological
purposes, for example, as fertilizer (Lam et al 2018).
1.6 Requirements to Realise a Transition Towards Circularity
As evident from previous sections, realising an effective transition to circular practices
requires the coordination of a multitude of stakeholders. A particular challenge in realising
such transition stems from the fact that the interests of both producers and users of plastic
need to be aligned in a common legal framework. While producers may be largely driven by
cost and operational considerations, consumers may e.g. demand more environmentally
friendly practices, thus creating conflicting incentive structures. This, in turn, complicates the
exact pinpointing of barriers that hamper the transition towards a circular economy. To
address the prevailing dynamics among the various stakeholders, and identify conditions
necessary for a circular transition, this research will draw upon the multi-level perspective
established by Geels (2004).
As the concept of the circular economy interlinks both society and technology, it can be
classified as a socio-technical system (Geels, 2004). In such a multi-faceted environment, it is
vital to consider the interactions between the different entities interacting with one another.
Figure 8 (Geels, 2004), serves to showcase the fundamental interactions around the socio-
technical system.
23Figure 8: Socio-Technical Transition Framework (Geels 2004)
Clearly, socio-technical systems do not exist in isolation but are embedded in an ongoing
feedback loop between Rules & Institutions as well as Human Actors, Organisations, and
Social Groups. Hence, on their own, stringent policies, innovative technological solutions, or
committed citizen initiatives will not have a lasting impact on circularity, unless executed
with a clear understanding of surrounding dynamics and stakeholders.
Building on the interaction of the presented factors, Geels & Schot (2007) propose the
following framework to capture the dynamics inherent in a socio-technical regime transition.
As showcased by figure 9, there are three key factors that need to be considered.
Figure 9: Extended Socio-Technical Transition Framework (Geels & Schot, 2007)
24In essence, the multi-level perspective argues that transitions occur through interactions
between processes at these three levels (Geels & Schot, 2007). Niche innovations build up
internal momentum through various channels. These can include learning processes, price /
performance improvements, and support from powerful groups such as e.g. lobbying from an
industry or citizen perspective. Next, changes at the landscape level create pressure on the
existing regime. The increasing destabilisation of the regime in turn creates opportunities for
niche-innovations to affect the prevalent socio-technical regime. Finally, the alignment of
these processes enables these novelties to enter the mainstream market where they compete
with and possibly overtake the existing regime.
In the specific context of a circular management of plastic and related waste products in the
EU, it is vital to understand the interactions between relevant stakeholders in achieving a
transition of the current, largely linear economic, socio-technical regime. To this end, an
adapted framework was created. By doing so, the framework shall allow for an assessment of
incumbent dynamics as well as the identification of specific actions needed to advance the
level of circular practices in the EU.
Figure 10: Dynamics between key circular economy stakeholders
25Policies / Regulations:
Policies and regulations clearly have a widespread impact on all relevant stakeholders. For
both industry / business as well as citizens / consumers, they play a vital role in shaping the
set of rules under which different entities interact. This influence can take the form of both
incentives or levies to stimulate or reduce economic activity, respectively.
Towards the industry / business sector, incentives may e.g. include subsidies or government
grants to ensure the undertaking of products which would not be commercially viable on their
own. Penalties or fees, on the other hand, may be constituted by industry standards to restrict
certain operations or strict fees to disincentives e.g. environmentally harmful undertakings.
Concerning consumers, the underlying principle of incentives or fees remains largely similar.
Regulations may e.g. subsidise environmentally harmful products while levying taxes on
single-use plastic products to disincentive their usage.
Apart from businesses and consumers, policies and regulations exert a strong influence on
science and academia. As an example, the policy focus of a given country strongly affects the
scope of research as well as the amounts of government funding allocated to certain sectors.
Citizens / Consumers:
Although subject to the policies and regulations in place, customers / citizens are not inaptly
exposed to the government’s influence. They are capable of shaping of policies and
regulations through both elections or initiatives such as citizen lobbying. While the latter has
only recently gained popular attention in the EU, it is a force that is not be neglected
(Alemanno, 2017).
Operations of the industry / business sector are not exempt from the influence of customers /
citizens. In fact, their operations are largely coined by assessing to customer preferences and
responding to developments in their market environment. As shown by the World Economic
Forum (2016), recent years have witnessed a burgeoning number of companies that put
environmental and social concerns at the core of their business in response to shifting
customer preferences.
Towards science / academia, the exerted influence is arguably more of an indirect nature.
Nonetheless, customer preferences and citizen initiatives undeniably have an effect on the
scope of research carried out in a particular country (Alemanno, 2017).
Business / Industry:
Not only is the business / industry sector subject to policies and regulations, it also exerts
significant influence on them through targeted lobbying efforts. As shown by Alemanno
(2017), lobbying expenditures have starkly increased over recent years and constitute a
critical force towards policies and regulations. Rather than trying to alter policies, businesses
may also evade certain rules or restrictions by locating part of their operations outside the
EU.
26Clearly, businesses have a close-knit relationship with prospective customers. While business
and industry indeed react to customer preferences, they can also improve the price and
performance of technologies that were previously not in high demand due to e.g. lacking
performance or overly high cost. Examples include e.g. renewable energy or electric vehicles
that only recently became competitive and cost-effective enough to compete with incumbent
technologies.
These improvements in cost and performance were not possible without a strong involvement
of science and academia. While a plethora of research is clearly carried out independent of
industry interests, commercial motives arguably do have a distinct impact on the scope of
research through both funding as well as knowledge spillovers from industry / business to
science / academia and vice versa.
Science / Academia:
As mentioned before, there are strong interactions between science / academia and the
commercial sector. While the scope of research may be influenced by business / industry,
scientific developments and breakthroughs exert profound influence on commercial
operations through cost or performance improvements (UNEP, 2018). Examples may include
increasing advances in e.g. bioplastics, recycling technologies, or renewables that were
previously not competitive from a commercial perspective.
Towards policies / regulations, new scientific developments also affect the need for adapted
or novel legal frameworks. At the same time, scientific and academic experts play a vital role
in advising the drafting and implementation of novel policies and regulations.
Finally, science and academia distinctly affect citizens / consumers through education at
different levels as well as channelling awareness towards particular areas.
1.7 Existing Methodologies
One of the central goals of economic analysis is to create recommendations for the future.
Evidence for a proper policy direction to take is bolstered by the inclusion of hard data and
econometric modelling. In a report prepared for the European Commission (“EC”), Mudgal et
al (2011) analysed the share of plastic waste being recovered in the EU. Based on metrics
gathered from the EC Waste and Packaging Waste Directive, researchers built a baseline
database out of recovery rates from 1995-2008. Then, based on an anticipated GDP growth
rate of 2.1% annually, projections were made to 2015 and 2020. The authors admit that these
estimates do not account for significant factors to the waste recovery system, and that the
linear nature of the projections may not be accurate.
Looking in closer than projection models, it is important to create and standardize indicators
for promoting a circular economy. Instituting such an indicator would aid policy
determination of state actors. Di Maio & Rem (2015) devised the Circular Economy Index
27(“CEI”), a ratio of the values of recycled products to the costs needed to reproduce such
goods. Classic “recycling rate” metrics typically overvalue the circularity of a system, as there
may be material losses during the recycling process. Furthermore, as the CEI measures
valuations of materials, it is more responsive to market and technology changes than recycling
rates would be. The CEI represents a possible indicator for our studies.
Other sources of economic modelling focused themselves on more specific factors to
analysing the circular economy of plastic. Villalba et al (2002) utilized economic
fundamentals of price depreciation to develop a “recyclability index” of various materials.
The value of virgin material was compared to the values of used material, and then to
recycled material. By incorporating annual data through the 1990’s. the paper accounts for
changes in the business cycle. The result of this process was a dollar quantification of the
ability for a recycled product to reacquire its original characteristics and value. Most
importantly, it shows recyclability is driven by market conditions specific to the cost of
recycling relative to producing virgin material.
In an analysis on the Dutch recovery system, Bing, Bloemhof-Ruwaard, & van der Vorst
(2014) compared the societal sustainability against the efficiency of the recovery process. The
model is very complex, incorporating explanatory variables of transportation factors and
processing centre characteristics. Furthermore, market conditions and system efficiency are
described. The paper aims to minimize the summation of many of these factors. As a result,
they claim a 25% increase in sustainability without reducing efficiency. This process indicates
that there should be additional weight given to how the system is run. Perhaps a fully circular
economy based on recovery rates would miss net losses due to an unsustainable system
design.
From reviewing empirical methods to studying the circular economy of plastic, there are
several considerations to take note of for any future models. Firstly, there should be a cost
evaluation between the recycled material and its virgin state. Most importantly, the cost
evaluations help to explain trend variations, as well as represent a better metric for recovery
rates. Secondly, we propose the inclusion of sustainability as an important factor to the
system. An efficient circular system may have a net negative social effect, which should be
avoided. Finally, it seems reasonable to scale circularity by the size of the target economy, as
measured by GDP.
2829
30
2. Methodology, Limitations & Future Research
In order to map the gap to a circular usage of plastics, a set of indicators was developed. In
order to establish a holistic analysis, the indicator set was constructed with four main sub-
categories included. In order to make relevant and effective policy advice possible the
categories were defined to be Plastic-Benchmarks, consumers, industry and government. Each
category covers an important aspect of the circular economy, and all must be addressed in
order to achieve meaningful progress towards a circular usage of plastics. While this set of
indicators is tailored towards mapping the circular use of plastics, the method can be adjusted
towards other resources or be expanded into a more general circular economy indicator.

The countries being analysed are the European union 28. While including Norway could be
interesting for comparisons it was excluded in this research as there are data-limitations at
present. Lichtenstein was excluded for similar reasons and additionally its small size made
population adjustments unreliable and a large share of its recycling is outsourced into
neighbouring countries.

On the basis of the four chosen categories a cross sectional data set was constructed.
Similarly, to the process of choosing the categories, the indicators were chosen to allow an
expansive view on the relative positions of the EU-countries in their progress towards a
circular plastic use. The indicators chosen, and their relevance will be presented in the
upcoming section.

Once the Data set was constructed each indicator was normalized to a value between one and
ten in order to make different indicators comparable (detailed explanation in appendix). This
resulted in a score for each country in each indicator, making it possible to analyse the
detailed position of a country in each single measure. Using the scores for the indicators, an
average was taken of the indicator scores of a subsection resulting in a score for each sub-
category (benchmark, consumer, industry, government). These subsection-scores allow a
broader view of a country’s strengths and weaknesses. Appendix C provides a detailed
description of the research’s specific quantitative methodology.

Finally, to create the final scorecard an equal weighted average of the four categories was
calculated. This normalized score, the Plastics Circularity Index (PCI), gives a measure of
assessing the progress of a country towards circular usage of plastics. An equal weight of each
sub-category was used to calculate the final score. Using an equal weight for each sub-
category gives a balanced view of the identified aspects of the circular economy. Different
weights can be placed depending on the specific research question and the identified
importance of each sub-category. We invite future researchers to utilize the developed
framework and adjust it to their research.

The calculated scorecard allows policymakers and researchers to quickly gain an
understanding of the relative standings and shortcomings of each included country. To further
facilitate an accessible, meaningful and informative presentation of the resulting data the
scorecard was designed to be colour coded and ordered by standing in the relative results.

                                                                                            31
You can also read