Public Rate Hearing on 2022 Recommended Rates - Barry Gilway, President/CEO and Executive Director March 31, 2022 - Citizens ...
←
→
Page content transcription
If your browser does not render page correctly, please read the page content below
Public Rate Hearing on 2022
                      Recommended Rates
Barry Gilway, President/CEO and Executive Director

                                  March 31, 2022
Market Conditions and Impact to Citizens

Due to current market conditions, the capacity to provide property insurance by
private insurers is diminishing in Florida.

As a result of the lack of capacity in the private market, Citizens is growing
exponentially.

Exacerbating Citizens’ growth is its competitive position in terms of rates. 99% of
Citizens’ HO-3 policies are priced lower than the average private market rate.

There is a danger that Citizens could return to the level of 2011, where there was an
assessment risk of $11.6B to Floridians in the event of 1-in-100 year event.

“We just want to be solvent so when a CAT event comes, we are not sticking
Floridians with Citizens’ assessments across the state. That is my mission.”
                                                    ~ Citizens’ Chairman Carlos Beruff
                                                      Board of Governors 3/23/22 meeting

  1
Financial Trends for Selected Florida Insurers ($000)

 Source: S&P Global Market Intelligence, FL domestic and foreign companies with large homeowners FL business

  2

Companies Halting Business in Florida

Restricting new business and cancelling/non-renewing business
Companies continue to file stronger restrictive underwriting guidelines such as:
 ‒ Limits on new business/renewals based on location
 ‒ Age of home
 ‒ Age of roof
 ‒ Required minimum Coverage A limit
 ‒ Limited water loss coverage

Higher and more frequent rate increases
Clearinghouse results have significantly declined
                     New Business                               Renewal Business
        Private Carrier    CPIC     Private Carrier   Private Carrier    CPIC     Private Carrier
           Quotes         Quotes     Quote Rate          Quotes         Quotes     Quote Rate
 2017        74,641       209,651        36%               23,001       252,867        9%
 2018        71,659       218,932        33%               19,747       264,011        7%
 2019        79,397       227,396        35%               12,132       260,038        5%
 2020        94,216       499,022        19%                 4,324      314,891        1%
 2021        86,936       813,404        11%                 3,137      253,740        1%

  3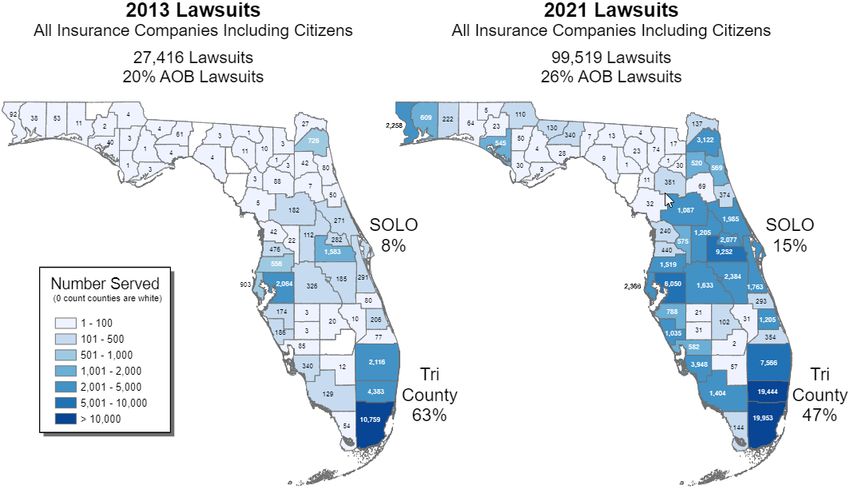
Policies in Force and 2022 Yearend Projection

 4

Rapid Policy Count Growth

In 2021, Citizens’ latest 12-month new business average is 32K policies per month
In 2020, Citizens’ latest 12-month new business average was 15K policies per month

  5
Citizens’ and the Industry’s Litigation

 Source: “Service of Process Reports” (LSOP Reports), Florida Department of Financial Services, December 31, 2013 & 2021
  6
Citizens’ HO-3 Competitive Position

99% of Citizens’ HO‐3
policies are LESS than the
average competitor’s
approved rates effective
10/1/21 using Citizens’        Green areas indicate
9/30/21 policy data.           Citizens’ rates are
                               competitive

The industry continues the
2-year trend of filing large
rate increases, many
greater than 11%. This
further exacerbates the gap
between Citizens’ rates and
the industry.
                                There are no HO-3 policies in
                                areas shaded black

 7
Industry Homeowners Rate Filings
Direct Written Cumulative
Approved Rate
Premium Rate
Company Name Change %
in millions Change %
2020 2020 2021 2020-2021
Universal Property & Casualty Insurance $ 1,159.4 13% 16% 31%
State Farm Florida Insurance Company $ 671.0 0% 5% 5%
Heritage Property & Casualty Insurance Company $ 409.4 15% 8% 24%
First Protective Insurance Company $ 357.8 5% 10% 16%
FedNat Ins Co $ 356.0 8% 17% 26%
ASI Preferred Insurance Corporation $ 353.7 35% 0% 35%
Homeowners Choice Property & Casualty Insurance Company $ 316.7 12% 0% 12%
Tower Hill Signature Ins Company $ 305.3 14% 0% 14%
Federal Insurance Company $ 260.8 9% 4% 12%
United Services Automobile Association (USAA) $ 249.1 0% 0% 0%
Family Security Insurance Company $ 242.5 65% 0% 65%
United Property & Casualty Insurance Company Inc. $ 189.5 12% 15% 28%
Tower Hill Prime Insurance Company $ 165.2 26% 0% 26%
Tower Hill Preferred Insurance Company $ 135.9 14% 0% 14%
USAA Casualty Insurance Company $ 129.0 0% 0% 0%
Castle Key Indemnity Company $ 102.3 0% 15% 15%
Castle Key Insurance Company $ 91.0 0% 13% 13%
TypTap Insurance Company $ 90.2 14% 0% 14%
American Strategic Insurance Corporation $ 71.1 28% 0% 28%
8Citizens’ Competitive Position Percent Differences by Territory Source Data: Rate comparison using competitors approved rates effective 10/1/21 using Citizens’ data as of 9/30/21 9
Citizens’ Competitive Position – Tri County

                                                                                 HO-3 Average Premium Citizens & Competitors

 Citizens’ HO‐3 average premium is
 28% LESS than the competitors in
 the Tri County

 52% of Citizens’ policies are in the
 Tri County

      Source Data: Rate comparison using competitors approved rates as of 10/1/21 using Citizens’ data as of 9/30/21.
      NOTE: This is a subset of carriers identified as active in the Tri County region 11/15/18.
 10
Risk and Assessment Trend
Notes:
1. Storm Risk is as measured by 1-in-100 year probable maximum loss (PML) plus estimated loss adjustment expenses using the Florida Hurricane Catastrophe Fund
(FHCF) account allocation where PLA and CLA are combined. PLA/CLA combined PMLs are added to the Coastal PMLs to be consistent for surplus distribution. In
general, the PMLs presented are as projected at the beginning of storm season; with the exception of 2017 which is as of August month end.
2. Surplus and Assessments are as projected at beginning of storm season. Not all PLA/CLA surplus is needed to fund storm risk in 2014. In 2015 - 2021, not all surplus
in PLA/CLA and the Coastal Account is needed to fund storm risk. Remaining surplus is available to fund a second event. VALUES ARE NOT
3. Florida Hurricane Catastrophe Fund (FHCF) is as projected at beginning of storm season; with the exception of 2017 - 2021 which are Citizens' initial data submission DRAWN TO SCALE
to the FHCF.
4. Depop PMLs are not included in storm risk totals and are presented as year end totals.
5. PMLs from 2011-2014 use a weighted average of 1/3 Standard Sea Surface Temperature (SSST) and 2/3 Warm Sea Surface Temperature (WSST). 2015 - 2021
PMLs reflect only SSST event catalog. Beginning with 2021, PML results displayed are 50K US Hurricane, Florida Regulatory (SSST) Event Set.
6. Pro Forma 2022 Private Risk Transfer coverage is based on the budget reinsurance spend of $400 million. The actual coverage and premium may vary significantly
based on actual layers of coverage purchased.
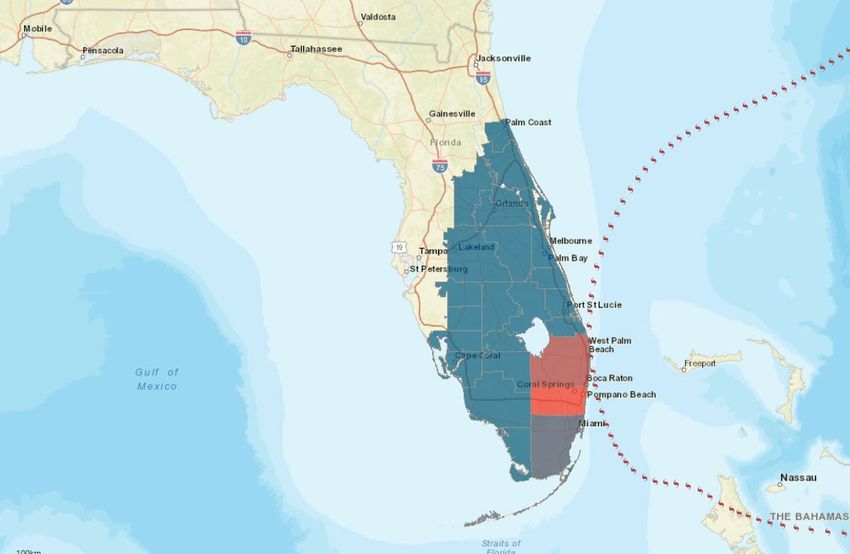
11Surplus Depletion Scenario: 1M Policies
($ in millions) 1st Storm
Potential Path for Hurricane Irma
2nd Storm
Potential Path for Great Miami
Hurricane of 1926
$14.5 B in potential assessments resulting from 2 Category 4 storms
12Surplus Depletion Scenario: 1.3M Policies
($ in millions) 1st Storm
Potential Path for Hurricane Irma
2nd Storm
Potential Path for Great Miami
Hurricane of 1926
$18.8 B in potential assessments resulting from 2 Category 4 storms
132021 Impact of Recent Storms to Citizens’ Surplus
Direct Loss/Loss Adjustment Expenses
Account
12/31/21 Ultimate 12/31/20 Ultimate 2021 Incurred
PLA $1,458,504,325 $1,253,996,025 $204,508,301
CLA $51,596,503 $45,157,127 $6,439,376
Coastal $1,121,938,983 $1,061,175,570 $60,763,413
Total $2,632,039,812 $2,360,328,722 $271,711,090
Large hurricane losses are not hypothetical
In 2021, Hurricane Irma, Tropical Storm Eta, and Hurricane/Tropical Storm Sally,
combined for $272M of direct loss and loss adjusting expenses.
After accounting for reinsurance, Citizens’ surplus was reduced by close to $200M.
The driving force of the increased costs from older storms is late reported claims
and litigation.
14Public Rate Hearing on 2021
Recommended Rates
Brian Donovan, Vice President – Chief ActuaryMarket Conditions and Impact to Citizens Florida Property Market is in Poor Health – Insurers are shedding policies due to very poor results; availability is an issue Citizens rates are cheaper – Even with an 11% increase, Citizens remains cheaper than the private market. Some companies have been taking multiple rate changes much greater than 11% in a given year. Steep Growth – The overall poor health of the market coupled with the very competitive rates is driving extreme growth for Citizens at inadequate rates. Pressure on Surplus / Claims Paying Ability – Premium shortfall based on in-force premium used in the indication is close to $400M. Based on current projections of growth, the premium shortfall will be closer to $780M by the end of 12-31-2022. 16
Risk and Assessment Trend

      Notes:
       1.   Storm Risk is as measured by 1-in-100 year probable maximum loss (PML) plus estimated loss adjustment expenses using the Florida Hurricane Catastrophe Fund
            (FHCF) account allocation where PLA and CLA are combined. PLA/CLA combined PMLs are added to the Coastal PMLs to be consistent for surplus distribution. In
            general, the PMLs presented are as projected at the beginning of storm season; with the exception of 2017 which is as of August month end.
       2.   Surplus and Assessments are as projected at beginning of storm season. Not all PLA/CLA surplus is needed to fund storm risk in 2014. In 2015 - 2021, not all surplus
            in PLA/CLA and the Coastal Account is needed to fund storm risk. Remaining surplus is available to fund a second event.                                                 VALUES ARE NOT
       3.   Florida Hurricane Catastrophe Fund (FHCF) is as projected at beginning of storm season; with the exception of 2017 - 2021 which are Citizens' initial data submission   DRAWN TO SCALE
            to the FHCF.
       4.   Depop PMLs are not included in storm risk totals and are presented as year end totals.
       5.   PMLs from 2011-2014 use a weighted average of 1/3 Standard Sea Surface Temperature (SSST) and 2/3 Warm Sea Surface Temperature (WSST). 2015 - 2021
            PMLs reflect only SSST event catalog. Beginning with 2021, PML results displayed are 50K US Hurricane, Florida Regulatory (SSST) Event Set.
       6.   Pro Forma 2022 Private Risk Transfer coverage is based on the budget reinsurance spend of $400 million. The actual coverage and premium may vary significantly
            based on actual layers of coverage purchased.

 17
Proposed Rate Change Actuarial soundness has two components: overall, and individual. Overall actuarial soundness is when Citizens is charging enough overall premium to pay its total expected costs of providing insurance. Individual actuarial soundness is when an individual policyholder’s premium is equal to the expected cost of providing that single insurance policy. To mitigate the growing pressure to Citizens’ financial position, we recommend implementing the highest rate increase allowed by law. Still no policyholder would see an increase greater than 11% in 2022. Our recommendation complies with the Florida Statutes, but it also prioritizes moving Citizens to overall actuarial soundness first. The proposed rate change is 10.6% while the indication is 36.5%. 18
Statewide Rate Indications

                            Uncapped Rate         Proposed Rate
                              Indication             Change

          Personal Lines        34.9%                10.7%

       Commercial Lines         67.7%                10.0%

                   Total        36.5%                10.6%

Where appropriate, the recommended rate change is 11%.

The recommended rate change for sinkhole is 0%.

 19
Appendix 20
Notes for Slides 12 and 13

Surplus Depletion Scenario Notes & Assumptions

1) Surplus is projected as of 12/31/2021 with adjustments to account for reinsurance spend. It is
   assumed that any change to surplus resulting for the specific scenario reinsurance spend is offset by
   the change in net income resulting from a change in policy count.
2) In determining the storm impacts for each scenario, the Probable Maximum Loss (PML) is adjusted
   proportionally to project the increase in policy count. Initial PMLs for each storm are based on actual
   12/31/2021 exposure.
3) In each scenario, Additional Claims Paying Resources reflect a risk transfer program consistent with
   that proposed in the budget for the 2022 storm season adjusted to cover 50% of the Coastal Account
   and 44% of the Personal Lines Account (PLA) scenario adjusted PML.
4) The estimated Loss for each storm is the PML with 10% Allocated Loss Expenses.
5) The pre-landfall potential path for Irma represents a simulated hurricane track obtained from the AIR
   hurricane model’s stochastic catalog. This simulated track was selected to approximate the path of
   Irma based on its National Oceanic and Atmospheric Administration forecast track as of 09/06/2017,
   prior to Irma making landfall in Florida.
6) Commercial Lines claim count is at the level of building/unit.

 21
You can also read