Q2 2021 I Equity Story - Citycon

Page created by Sara Cortez
 
CONTINUE READING
Q2 2021 I Equity Story - Citycon
1   Q2 2021 I Equity Story
Q2 2021 I Equity Story - Citycon
2

TABLE OF CONTENTS
1.   COMPANY OVERVIEW   CITYCON IS A LEADING NORDIC PLAYER…

     OPERATING
2.   ENVIRONMENT
                        …OPERATING IN STABLE BUSINESS ENVIRONMENT…

3.   BUSINESS MODEL     …WITH A BUSINESS MODEL THAT PROVIDES PROTECTION EVEN DURING CRISIS…

4.   MAXIMIZING VALUE   … AND SERVES AS A PLATFORM FOR ATTRACTIVE LONG-TERM OPPORTUNITIES...

     SUSTAINABILITY
5.   STRATEGY
                        … WITH AMBITIOUS SUSTAINABILITY TARGETS…

6.   KEY FINANCIALS     … AND HIGHLIGHTING VERY GOOD Q2 RESULT AND STRONG LIQUIDITY.

     APPENDIX           FINANCIAL AND OPERATIONAL INFORMATION
Q2 2021 I Equity Story - Citycon
COMPANY OVERVIEW

3   Q2 2021 I Equity Story
Q2 2021 I Equity Story - Citycon
LEADING OWNER, MANAGER AND DEVELOPER OF URBAN
          COMMUNITY HUBS IN THE NORDICS

                                                     ▪   Net rental income in 2020 MEUR 205.4 1)
                                                     ▪   37 premises 2)
                                                     ▪   150 million visitors p.a. 1)
                                                     ▪   GLA 1.2 million sq.m. 1)
                                        10           ▪   Portfolio value EUR 4.5BN 2)
                                       centres
                                                     ▪   233 employees
           17                                        ▪   Investment grade credit ratings: Baa3, BBB- & BBB-
          centres

                               6                         Stable business model and diversified tenant mix
                             centres         2
                                           centres
            2                                            Pan-Nordic reach with leading positions in Finland,
          centres                                        Sweden, Norway and Estonia

                                                         Nordic countries less severely affected by COVID-
                                                         19 than rest of Europe and better equipped to
                                                         support companies through the crises
                                                          1) As of 31 December 2020
4   Q2 2021 I Equity Story                                2) Including Kista Galleria
Q2 2021 I Equity Story - Citycon
CLEAR FOCUS, DIVERSIFIED TENANT BASE , STRONG CAPITAL BASE

                                                       –    A €4.5bn portfolio of urban community hubs in the heart where people live and work and connect
     1     LEADING OPERATOR AND DEVELOPER OF
                                                            to public transportation provides natural visitor flow
           URBAN COMMUNITY HUBS IN NORDICS
                                                       –    Centres with retail, municipal services and entertainment under one roof

     2     CONSISTENTLY HIGH OCCUPANCY LEVELS      –       Consistently high retail occupancy levels around 93.8% with a 2.9-year average lease term and with
           FROM DIVERSIFIED TENANT BASE BRINGS A           top 5 tenants representing only 18% of rental income
           STABLE CASH FLOW                        –       Ca 92% of rental income linked to indexation

     3     FOCUS ON AFFLUENT AND STABLE NORDIC     –       Strong pan-nordic asset portfolio brings stability and diversification
           COUNTRIES                               –       Operating countries with high credit ratings and residents with high purchasing power

                                                   –       Demonstrated ability to convert our property portfolio more towards larger and higher quality
     4     EARNINGS GROWTH UNDERPINNED BY                  urban assets and to develop individual assets
           DEVELOPMENT PIPELINE OF OWNED ASSETS    –       Significant residential potential

     5     ROBUST BALANCE SHEET, MODERATE LTV          –    Loan to value 38.9%
           AND ASSETS LARGELY UNENCUMBERED             –    100 % of debt is unsecured

                                                   –       Fitch: BBB- (stable outlook)
     6    INVESTMENT GRADE RATINGS
                                                   –       Moody’s: Baa3 (stable outlook)
                                                   –       S&P: BBB- (stable outlook)
                                                   –       Citycon is committed to maintaining investment grade credit ratings

5   Q2 2021 I Equity Story
Q2 2021 I Equity Story - Citycon
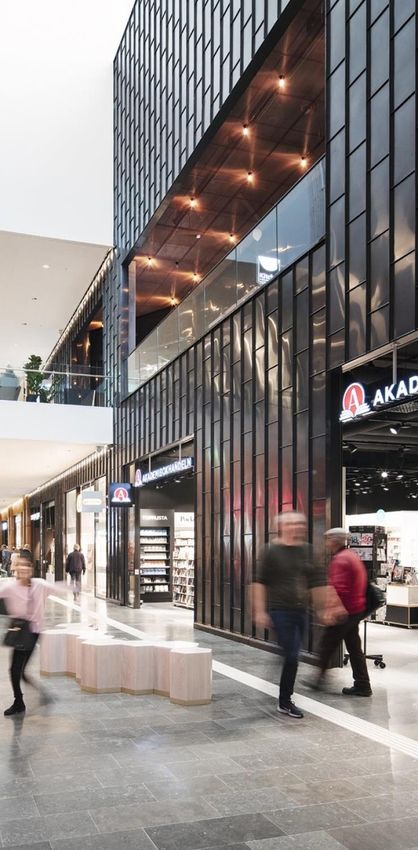
OPERATING ENVIRONMENT

6   Q2 2021 I Equity Story
Q2 2021 I Equity Story - Citycon
OVER LONG-TERM OUR OPERATING ENVIRONMENT IS
          CHARACTERISED BY STRONG URBANISATION...

     POPULATION GROWTH 2015-2035                                  PERCENTAGE OF POPULATION IN URBAN AREAS
                                                                  100%
                                                                                                                                      Sweden
                                                                                                                                       93%
                                                                  95%
                                                                                                                                      Denmark
                                                                  90%                                                                   92%
                                                                                                                                     Norway and
                                                                  85%                                                                  Finland
                                                                                                                                         90%
                                                                  80%
                                                                                                                                      Estonia
                                                 TAMPERE
                                                   12%                                                                                 77%
                                                       HELSINKI   75%
                                                         15%

                             OSLO
                                                                  70%
                                          STOCKHOLM
                             29%             25%        TALLINN
                                                          10%     65%
                                    GOTHEN-
                                     BURG                                     1980        2018        2030        2050
                                     22%
                                                                         Finland     Norway    Sweden     Denmark    Estonia
                                COPEN-
                                HAGEN
                                 16%

7   Q2 2021 I Equity Story                                                            Source: UN World Urbanization Prospects 2018
Q2 2021 I Equity Story - Citycon
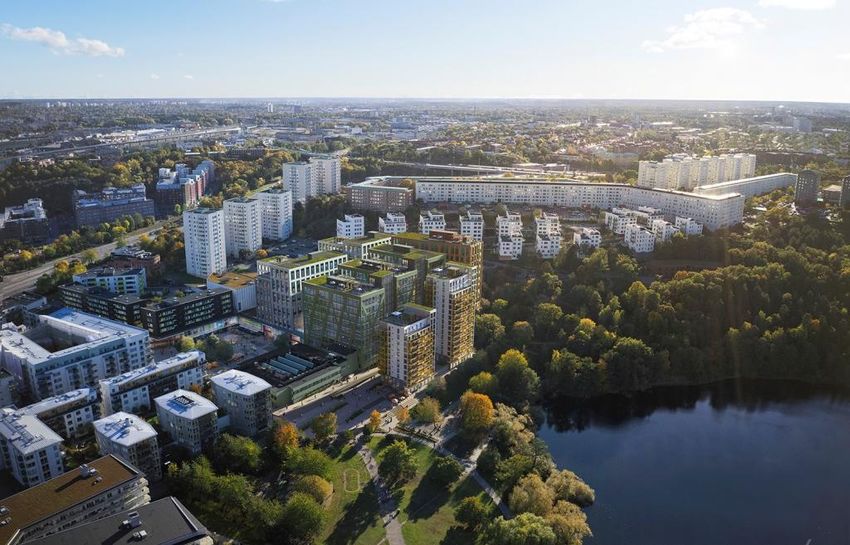
STRONG MACRO ECONOMICS IN THE NORDICS ARE EXPECTED TO
          CONTINUE

               GDP/CAPITA FORECAST (2020-F2025)                                               GENERAL GOVERNMENT GROSS DEBT/GDP
                                                                                              FORECAST (2020-F2025)
               80 000                                                                         120%
               60 000
                                                                                               80%
               40 000
                                                                                               40%
               20 000

                     0                                                                          0%
                           Denmark     Finland      Norway      Sweden   Nordics   Eurozone           Denmark   Finland     Norway    Sweden   Nordics    Eurozone

                                                 2020     F2021-F2025                                                     2020   2021F-2025F

              UNEMPLOYMENT FORECAST (2020-F2025)
                                                                                              INFLATION FORECAST (2020-F2025)
               10%
                                                                                              2.5 %
               8%
                                                                                              2.0 %
               6%
                                                                                              1.5 %
               4%
                                                                                              1.0 %
               2%
                                                                                              0.5 %
               0%
                         Denmark     Finland      Norway       Sweden    Nordics   Eurozone   0.0 %
                                                                                                      Denmark   Finland      Norway   Sweden    Nordics    Eurozone
                                                 2020     F2021-F2025
                                                                                                                          2020   F2021-F2025

8   Q2 2021 I Equity Story                              Source: IMF
Q2 2021 I Equity Story - Citycon
COVID-19 HAS AFFECTED LESS TO CONSUMER CONFIDENCE IN
          THE NORDICS VS. WESTERN AND SOUTHERN EUROPE

         CONSUMER CONFIDENCE INDICATOR — August 2021

                7.3          6.9
                                         4.2

                                                       -0.6
                                                              -3.5   -4.3
                                                                                -6.8
                                                                                                       -8.5

                                                                                                                              -12.9

                                                                                Nordic countries
9   Q2 2021 I Equity Story
                                                                            Source: EU Programme of Business and Consumer Surveys (August-21)
Q2 2021 I Equity Story - Citycon
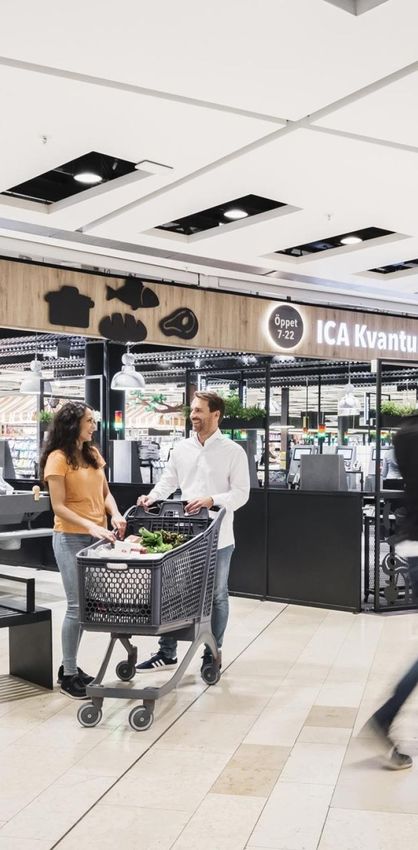
STRONGER NORDIC HOUSEHOLD FINANCIAL SITUATION
           SUPPORTS A POTENTIAL REBOUND IN CONSUMER SPENDING

       FINANCIAL SITUATION OF HOUSEHOLDS OVER NEXT 12 MONTHS — August 2021

               15.1
                              13.1      12.3

                                                      4.8
                                                                    3.1
                                                                             2.2    1.5

                                                                                                           (2.0)
                                                                                                                                  (3.2)

                                                                                      Nordic countries
10   Q2 2021 I Equity Story
                                                                                   Source: EU Programme of Business and Consumer Surveys (August-21)
BUSINESS MODEL

11   Q2 2021 I Equity Story
OUR OPERATIONAL MODEL BASED ON EFFICIENT URBAN HUBS
           AND LARGE SHARE OF NECESSITY TENANTS BRINGS STABILITY

           GROCERY-ANCHORED CENTRES
           • Large proportion of resilient necessity-based tenants

           OPERATIONAL EXCELLENCE
           • Harmonizing practices
           • Centralizing procurement
           • Maintain strict control on operating expenses and
             capital expenditure.

           MIX USE DEVELOPMENT
           •   Developing urban community hubs with retail, public
               services and entertainment under same roof
           •   Further value to all stakeholders through
               densification and increased catchment

12   Q2 2021 I Equity Story
CONNECTION TO PUBLIC TRANSPORTATION
                              PROVIDES NATURAL FOOTFALL
                                      100%
                                OF OUR SHOPPING
                                                     ▪ All of our centres are accessible by bus
                               CENTRES CONNECTED
                                    TO PUBLIC        ▪ 10 centres directly connected to metro lines, 17 to train lines and 6 to tram lines
                                 TRANSPORTATION

                                        54%
                                OF VISITORS ARRIVE   ▪ Almost 4,000 dedicated bicycle parking spaces.
                                    BY PUBLIC        ▪ Almost 90% of our shopping centres have dedicated areas for secure bicycle
                                TRANSPORTATION,        parking
                                 FOOT OR BICYCLE

                                    ISO OMENA
                               IS A GREAT EXAMPLE    ▪ Footfall increased +74 % to 20 million annual visitors after metro opening.
                               OF POWERFUL PUBLIC    ▪ Tenant sales +17%, same-store sales +7%.
                                 TRANSPORTATION

13   Q2 2021 I Equity Story
OUR NECESSITY-BASED URBAN HUBS HAVE PROVIDED STABILITY
           DURING PANDEMIC

           GROSS RENTAL INCOME BY TENANT CATEGORY, 2020                           OVER 35 % OF GROSS RENTAL INCOME FROM NECESSITY
                                                                                  TENANTS
                  Fashion and                                                     •   Focus on the daily needs of customers
                                                   Groceries
                   accessories                                                    •   4 out of the top 5 tenants are grocery stores
                                                19%
                                23%                                               SMALL PORTION OF TURNOVER BASED RENTS
                                                          Health care             •   In 2020 only 5 % of our gross rental income was
                                                      4% Municipality                 from turnover based rents
                                                       3% services                92% OF RENTS TIED TO INDEXATION
                                                    3%
                                                           Offices                PUBLIC SECTOR TENANTS ARE GROWING PART OF OUR
                              19%               1% 3% 3% Pharmacies
                                                                                  BUSINESS
             Home and                                     Banks
         sporting goods                                 Residentials and hotels   •   Currently public sector tenants and healthcare represent
                                                10%
                                     4% 5%           Cafes and restaurants            approx. 10% of our contracted GLA
               Speciality stores
                            Leisure             Cosmetics                         •   In 2020 Citycon signed or agreed long term leases with
                      Other services Wellness                                         municipalities and health care tenants across the Nordics
                                                                                      for a total of 10,900 square meters.

14   Q2 2021 I Equity Story
WE HAVE A SIGNIFICANTLY HIGHER “ESSENTIAL” BUSINESS
         EXPOSURE THAN OTHER PAN-EUROPEAN RETAIL PEERS

           •  gRO             CITYCON – TOP TEN TENANTS             PROPORTION OF GROCERIES IN TOP 10
                                                                    TENANCIES - PEER GROUP COMPARISON
          Kesko Group                          Grocery      4.8%

          S Group                              Grocery      4.0%         Peer 4

          Varner Group                         Fashion      3.9%
                                                                         Peer 3
          ICA Group                            Grocery      2.4%
          Coop                                 Grocery      2.3%     Peer Group
                                                                        avg
          H&M                                  Fashion      1.9%
          NorgesGruppen                        Grocery      1.9%         Peer 2

          Clas Ohlason                          Home        1.7%
                                                                         Peer 1
          Lindex                               Fashion      1.7%

          Gresvig                             Sport goods   1.5%        Citycon

          Top 10 tenants                                    26.2%
                                                                              0.0%             5.0%              10.0%   15.0%   20.0%

          Grocery in Top 10                                 15.3%

15   Q2 2021 I Equity Story
                                                                                  Source: Company´s Annual Reports
PUBLIC SECTOR TENANTS
           - A GROWING PART OF OUR BUSINESS

                              SWEDEN    NORWAY    FINLAND   ESTONIA   DENMARK           TOTAL

         CREDIT RATING         AAA       AAA        AA+       AA-       AAA

         MUNICIPAL/GOVERNMENTAL TENANTS

         Leased GLA           ~36,000   ~9,000    ~19,000    ~100      ~3,000          ~67,000

         Share of total
                               11%        2%        6%        0%        6%                ~5%                                     1%
         GRI %                                                                                              1%
         ALCOHOL MONOPOLY (ALKO, SYSTEMBOLAGET,
                                                                                                                      3%
         VINMONOPOLET) TENANTS                                                                                               6%
         Leased GLA           ~8,000    ~1,000    ~1,000       -         -             ~16,000               2%

         Share of total                                                                                                11%
                                3%        1%        1%         -         -                ~1%
         GRI %

         SHARE OF TOTAL GLA%, MUNICIPAL AND ALCOHOL MONOPOLY TENANTS                     ~8%
                                                                                                                 6%

                                                                        Share of GRI (municipal tenants)
16   Q2 2021 I Equity Story                                             Share of GRI (alcohol monopolies)
                                                                         As of 31 December 2020
LOW OCR SUPPORTS PROFITABILITY OF OUR TENANTS AND
           CITYCON’S COMPETITIVENESS ALSO GOING FORWARD

           OCCUPANCY COST RATIO VS PEERS

     Citycon

      Peer 1

      Peer 2

      Peer 3

     Average

      Peer 5

      Peer 6

            0.0 %       5.0 %   10.0 %     15.0 %   20.0 %   25.0 %
                                                                      Peer group: Hammersson, Klepierre, Mercialys, Unibail-Rodamco-Westfield, Wereldhave
                                                                      Source: Companies' annual reports (2019-2020)
17   Q2 2021 I Equity Story
STRONG LEASING ACTIVITY SHOWS FURTHER SIGNS OF RECOVERY

           LEASES SIGNED                                    RETAIL OCCUPANCY RATE DEVELOPMENT
           SQM, thousands
                                                                    94.1%         94.1%          94.1%
                            +21%
                                               +88%
                                     64
                           53                          55

                                                                    94.0%         93.8%          93.8%
                                             29

                                Q1                Q2                Q2/           Q1/            Q2/
                                                                    2020          2021           2021
                                      2020   2021                       Retail occupancy rate
                                                                        Retail occupance rate w/o Kista

18   Q2 2021 I Audiocast
FOOTFALL AND TENANT SALES ARE RECOVERING FROM
           PANDEMIC IMPACT

           FOOTFALL DEVELOPMENT                      LFL TENANT SALES DEVELOPMENT
           Q2/2021 VS. Q2/2020                       H1/2021 VS. H1/2020

                                        +11.9%                                                  June 2021 tenant
                                                                                                  sales exceeded
                                                              +5.4%                              comparable pre-
                                                                                                     pandemic
                                                                                                 (06/2019) levels
                           +8.2%

                                                                                 +1.8%

                     Total Footfall   LFL Footfall       LFL Grocery sales   LFL Tenant Sales

19   Q2 2021 I Audiocast
Q2 SUMMARY

                           SOLID RESULTS WITH FURTHER QUARTER OVER QUARTER GROWTH
                           •   Fair value increased for a second consecutive quarter, and for H1 the total increase
                               stands at EUR 24.4 million.
                           •   Footfall, tenant sales and leasing activity are rebounding to pre-pandemic levels, which
                               can be seen in our NRI and rent collections.
                           •   Q2/2021 was in line with our expectations and narrows our full year guidance.
                           SUCCESSFUL FINANCING AND UPGRADED RATING OUTLOOK CONFIRM STRATEGY
                           •   During Q2 we received upgraded credit rating outlooks from both Standard & Poor’s and
                               Moody’s. The ratings now stand at BBB- and Baa3 with a stable outlook.
                           •   We also completed a successful issuance of a green bond of 350 MEUR with a high
                               demand. The issuance reduced our LTV to 38.9%.
                           •   In addition to organic portfolio development, the LTV reduction gives us the opportunity
                               to accelerate our portfolio transformation by select acquisitions. The active transactions
                               market further supports our capital recycling activities aiming for an increased share of
                               residential and office premises in our portfolio.

20   Q2 2021 I Audiocast
MAXIMIZING VALUE

21   Q2 2021 I Equity Story
CITYCON’S STRATEGY IS BASED ON A STABLE CORE BUSINESS WITH
           ATTRACTIVE GROWTH OPPORTUNITIES

                                                                       HOW WE CREATE VALUE

           ASSETS IN NORDIC         NECESSITY BASED             DENSIFICATION              STRONG SOCIAL           RECYCLING OF
                                                                                                                                       =       STABLE CORE
           PRIME LOCATIONS            TENANT MIX                  POTENTIAL               AND COMMUNITY              CAPITAL                  BUSINESS WITH
                                                                                           RELATIONSHIPS                                       ATTRACTIVE
                                                                                                                                                 GROWTH
          ▪ Top 2 cities in each   ▪ Grocery anchored         ▪ Identified residential   ▪ Long lasting         ▪ Selective
                                                                                                                                             OPPORTUNITIES
            country with strong      centres, a large share     potential in               relationship with      divestments ensuring
            urbanisation             of necessity tenants       connection to                                     liquidity for strategic       AND CLEAR
                                                                                           municipalities
          ▪ Connection to public   ▪ Mixed-use hubs with        existing assets          ▪ Continues dialogue     acquisitions               SYNERGIES WITH
            transportation           growing share of         ▪ Developing new             with surrounding     ▪ Investments in            EXISTING BUSINESS
                                     municipalities             residential, office,       communities            organic growth of
                                                                municipality services    ▪ Sustainability         residential,
                                                                space                      embedded in the        combined with
                                                                                           operating model        potential acquisitions

22   Q2 2021 I Equity Story
PERFECTLY POSITIONED TO
                              PARTICIPATE IN DENSIFICATION
                                                    ▪ Direct connections to the most important public transportation hubs place
                               EXISTING/ OWNED
                                                      assets in prime position for zoning and gaining building rights
                                ASSETS IN PRIME
                                   LOCATIONS        ▪ Existing relationships and co-operation with municipalities make Citycon the
                                                      preferred partner

                                LEADING OWNER
                                                    ▪ Proven track-record of developing award-winning destinations
                               AND DEVELOPER OF
                               REAL ESTATE IN THE   ▪ Successful development of green assets with innovative recycling,
                                    NORDICS           transportation and energy efficiency solutions

                                  FOR CITYCON:
                              ATTRACTIVE GROWTH     ▪ Attractive add-on business on top of prime retail assets with a significant
                                 BUSINESS WITH        portfolio diversification impact
                                CLEAR SYNERGIES     ▪ Increase in the number of people in the catchment area creates natural
                                 WITH EXISTING        customer flow and balances intra-day fluctuation
                                    BUSINESS

23   Q2 2021 I Equity Story
CITYCON CONTINUES TO FOCUS ON PORTFOLIO
                              TRANSFORMATION TOWARDS A MIXED-USE PORTFOLIO
                                         CURRENT                                             NEW DEVELOPMENT                                                 TARGET
                                        PORTFOLIO                                             OPPORTUNITIES                                                 PORTFOLIO

                                                       19.5%                                        13%

                                              GLA                                                        GLA                                        40.0%     GLA      40.0%
                                57.5%         1.1m                                                      0.6m*                                                 1.5m
                                                            23.0%

                                                                                                                87%
                                                                                                                                                              20.0%

                                                     RETAIL                                     NECESSITY                                     RESIDENTIAL, OFFICE & OTHER

                              Note: * Includes 0.2 msq.m. of condos; ** Total opportunities of 0.6 msq.m. - 0.2 m.sq.m. of condos sold once
                              completed

24   Q2 2021 I Equity Story
VALUE FROM THE BUILDING RIGHTS IS APPROX. 200
                              MEUR
                                                                          Value of development projects is mostly created already in the zoning
                                                                          phase. Decision on whether to invest or cash on building rights is made in
                              BUILDING RIGHTS VALUE CREATION
                                                                          a later stage of the process.
                              200

                              150
                                                                                                                                        Building rights
                                                                                                                                       of 200 MEUR for
                              100                                                                                                        the portfolio
                                                                                                                                         equates 1.12
                                                                                                                                          EUR/ share
                              50

                               0
                                        2020            2021             2022                   2023                 2024           2025           2026

                                                                       Annual Building Rights          Cumulative Building Rights

                                Final construction decision is made in a later stage of the process
                                triggering also capex spend

25   Q2 2021 I Equity Story
OUR TOTAL BUILDING RIGHTS PORTFOLIO INCLUDES OVER
           300,000 SQM OF RESIDENTIAL DEVELOPMENT PIPELINE

           •   Citycon has created a significant residential
               development pipeline of 22 projects                           Construction
           •   The whole scale of development projects is
               covered, ranging from early pre-zoning phase to           €   Valid Zoning

               execution, i.e., the construction phase                       Ongoing Zoning

                                                                             Pre-Zoning

                   Construction        21,120
                    Valid Zoning       22,500                                                     €

                Ongoing Zoning                                 158,750
                                                                                              €
                     Pre-Zoning                      106,000

                                   Over 300,000 sqm in total

26   Q2 2021 I Equity Story
Capex
                                                               spent to
                                                               date EUR
                                                                                                LIPPULAIVA – A PROTOTYPE OF AN
                                                              263 million
                                                                                                URBAN HUB
                                                                                                • SUPERIOR TENANT MIX with grocery anchors
                                                                                                  • 45% of the GLA reserved for grocery stores
                                                                                                  • A variety of private and public services — a kindergarten, public library private
                                                                                                    health services and gym.
                                                                                                • PRE-LEASED LEVEL OF 76%* with an average rent of approx. 31 EUR per sq.m.**
                                                                                                • SIGNIFICANT RESIDENTIAL COMPONENT attached to the centre
                                                                                                  • 8 high-rise towers attached to the centre
                                                                                                  • In total approximately 550 apartments of which approximately 275 rental
                                                                                                     apartments are owned by Citycon with anticipated rent of approx. 25 EUR per
                                                                                                     sq.m.**
                                                                                                • A CATCHMENT AREA OF 93,000 INHABITANTS
                                                                                                  • Purchasing power of inhabitants (€/year)
                                                                                                    clearly higher above the HMA average.
                                                                                                  • Significant residential zoning in the catchment
                                                                                                    area >10% increase expected in the following
                                                                                                    ten years.
                                                                                                • Well-connected to the PUBLIC TRANSPORTATION
                                                                                                  • Anticipated traffic from metro and bus
                                                                                                    terminal: 14.000 commuters per day (y2026).
     * Of which 71% are contracts signed and 5% are negotiated/ offers accepted by the tenant
                                                                                                     Groceries44%             Services andoffices21%   Homeandsportinggoods15%    Restaurants8%
     ** Stabilized rents (Y2026)                                                                     Wellness4%               Fashion4%                Cosmeticsandpharmacies2%   Specialitystores1%
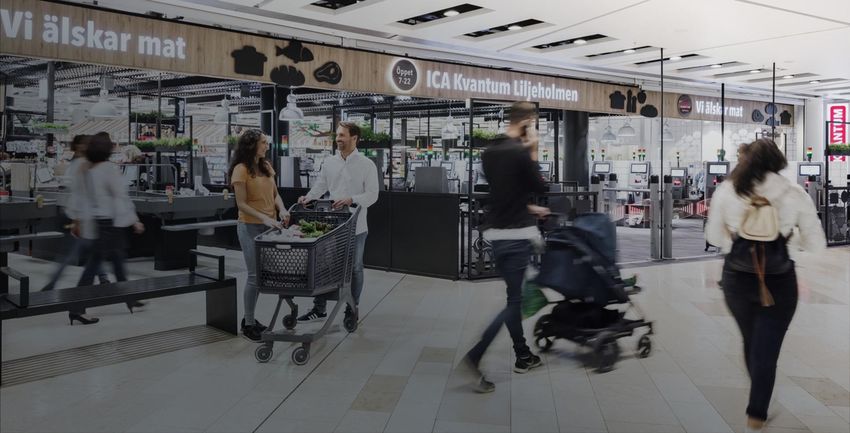
27     Q2 2021 I Equity Story
LILJEHOLMEN SHOWCASES TRANSFORMATION STRATEGY

                                       •   Liljeholmen is a well-connected sub-urban area in the heart of
                                           Stockholm and is expected to grow substantially in future.
                                       •   Citycon has established assets in the area and currently owns a
                                           mixed-use urban hub comprised of retail (with a large proportion
                                           of necessity tenants) and healthcare services.
                                       •   Liljeholmen will include new areas totaling approx. 70,000 sqm to
                                           accommodate the needs of future residents and office workers.
                                           New developed space is distributed between residential, office,
                                           services, culture and public meeting places.
                                       •   The project is currently in the zoning phase, and the construction
                                           is planned in phases starting from year 2023.
                                       •   These densification plans are being done in close partnership with
                                           the City of Stockholm.

28   Q2 2021 I Equity Story
OPPORTUNITY TO ACCELERATE PORTFOLIO TRANSFORMATION
           WITH ACQUISITIONS BACKED BY STRONG TRANSACTION MARKET

           NORDIC SELL-SIDE REAL ESTATE MARKET                           NORDIC BUYSIDE REAL ESTATE MARKET
           • The Nordic real estate transaction market continued         • Owing to our improved liquidity position, our
             to pick up and we have experienced reverse inquiries          portfolio transformation can be accelerated through
             for several of our assets.                                    select acquisitions e.g., in residentials.
           •   The appetite and pricing for high quality assets
               continues to be on an attractive level and facilitates                 The Nordic residential sector is more
               selective capital recycling activities in line with our                mature than many other parts of Europe
               portfolio transformation strategy, which will increase                 and attracting capital given the region's
                                                                                      robust macro economic and demographic
               the share of residential and office premises and                       outlook. Sweden and Finland provide the
               decrease the proportion of non-essential retail in our                 best opportunities for listed investors in
               portfolio.                                                             the Nordics.
           •   A strong balance sheet remains a key priority and the                  - Green Street Advisors, 07/2021
               company will continue its capital recycling actions
               going forward.

29   Q2 2021 I Equity Story
SUSTAINABILITY

30   Q2 2021 I Equity Story
OUR SUSTAINABILITY STRATEGY
CARBON NEUTRAL                        ACCESSIBLE                             CONVENIENT AND SAFE
− Citycon is carbon neutral by 2030   − 100% of assets are connected to      − Tenant satisfaction stays consistently
                                        public transportation, encouraging      above 90% in areas of safety, security,
                                        green ways to visit our centres         hospitality and service-mindedness.

                                                                                                Citycon puts best
                                                                                                sustainability practices into
                                                                                                effect by following a clear
                                                                                                roadmap and monitoring
                                                                                                success
                                           EXCELLENCE IN ACTION

31
CITYCON IN THE TOP QUARTER IN EUROPE’S TOP CLIMATE
            LEADER COMPANIES ACROSS ALL SECTORS
                                                     Citycon among Europe’s top Climate Leader companies
                                                     according to Financial Times report

                                                     • Financial Times and German research company Statista published
                                                       18 May 2021 a list of companies across Europe that have shown the
                                                       highest reduction in greenhouse gas emissions in relation to their
                                                       revenues in the period 2014–2019.
                                                     • The results will also be introduced in a special report to be
                                                       published in Financial Times on 27 May.
                                                     • More than 4,000 companies with revenue of at least MEUR 40 in
                                                       2019 were surveyed.

                                                               CITYCON IS PROUD TO
                                                               BE RECOGNISED AS ONE OF
                                                               EUROPE’S CLIMATE LEADERS 2021

32   Q2 2021 I Equity Story
                                      Confidential
STRIVING FOR EXCELLENCE IN ACTION

                              SUSTAINABILITY KEY FIGURES

                                                           Citycon wants to have a positive impact on people,
                                                           communities and the environment. “Excellence in
                                                           action” is present in what everyone at Citycon does
                                                           every day. We want to make best sustainable
                                                           practices the norm throughout the company, so that
                                                           successes are shared and adopted.

33   Q2 2021 I Equity Story
FINANCIAL OVERVIEW

34   Q2 2021 I Equity Story
Q2/2021: CONTINUED QUARTER OVER QUARTER
                              NRI AND VALUATION GROWTH
                              CITYCON’S FINANCIAL PERFORMANCE: CONTINUED QUARTER OVER QUARTER GROWTH
                              •   Net Rental Income (NRI) of EUR 50.8 million +1.2% compared to Q2/2020 (NRI EUR 50.2 million), and +0.7% compared
                                  to Q1/2021 (EUR 50.4 million). The direct operating profit, EUR 44.1 million, slightly ahead the Q2/2020 (EUR 44.0
                                  million). EPRA earnings per share EUR 0.183 compared to EUR 0.204 in Q2/2020.
                              •   Q2 portfolio valuations increased for a second consecutive quarter, and for H1 the fair value gains stand at EUR 24.4
                                  million.
                              •   Q2/2021 was in line with our expectations and we narrow our full year guidance.

                              INCREASES IN FOOTFALL, TENANT SALES AND LEASING ACTIVITY
                              •   Footfall increased from last year and was 8.2% above Q2/2020 – on a like-for-like basis the increase was 11.9%. The
                                  positive trend continues, and June 2021 sales exceeded pre-pandemic levels in June 2019. Tenant sales grew
                                  accordingly, with like-for-like tenant sales +1.8% above H1/2020 levels.
                              •   Rent collection has remained high, at 95% in H1. Q1 rent collection was initially reported as 92% and has since increased
                                  to 96%. Q2 rent collection stands at 94% and is expected to improve in line with the Q1 collection.
                              •   Leasing activity was strong: the number of signed leases grew from 29,000 sq.m. in Q2/2020 to 55,000 in Q2/2021,
                                  complemented with higher average rents for the signed leases.
                              •   The stable performance throughout the pandemic reflects the strength of Citycon’s strategy which is based on having a
                                  large share of necessity tenants and locations in densely populated major markets.
                              •   The stability of Nordics as operating environment and the wide COVID-19 vaccine coverage in our operating countries
                                  are further key factors underlying the stability of the results.

35   Q2 2021 I Equity Story
Q2/2021: BOND ISSUANCE AND CAPITAL RECYCLING
                                  SPEED UP PORTFOLIO TRANSFORMATION
                                  FINANCING ACTIVITY
     CLICK TO EDIT TITLE          •   During Q2 we received upgraded credit rating outlooks from both Standard & Poor’s and Moody’s. The ratings now
                                      stand at BBB- and Baa3 with a stable outlook.
                                  •   In Q2 Citycon completed a successful issuance of a green hybrid bond of 350 MEUR with a high demand, in addition to
                                      the senior bond issued in Q1 with a coupon of 1.625%. The enhanced liquidity gives flexibility to accelerate the portfolio
                                      transformation through select acquisitions. The issuance, together with the divestment of 3 non-core assets, also
                                      reduced our LTV to 38.9%.
                                  CAPITAL RECYCLING AND PORTFOLIO TRANSFORMATION
                                  •   The Nordic real estate transaction market continued to pick up and on the heels of the divestment of 3 non-core assets
                                      in Q1, we have experienced reverse inquiries for several of our assets. The appetite and pricing for high quality assets
                                      continues to be on an attractive level and facilitates selective capital recycling activities in line with our portfolio
                                      transformation strategy, which will increase the share of residential and office premises and decrease the proportion of
                                      non-essential retail in our portfolio.
                                  •   We have identified 222 MEUR of additional building rights’ potential. Of this 222 MEUR, only approx. 50 MEUR has been
                                      realized in our book values, leaving approx. 170 MEUR as additional growth for the company.
                                  NEW CFO APPOINTED
                                  •   Mr. Bret D. McLeod has been appointed Citycon Oyj’s CFO and member of the Corporate Management Committee
                                      following the planned retirement of the current CFO, Mr. Eero Sihvonen at year-end. Mr. McLeod will assume full
                                      responsibility as CFO on January 1, 2022. Mr. Sihvonen will remain as an adviser to the company until June 2022.

36       Q2 2021 I Equity Story
CLICK TO EDIT
                     TITLE
                                          Q2/2021 FINANCIALS
                    CLICK TO EDIT TITLE

                                                                                                                                                 Q2/2021 incl.
                                             MEUR                                                                Q2/2021     Q2/2020   Change
                                                                                                                                                  Kista 50%
                                            Gross rental income                                                       54.1     53.6     0.9 %        56.3

                                            Net rental income                                                         50.8     50.2     1.2 %        52.5

                                            Direct operating profit                                                   44.1     44.0     0.4 %        45.7

                                            EPRA Earnings                                                             32.7     36.3     -9.9 %        n/a

                                            Adjusted EPRA Earnings (1                                                 27.6     32.2    -14.4 %        n/a

                                            EPRA EPS (basic)                                                         0.183    0.204     -9.9 %        n/a

                                            Adjusted EPRA EPS (basic) (1                                             0.155    0.181    -14.4 %        n/a

                                            EPRA NRV per share                                                       11.66    11.51     1.3 %         n/a

                                             1) The   adjusted key figure includes hybrid bond coupons and amortized fees.

37   Q2 2021 I Equity Story
CLICK TO EDIT
                     TITLE
                                          Q1-Q2/2021 FINANCIALS
                    CLICK TO EDIT TITLE

                                                                                                                                                                  Q1-Q2/2021
                                             MEUR                                                               Q1-Q2/2021                Q1-Q2/2020    Change     incl. Kista
                                                                                                                                                                      50%
                                             Gross rental income                                                      111.3                     111.5    -0.2 %      116.1

                                             Net rental income                                                        101.2                     102.6    -1.3 %      104.4

                                             Direct operating profit                                                   89.0                     90.2     -1.3 %       92.1

                                             EPRA Earnings                                                             64.3                     71.0     -9.5 %       n/a

                                             Adjusted EPRA Earnings (1                                                 55.2                     63.0    -12.4 %       n/a

                                             EPRA EPS (basic)                                                         0.361                     0.399    -9.5 %       n/a

                                             Adjusted EPRA EPS (basic) (1                                             0.310                     0.354   -12.4 %       n/a

                                             EPRA NRV per share                                                       11.66                     11.51    1.3 %        n/a

                                             1) The   adjusted figure includes hybrid bond (issued November 2019) coupons and amortized fees.

38   Q2 2021 I Equity Story
ESTIMATED DIRECT COVID-19 IMPACT ON NET RENTAL INCOME

                NET RENTAL INCOME BRIDGE

                 102.6              -0.6                                                                                                                                  ESTIMATED DIRECT
                                                                       -0.7                                                                        2.9        101.2     COVID-19 IMPACT ON NET
                                                                                                     -0.9            -0.3
                                                     -1.1                                                                           -0.3                                    RENTAL INCOME
                                                                                           -0.4                                                                           AMOUNTS APPROX.
                                                                                                                                                                               -4.3 MEUR

              Q1-Q2/2020       Capital/Gross        Rental          Turnover          Specialty   Parking fees   Credit losses      Service    Other (non-    NRI Q1-
                                   rents          discounts*       based rents         leasing     and rents                     changes and COVID related)   Q2/2021
                                                                                                                                 other charges

       * Rental discounts granted in Q2/2020 have been accrued over the contract period.

39   Q2 2021 I Equity Story
PORTFOLIO VALUATIONS INCREASED FOR A
                              SECOND CONSECUTIVE QUARTER
                              FAIR VALUE CHANGES. MEUR                        Q2/2021     Q2/2020     Q1-Q2/2021        Q1-Q2/2020            2020
                               Finland & Estonia                                   3.4        -32.9               6.6          -45.5            -86.8

                               Norway                                              9.8        -17.4               8.5           -6.2             -1.3

                               Sweden & Denmark                                    4.2        -23.9              12.3          -32.9            -53.1

                              Investment properties. total                        17.4        -74.2              27.4          -84.6           -141.2
                               Right-of-use assets classified as investment
                                                                                   -1.5        -1.4              -2.9           -2.8             -5.7
                               properties (IFRS 16)
                               Investment properties in the statement of
                                                                                  15.9        -75.6              24.4          -87.4           -146.9
                               financial position. total

                                Kista Galleria (50%)                               -0.4        -0.8              -1.1          -12.0            -32.3

                              Investment properties and                           15.5        -76.4              23.4          -99.4           -179.2
                              Kista Galleria (50%). total

                              AVERAGE YIELD REQUIREMENT. %                                      30 June 2021                           30 June 2020
                              Investment properties and
                                                                                                          5.4%                                 5.5%
                              Kista Galleria (50%), average

40   Q2 2021 I Equity Story
SUCCESSFUL 350 MEUR HYBRID ISSUANCE BRINGS
                              FLEXIBILITY TO EXECUTE ON OUR TRANSFORMATION
                              STRATEGY
                                EUR 350 million Green Hybrid
                                •   Issued on 4 June 2021
                                •   Fixed rate coupon of 3.625%
                                •   The Hybrid is subordinated to Citycon’s debt obligations and treated as equity in Citycon’s
                                    consolidated financial statements prepared in accordance with IFRS.
                                •   The issuance brings flexibility to execute on our transformation strategy and enables the
                                    diversification of our portfolio both organically and through potential acquisitions. The issuance
                                    will also strengthen the balance sheet and demonstrates Citycon’s commitment to improving its
                                    investment grade credit ratings.
                                •   The demand was very strong with an order book reaching around one billion euros and
                                    approximately 150 investors, and therefore, we were able to tighten the pricing and increase the
                                    size of the issue to EUR 350 million during the book building process.

41   Q2 2021 I Equity Story
MOODY’S AND STANDARD & POOR’S UPGRADED CITYCON’S
          OUTLOOKS TO STABLE

         •   In June, both Moody’s and Standard & Poor's
                                                                  NOW CITYCON HAS AN
             affirmed Citycon’s investment grade credit            INVESTMENT GRADE
             ratings with upgraded outlooks to stable.           CREDIT RATING WITH A
                                                                 STABLE OUTLOOK FROM
         •   The outlook upgrades reflect sufficient                ALL THREE MAJOR
                                                                    CREDIT AGENCIES,
             headroom for Citycon’s credit metrics, the             INCLUDING FITCH.
             resilience of our necessity-based urban hubs,
             the stability of our markets, and a positive view
             towards our transformation toward a more
             residential and mixed-use portfolio

42   Q2 2021 I Equity Story
MAIN FINANCING METRICS

                               ▪   Fixed interest rate ratio                                              96.9%
                               ▪   Investment-grade credit ratings                                        BBB-/Baa3/BBB-
                               ▪   Financing mainly unsecured                                             100%
                               ▪   Substantial liquidity buffer                                           MEUR 835.7
                               ▪   Loan to Value                                                          38.9%*
                               ▪   Average maturity of loan portfolio                                     4.3

                                                             *The Q1/2021 LTV calculation is adjusted for a EUR 29 million deferred payment in other receivables related to
43   Q2 2021 I Equity Story                                  asset disposals. n addition, highly liquid cash investments has been taken into account in net debt.
OUTLOOK FOR 2021

                                   Citycon forecasts the 2021 direct operating profit
                                         to be in range EUR 173–184 million,
                                            EPRA EPS EUR 0.676–0.726 and
                                         adjusted EPRA EPS EUR 0.558–0.608.
                                    Adjusted EPRA Earnings per share outlook includes also the coupons of the recently
                                  issued EUR 350 million hybrid. The outlook assumes that there are no major changes in
                                      macroeconomic factors and that there will not be another wave of COVID-19 with
                                     restrictions resulting in significant store closures. These estimates are based on the
                                  existing property portfolio and announced disposals as well as on the prevailing level of
                                      inflation, the EUR–SEK and EUR–NOK exchange rates, and current interest rates.

                                                                      Previous Outlook
                                   Citycon forecasts the 2021 direct operating profit to be in range EUR 170- 188 million,
                                            EPRA EPS EUR 0.651-0.751 and adjusted EPRA EPS EUR 0.558-0.658.

44   Q2 2021 I Equity Story
APPENDIX
                                citycon.com

45   Q2 2021 I Equity Story
BALANCED MATURITY PROFILE

                              DEBT BREAKDOWN BY TYPE

                                                                       DEBT MATURITY PROFILE
                                                       Bonds 97%

                                                       Bank loans 0%

                                                       CP 3%

                          DEBT BREAKDOWN BY CURRENCY

                                                        EUR 67%
                                                        NOK 17%
                                                        SEK 16%

46   Q2 2021 I Equity Story
INCOME STATEMENT

     MEUR                                        Q2/2021     Q2/2020         %       Q1-Q2/2021     Q1-Q2/2020         %       2020
     Gross rental income                              54.1        53.6      0.9 %           111.3          111.5     -0.2 %     224.3
     Service charge income                            17.1        16.9      1.6 %            35.5           35.0     1.3 %       71.2
     Property operating expenses                     -20.5       -18.8      9.5 %           -44.8          -41.3     8.2 %      -84.9

     Other expenses from leasing operations            0.0        -1.6           -           -0.8           -2.6    -67.8 %      -5.3

     Net rental income                                50.8        50.2     1.2 %            101.2          102.6     -1.3 %     205.4
     Administrative expenses                          -6.5        -6.3      2.4 %           -12.1          -12.8     -5.4 %     -25.9

     Other operating income and expenses              -0.2         0.1           -           -0.5            0.4-                 0.9

     Net fair value gains/losses on investment
                                                      15.9       -75.6           -           24.4          -87.4           -   -146.9
     property
     Net gains/losses on sale of investment
                                                       0.3         0.0           -           -5.1            1.7           -      0.7
     property
     Operating profit                                 60.4       -31.6   -291.5 %           107.9            4.5           -     34.1
     Net financial income and expenses               -13.8       -12.0    14.8 %            -27.4          -24.3    12.8 %      -51.8

     Share of profit/loss of joint ventures           -1.7        -0.8    98.5 %             -3.5          -10.0    -64.6 %     -28.0

     Profit before taxes                              44.9       -44.4           -           77.0          -29.8           -    -45.7
     Current taxes                                    -0.6        -0.4    66.1 %             -1.4           -1.2    17.9 %       -1.8
     Deferred Taxes                                   -6.9         7.8           -          -12.1            8.1           -     19.6
     Profit/loss for the period                       37.5       -37.0           -           63.5          -23.0           -    -27.9
47
BALANCE SHEET

          MEUR                                         30 JUNE 2021    30 JUNE 2020
          Investment properties                              4 292.7         4 170.4
          Total non-current assets                           4 622.4         4 482.3
          Investment properties held for sale                    0.0             0.0
          Total current assets                                 402.5           220.5
          Total assets
                                                             5 024.8         4 702.8
          Total shareholders’ equity
                                                             2 536.5         2 164.4
          Total liabilities
                                                             2 488.3         2 538.4
          Total liabilities and shareholders’ equity         5 024.8         4 702.8

48   Q2 2021 I Equity Story
THANK YOU!
                                 citycon.com

49   Q2 2021 I Equity Story
You can also read