Q2 Report 2021 Dream Industrial REIT - Dream Unlimited
←
→
Page content transcription
If your browser does not render page correctly, please read the page content below
Dream Industrial REIT

Q2 Report 2021
Table of Contents

SECTION I                                              SECTION VI

1      Key performance indicators                             Risks and our strategy to manage
2      Business update
       Basis of presentation                           SECTION VII
       Forward-looking disclaimer
                                                              Critical accounting judgments
6      Background
                                                              Future accounting policy changes
       Our strategy

                                                       CONDENSED CONSOLIDATED
SECTION II
                                                       FINANCIAL STATEMENTS
       Our assets
                                                       48     Condensed consolidated balance sheets
       Our operations
                                                              Condensed consolidated statements of
       Our results of operations
                                                              comprehensive income (loss)
                                                              Condensed consolidated statements of
SECTION III                                                   changes in equity
23     Investment properties                                  Condensed consolidated statements of
       Our financing                                          cash flows
       Our equity                                             Notes to the condensed consolidated
                                                              financial statements
SECTION IV

       Foreign currency information
37     Quarterly information
       Non-GAAP measures and
       other disclosures

SECTION V

       Disclosure controls and our procedures
       and internal control over financial reporting
Management’s discussion and analysis
All dollar amounts in our tables are presented in thousands of Canadian dollars, except for per square foot amounts, per Unit amounts, or unless otherwise stated.
SECTION I
KEY PERFORMANCE INDICATORS
Performance is measured by these and other key indicators:
As at
June 30, December 31, June 30,
2021 2020 2020
Total portfolio
Number of assets(1) 215 177 169
Investment properties fair value(2) $ 4,689,801 $ 3,241,601 $ 2,897,409
Gross leasable area (“GLA”) (in millions of sq. ft.) 38.5 27.3 25.8
Occupancy rate – in-place and committed (period-end) 98.0% 95.6% 95.6%
Occupancy rate – in-place (period-end) 97.4% 94.7% 95.0%
Average in-place and committed base rent per sq. ft. (period-end)
Canadian portfolio $ 7.67 $ 7.48 $ 7.38
U.S. portfolio (US$) $ 4.12 $ 4.01 $ 3.95
European portfolio (€) € 4.51 € 5.11 € 5.16
Estimated market rent to in-place and committed base rent spread (%) (period-end)
Canadian portfolio 19.6% 9.4% 8.9%
U.S. portfolio 3.6% 6.5% 9.4%
European portfolio 7.3% 6.7% 4.5%
Weighted average lease term (“WALT”) (years) 4.3 4.1 4.1
Three months ended Six months ended
June 30, June 30, June 30, June 30,
2021 2020 2021 2020
Operating results
Net income $ 160,295 $ 2,944 $ 255,559 $ 44,961
Funds from operations (“FFO”)(3) 39,158 29,558 74,066 57,552
Net rental income 51,095 42,378 97,757 82,119
Comparative properties net operating income (“NOI”) (constant
currency basis)(3) 43,972 42,350 73,870 71,623
Per Unit amounts
Distribution rate $ 0.17 $ 0.17 $ 0.35 $ 0.35
FFO – diluted(3)(4) $ 0.19 $ 0.17 $ 0.38 $ 0.34
Dream Industrial REIT 2021 Second Quarter Report | 1As at
June 30, December 31, June 30,
2021 2020 2020
Financing(5)
Credit rating – DBRS BBB (mid) BBB (mid) —
Net total debt-to-assets ratio(3) 37.9% 31.3% 28.1%
Net total debt-to-adjusted EBITDAFV (years)(3) 8.6 6.2 5.4
Interest coverage ratio (times)(3) 5.2 4.4 4.1
Secured debt, percentage of total assets(3) 19.7% 23.3% 29.2%
Unencumbered assets, percentage of investment properties(3)(6) 49.5% 44.5% 38.2%
Available liquidity(3) $ 663,249 $ 573,235 $ 395,437
Capital
Total number of Units (in thousands)(7) 228,367 171,231 171,223
Net asset value (“NAV”) per Unit(3) $ 13.69 $ 12.55 $ 11.75
Unit price 15.28 13.15 10.68
(1) The term “Number of properties” in prior period has been renamed to “Number of assets” and redefined as a building, or a cluster of buildings in close proximity
to one another attracting similar tenants. Accordingly, the number of assets in prior periods has been revised to reflect the change in definition.
(2) Excludes assets held for sale as at June 30, 2021.
(3) FFO, comparative properties NOI (constant currency basis), diluted FFO per Unit, net total debt-to-assets ratio, net total debt-to-adjusted EBITDAFV, interest
coverage ratio, secured debt as a percentage of total assets, unencumbered assets as a percentage of investment properties, available liquidity and NAV per
Unit are non-GAAP measures. See “Non-GAAP Measures and Other Disclosures” for a description of these non-GAAP measures.
(4) A description of the determination of diluted amounts per Unit can be found in the section “Non-GAAP Measures and Other Disclosures” under the heading
“Weighted average number of Units”.
(5) Financing metrics include income (loss) from discontinued operations as applicable.
(6) Unencumbered assets (non-GAAP measure) excludes assets held for sale in the current period.
(7) Total number of Units includes 18.6 million LP B Units which are classified as a liability under IFRS.
BUSINESS UPDATE
Dream Industrial REIT has carried strong momentum into Q2 2021 with an exceptionally active quarter. The Trust closed on over
$1.4 billion of assets during the quarter and over $1.8 billion on a year-to-date basis of acquisitions across North America and
Europe and approximately $100 million subsequent to June 30, 2021, with an additional $65 million under contract or in exclusivity.
Subsequent to quarter-end, the Trust seeded a U.S. industrial fund by selling 18 assets (29 buildings) in its U.S. portfolio for
expected net proceeds of approximately $215 million in cash and an approximately 25% retained interest. As part of the
transaction, the Trust will transfer to the fund approximately $276 million of secured mortgages with an average interest rate of
3.6%, saving over $37 million in estimated yield maintenance costs that it would typically incur in a marketed sale of its entire U.S.
portfolio. The Trust has made significant progress on its development strategy with nearly 700,000 square feet underway and
added over one million square feet of expansion opportunities in France and the Netherlands, through the Pan-European logistics
portfolio transaction completed during the quarter.
Operations update
Robust leasing momentum at attractive rental spreads – Strong demand from high-quality occupiers continue to result in
significant rental rate growth across the Trust’s portfolio. Since the end of Q1 2021, the Trust has signed approximately 1.6 million
square feet of new leases and renewals at an average spread of over 22% over prior rental rates.
Leasing highlights since reporting Q1 2021 results include:
i. the Trust signed a 222,000 square foot renewal with one of its largest tenants in Québec, at a rental spread of 92% over
expiring rent. The new term will commence in February 2022;
ii. in Europe, the Trust renewed a 215,000 square foot tenant while achieving a 13% spread over expiring rent. The new term
will commence in January 2022;
iii. in Western Canada, the Trust leased 14 vacancies totalling 156,000 square feet, resulting in a 170 basis points increase in
committed occupancy in the Trust’s Western Canada portfolio to 95.9% as at June 30, 2021; and
iv. the Trust signed a 72,000 square foot renewal with a tenant in the Greater Toronto Area at a spread of approximately 75%.
Dream Industrial REIT 2021 Second Quarter Report | 2Strong rent collections – The Trust’s portfolio has remained resilient through market disruptions and rent collections have
returned to pre-pandemic levels. The Trust has collected over 99% of recurring contractual gross rent during 2021. In addition, the
Trust has collected substantially all of the contractual gross rent for 2020. The Trust has not entered into any material rent deferral
arrangements subsequent to Q2 2020. To date, the Trust has received nearly 95% of the $2.3 million of contractual gross rent
deferred during Q2 2020.
The following table summarizes selected operational statistics with respect to the last three quarters, all presented as a percentage
of recurring contractual gross rent as at August 3, 2021:
Selected operational statistics
Q2 2021 Q1 2021 Q4 2020
Cash collected from tenants 99.2% 99.6% 99.5%
Deferrals (with defined repayment schedule) 0.2% —% —%
Cash collected on deferrals (0.1%) —% —%
Sub-total of cash collected 99.3% 99.6% 99.5%
Remaining to be collected 0.7% 0.4% 0.5%
Total 100.0% 100.0% 100.0%
Acquisitions, development and finance update
Acquisitions – Since the end of Q1 2021, the Trust has closed on 41 income-producing high-quality logistics assets across Canada,
the U.S., and Europe totalling $1.5 billion, including the 31-property Pan-European logistics portfolio with a total value of $1.3
billion that closed on June 24, 2021. These acquisitions have added over 10.4 million square feet of high-quality, well-located and
functional logistics space to the Trust’s portfolio. Built on average in 2006, these assets are above the average quality of the Trust’s
portfolio, with an average clear ceiling height of 35 feet, and are occupied by high-quality tenants primarily in the logistics and
food and beverage industry.
The pipeline for future acquisitions remains strong with over $200 million in deals currently being underwritten, and the Trust has
waived conditions on an asset in Canada for approximately $18 million. Pro forma these acquisitions, the Trust will have acquired
approximately $1.8 billion of assets in 2021, adding 12 million square feet of high-quality GLA to the Trust’s portfolio.
U.S. industrial venture – On July 30, 2021, the Trust sold 18 of its U.S. assets (29 buildings in total) to a private open-ended U.S.
industrial fund (the “Fund”) in consideration for approximately $215 million in cash and an approximately 25% retained interest
in the Fund. As part of the transaction, the Trust will also transfer to the Fund $275.9 million of secured mortgages with an average
interest rate of 3.6%. A subsidiary of the Trust will provide property management, construction management, and leasing services
to the Fund at market rates. This is expected to provide a growing income stream to the Trust as the Fund scales in attractive U.S.
industrial markets. This transaction allows the Trust to continue to grow in attractive U.S. industrial markets, improving overall
portfolio quality and diversification, while maintaining an enhanced geographic mix.
Developments – The Trust has initiated a structured development program that allows it to add high-quality assets to its portfolio
in markets with steep barriers to entry. The Trust is focused on building and executing on a development program that capitalizes
on its predominantly urban portfolio across North America and Europe. The Trust has commenced three projects totalling
700,000 square feet in Las Vegas, Nevada, Richmond Hill, Ontario and Montréal, Québec, which are expected to be completed in
the next 12 months. Overall, the Trust’s near-term development pipeline exceeds 3.5 million square feet and the Trust expects to
have up to 5% of its total assets under active development at any point in time, with targeted yields on construction cost of
over 6%.
• The Trust has commenced construction of a 460,000 square foot Class A distribution facility on its 80% interest of a 24.5 acre
site in north Las Vegas in Q2 2021 with stabilization expected in 2023. The Trust estimates that the yield on construction cost
on this development will exceed 6%;
• At the Trust’s 527,000 square foot property in the Greater Montréal Area, the Trust intends to expand the property by
220,000 square feet. The intensification is expected to occur over two phases, and the construction of Phase 1 is well
underway with the building frame substantially complete. The Trust continues to advance Phase 2 of the project with
construction anticipated to start in Q3 2021. The Trust expects to achieve a yield on construction costs of over 6.5%;
• The Trust has finalized the development plans to expand its current 110,000 square foot asset located in the Greater Toronto
Area by an additional 43,000 square feet. The Trust intends to commence construction in Q3 2021 and expects to achieve a
yield on construction costs of approximately 8%; and
Dream Industrial REIT 2021 Second Quarter Report | 3• During Q2 2021, the Trust expanded its greenfield development program in the GTA with the acquisition of two land parcels
totalling 38 acres. The first site is a 30-acre parcel located in Brampton, Ontario that can support a 550,000 square foot logistics
facility with a targeted construction commencement date in the next 18 to 30 months. The second site is an eight acre parcel
located in Caledon, Ontario that can support the construction of a 150,000 square foot logistics facility in the next 12 months.
Combined, these two sites were acquired for less than $50 million, representing an attractive valuation of approximately $1.3
million per acre. The Trust expects to achieve an unlevered yield on cost of approximately 6% on these projects, which
represents a spread of 250 basis points compared to capitalization rates for comparable stabilized properties and should result
in meaningful NAV per unit growth.
Through the acquisition of the Pan-European logistics portfolio in Q2 2021, the Trust expanded its development pipeline in France,
the Netherlands and Germany by over one million square feet. The Trust is targeting yields on construction costs in excess of 7%
on these projects.
Capital strategy – The Trust continues to focus on growing and upgrading portfolio quality while increasing financial flexibility.
Since announcing its debt strategy at the beginning of 2020, the Trust has raised over $1.2 billion of unsecured debt, while repaying
approximately $300 million of secured debt. The Trust’s European expansion has allowed the Trust to swap these unsecured
borrowings into euro-equivalent borrowings at an average interest rate under 0.5%, including $800 million of unsecured
debentures swapped into euros at an average interest rate of only 0.35% during Q2 2021. The Trust’s debt strategy has allowed it
to reduce its average interest rate on its total debt outstanding by approximately 200 basis points or nearly 60%, from over 3.5%
to approximately 1.5% over this time period.
In the quarter the Trust finalized the Green Financing Framework and completed the successful issuance of $400 million in
Series C Debentures (Green Bonds). Financing proceeds will be allocated to sustainable projects which may include green buildings,
energy efficiency, renewable energy, sustainable water and waste-water management, and clean transportation. The deployment
of the proceeds is well underway and the Trust has already financed/refinanced or has identified over $300 million of eligible
projects to date, including over $200 million of green-certified assets acquired as part of the Pan-European logistics portfolio
transaction.
Subsequent to quarter-end, the Trust repaid approximately $168 million of Canadian mortgages bearing interest at an average
interest rate of 3.65% with a remaining term to maturity of 2.4 years. This is expected to result in the level of secured debt as a
proportion of total debt dropping to approximately 40%, while the unencumbered asset pool is expected to increase to over
$2.8 billion, representing approximately 60% of total assets. Pro forma the mortgage repayments and the U.S. fund transaction,
the Trust’s net total debt-to-assets ratio will decline to the mid-30% range and the Trust will retain over $550 million of liquidity,
which will allow it to acquire over $200 million of assets as well as repay secured debt, while maintaining its net total debt-to-
assets ratio in the targeted mid-to-high 30% range.
Environmental, social and governance (“ESG”) update
The Trust continues to actively pursue and execute the forward-looking plans that were identified in its 2019 Sustainability Report
issued in December 2020, which include data collection, ESG policy development, investments in clean power and green financing
opportunities.
During the quarter, the Trust expanded its tenant outreach plan to communicate and align its sustainability goals with key partners,
ascertain tenant interest in rooftop renewable energy and access energy consumption data that will drive opportunities to improve
efficiency.
The Trust continues to invest in light-emitting diode (“LED”) lighting upgrades to improve the energy efficiency of its properties
and has established a target to upgrade one million square feet of GLA in LED lighting in 2021. A total of 275,000 square feet of
GLA were upgraded to LED lighting during the quarter; the year-to-date cumulative total is 488,000 square feet. The Trust is
continuing to investigate opportunities to obtain green building certifications within its portfolio. The Trust is currently evaluating
the scope of work required to obtain certification on an initial set of six to eight buildings located in North America and Europe.
The Trust is looking to expand its green building certification program over time. In the quarter the Trust acquired eight buildings
in Europe with green building certifications, including over 2.1 million square feet (or 200,000 square metres) of buildings with an
Energy Performance Certificate (“EPC”) rating of B or higher. In addition to the high EPC ratings, three buildings are certified
Building Research Establishment Environmental Assessment Method (“BREEAM”) very good or higher, and one building has been
certified DGNB (“German Sustainable Building Council”) Gold.
The Trust is exploring opportunities to invest in clean power in its portfolio within Canada and the Netherlands. Including existing
panels, the Trust is targeting to install over 50,000 solar panels across 3.5 million square feet, representing over 10% of its total
portfolio. In Canada, the Trust is progressing with participation in a program launched by Emissions Reduction Alberta to install up
to 8,200 rooftop solar panels on several buildings in its portfolio. Pursuant to the subsidy that was granted by the Dutch
Dream Industrial REIT 2021 Second Quarter Report | 4government in 2020, the Trust is also progressing through its feasibility assessment of the installation of up to 38,600 solar panels
in the Netherlands.
The Trust continues to participate in a Diversity, Inclusion and Advancement Team to evaluate its current policies, practices and
culture through a diverse and inclusive lens to identify new approaches that will enhance its employees’ opportunities.
BASIS OF PRESENTATION
Our discussion and analysis of the financial position and results of operations of Dream Industrial Real Estate Investment Trust
(“Dream Industrial REIT” or the “Trust”) should be read in conjunction with the audited consolidated financial statements of Dream
Industrial REIT and the accompanying notes for the year ended December 31, 2020, and the unaudited condensed consolidated
financial statements of Dream Industrial REIT and the accompanying notes for the three and six months ended June 30, 2021. Such
consolidated financial statements have been prepared in accordance with International Financial Reporting Standards (“IFRS”) as
issued by the International Accounting Standards Board. The Canadian dollar is the functional and reporting currency for purposes
of preparing the condensed consolidated financial statements.
The chief operating decision-maker, determined to be the Chief Executive Officer of the Trust, considers the performance of assets
held for sale (except for those where the Trust will continue to retain an interest) and disposed properties separately from the
investment properties in the geographic segments, and discontinued operations (as applicable) separately from the segmented
income in the geographic segments. As at June 30, 2021, management had committed to a plan to sell 18 investment properties
in the U.S. to the Fund, in consideration for cash and an approximately 25% retained interest in the Fund, and the sales of these
properties were considered to be highly probable. Given that the Trust will retain an interest in the Fund, the Trust has included
the assets held for sale in our operating metrics throughout the MD&A as at June 30, 2021, unless otherwise noted.
This management’s discussion and analysis (“MD&A”) is dated as at August 3, 2021.
For simplicity, throughout this discussion, we may make reference to the following:
• “REIT Units”, meaning units of the Trust, excluding Special Trust Units;
• “LP B Units” and “subsidiary redeemable units”, meaning the Class B limited partnership units of Dream Industrial LP; and
• “Units”, meaning REIT Units and LP B Units.
When we use terms such as “we”, “us” and “our”, we are referring to Dream Industrial REIT and its subsidiaries.
Estimated market rents disclosed throughout the MD&A are management’s estimates at a point in time and are subject to change
based on future market conditions.
FORWARD-LOOKING DISCLAIMER
Certain information herein contains or incorporates comments that constitute forward-looking information within the meaning of
applicable securities legislation, including but not limited to statements relating to the Trust’s objectives and strategies to achieve
those objectives; the Trust’s expectations relating to the benefits to be realized from demand drivers for industrial space; the effect
of acquisitions on our leverage levels; the anticipated timing of closing of acquisitions; the expected going-in cap rate of
acquisitions; our acquisition pipeline; the transfer to the Fund of secured mortgages; the provision of property management,
construction management and leasing services to the Fund by a subsidiary of the Trust; the expectation of the Trust’s growing
income stream by having a subsidiary of the Trust provide property management, construction management, and leasing services
to the Fund; the pro forma composition of our portfolio after the completion of the acquisitions and potential development
opportunities, including the GLA to be added to the Trust’s portfolio following the acquisitions; our unencumbered assets ratio
and our level of secured debt as a proportion of total debt after the completion of acquisitions and debt repayments; the Trust’s
net debt-to-assets ratio pro forma the mortgage repayments and the U.S. fund transaction and the resulting liquidity which is
expected to be used for the acquisition of assets as well as the repayment of secured debt; our development and redevelopment
plans, including timing of construction commencement and intensification, timing for commencing construction and completion
of our developments, anticipated development yields and the percentage of the Trust’s total assets it expects to have under active
development; anticipated density and GLA that our excess land can accommodate; the Trust’s ability to deliver on ESG initiatives;
the Trust’s ability to obtain green building certifications for its portfolio and the expansion of its green building certification
program over time; the implementation and results of the Trust’s solar power programs; the Trust’s ability to obtain green bond
framework financing and the allocation of financing proceeds from the offering of Series C Debentures (Green Bonds) to
sustainable projects; the Trust’s portfolio strategy; the Trust’s ability to perform well operationally and financially through the
COVID-19 pandemic; the amount by which market rents exceed in-place rents; the Trust’s beliefs, plans, estimates, projections
and intentions; and similar statements concerning anticipated future events, future growth, future leasing activity, including those
Dream Industrial REIT 2021 Second Quarter Report | 5associated with the ability to lease vacant space and rental rates on future leases, results of operations, performance, business
prospects and opportunities, acquisitions or divestitures, tenant base, rent collection, future maintenance and development plans,
capital investments, financing, income taxes, litigation and the real estate industry in general. Forward-looking statements
generally can be identified by words such as “outlook”, “objective”, “strategy”, “may”, “will”, “would”, “expect”, “intend”,
“estimate”, “anticipate”, “believe”, “should”, “could”, “likely”, “plan”, “project”, “budget”, “continue”, or similar expressions
suggesting future outcomes or events. Forward-looking information is based on a number of assumptions and is subject to a
number of risks and uncertainties, many of which are beyond the Trust’s control, which could cause actual results to differ
materially from those disclosed in or implied by such forward-looking information. These risks and uncertainties include, but are
not limited to, general and local economic and business conditions; employment levels; the uncertainties around the timing and
amount of future financings; uncertainties surrounding the COVID-19 pandemic; the financial condition of tenants and borrowers;
leasing risks; interest rate and currency rate fluctuations; regulatory risks; environmental risks; our ability to sell investment
properties at a price that reflects fair value; and our ability to source and complete accretive acquisitions.
Although the forward-looking statements contained in this MD&A are based on what we believe are reasonable assumptions,
there can be no assurance that actual results will be consistent with these forward-looking statements. Factors that could cause
actual results to differ materially from those set forth in the forward-looking statements and information include, but are not
limited to, general economic conditions; the impact of the COVID-19 pandemic on the Trust; government measures to contain the
COVID-19 pandemic; local real estate conditions; timely leasing of vacant space and re-leasing of occupied space upon expiry;
dependence on tenants’ financial condition; the uncertainties of acquisition activity; the ability to integrate acquisitions; interest
rates; availability of equity and debt financing; our continued compliance with the real estate investment trust (“REIT”) exemption
under the specified investment flow-through trust (“SIFT”) legislation; and other risks and factors described from time to time in
the documents filed by the Trust with securities regulators.
All forward-looking information is as of August 3, 2021. Dream Industrial REIT does not undertake to update any such forward-
looking information whether as a result of new information, future events or otherwise, except as required by applicable law.
Additional information about these assumptions, risks and uncertainties is contained in our filings with securities regulators.
Certain filings are also available on our website at www.dreamindustrialreit.ca.
BACKGROUND
Dream Industrial REIT is an unincorporated, open-ended real estate investment trust. As at June 30, 2021, the Trust owns and
operates a portfolio comprising 215 assets totalling approximately 38.5 million square feet of gross leasable area in key markets
across North America and increasingly in strong European industrial markets. The Trust’s goal is to grow and upgrade the quality
of its portfolio which primarily consists of distribution and urban logistics properties. Our REIT Units are listed on the Toronto Stock
Exchange (“TSX”) under the trading symbol DIR.UN.
OUR STRATEGY
Dream Industrial REIT owns and operates a diversified portfolio of distribution, urban logistics and light industrial properties across
key markets in Canada, the U.S. and Europe. We are committed to:
• owning and operating a high-quality portfolio of industrial assets in markets with strong operating fundamentals;
• investing in our key markets in industrial assets offering long-term cash flow and net asset value growth prospects;
• maximizing the value of our industrial assets through innovative asset management strategies;
• providing compelling total returns to our unitholders, anchored by sustainable cash distributions; and
• integrating sustainability at the corporate and property levels.
Value enhancing growth
With a global acquisition platform, we have local, on-the-ground teams who have a strong track record of sourcing attractive
industrial assets across Canada, the U.S. and Europe. We have strong established relationships in all our local markets, which
allows us to source high-quality and accretive acquisitions with long-term cash flow and net asset value growth potential. When
evaluating potential acquisitions, we consider a variety of criteria, including expected cash flow returns; replacement cost of the
asset; its location, functionality and appeal to future tenants; sustainability attributes of the asset and how the asset complements
our existing portfolio; and per Unit accretion.
Dream Industrial REIT 2021 Second Quarter Report | 6Continuous portfolio optimization
We regularly evaluate and benchmark each individual asset in our portfolio, assessing historical and future performance as well
as value growth potential. We identify opportunities to recycle assets within our portfolio and reinvest the proceeds into higher
quality assets that are less management and capital intensive.
Active asset management
Through creative asset management strategies, such as initiating and executing on development projects, we are able to unlock
organic net operating income and net asset value growth. We actively manage our assets to optimize performance, maintain value,
and attract and retain tenants. We have local teams across our portfolio with over 80 real estate professionals highly experienced
in leasing, operations and portfolio management operating out of nine regional offices in our key markets. We strive to ensure
that our assets are the most attractive, efficient and cost-effective premises for our tenants.
Conservative financial policy
We operate our business in a disciplined manner with a focus on maintaining a strong balance sheet and liquidity position. We
seek to maintain a conservative leverage, naturally hedge foreign currency investments and build up a high-quality unencumbered
asset pool, while reducing borrowing costs and preserving liquidity.
Focus on environmental, social and governance
We focus on promoting the highest standards of corporate governance, social responsibility and ethical behaviour throughout our
organization. Our sustainability practices are primarily focused on: i) energy efficiency throughout our portfolio by integrating
sustainable building technology; ii) increasing tenant engagement; and iii) incorporating energy management initiatives into our
capital expenditure planning. Our social initiatives encompass three key areas: i) commitment to the development of employees
through continuous learning and promotion of healthy workplaces and lifestyles; ii) active commitment to the community and
local charitable organizations; and iii) commitment to tenant satisfaction and engagement. We continuously apply sound and
effective corporate governance practices in the day-to-day decisions and actions of our business. Our governance highlights
include: i) a diverse and experienced board with a majority of independent trustees; and ii) strong governance and transparency
in all aspects of our business.
SECTION II
OUR ASSETS
Dream Industrial REIT owns and operates a portfolio of 215 assets (317 industrial buildings) totalling approximately 38.5 million
square feet of gross leasable area in key markets across Canada, the U.S. and Europe as at June 30, 2021.
Across our regions, our portfolio consists of distribution, urban logistics and light industrial buildings.
• Distribution buildings – are highly functional large-bay buildings located in close proximity to major transportation corridors.
Most tenants at these buildings have e-commerce operations or are in the third-party logistics industry.
• Urban logistics buildings – are small- to mid-bay buildings located in close proximity to major population centres and are
ideally suited to meet last-mile distribution needs. They are typically multi-let with shorter lease terms and lower average
tenant size.
• Light industrial buildings – have a large footprint and are typically single-tenants. Tenants have typically invested significant
capital at these properties and have signed long-term leases or have taken occupancy for a long period of time.
On July 30, 2021, the Trust sold 18 of its U.S. assets (29 buildings in total) (the “Seed Portfolio”) to a private open-ended U.S.
industrial fund (the “Fund”) in consideration for expected net proceeds of approximately $215 million in cash and an approximately
25% retained interest in the Fund. The Seed Portfolio comprises 29 buildings totalling 7.3 million square feet. The Seed Portfolio
is 98% occupied with a weighted average lease term of 3.6 years, as at June 30, 2021. As at June 30, 2021, the Trust classified the
investment properties totalling $590.7 million as assets held for sale.
Focused portfolio strategy
In Canada, the Trust’s focus is on mid- to large-bay properties primarily in the GTA and the Greater Montréal Area where it expects
to benefit from increased user demand relative to supply of quality industrial product, and where in-place rental rates are generally
below market rental rates and the outlook for rental rate growth is robust. The Trust is also targeting to increase scale in our
existing sub-markets and add to its large urban logistics clusters.
Dream Industrial REIT 2021 Second Quarter Report | 7In the U.S., the Trust will continue to pursue long-term growth alongside strong institutional partners through its retained 25%
interest in the Fund. A subsidiary of the Trust will provide property management, construction management and leasing services
to the Fund at market rates. This is expected to provide a growing income stream to the Trust as the Fund scales in attractive U.S.
industrial markets. This transaction allows the Trust to continue to grow in attractive U.S. industrial markets, improving overall
portfolio quality and diversification, while maintaining an enhanced geographic mix.
In Europe, the Trust’s goal is to acquire mid- to large-bay properties in major Western European markets. Across these markets
there is growing demand for urban logistics space, increased user demand relative to supply of quality industrial product, attractive
going-in capitalization rates and upside potential from growth in market rents.
As at June 30, 2021, the Trust’s investment property value (including investment properties classified as assets held for sale) by
building type allocated by region is as follows:
* All dollar amounts in these charts are presented in millions.
Key property statistics by building type as at June 30, 2021 are summarized in the table below:
June 30, 2021
Distribution Urban logistics Light industrial
Number of assets(1) 110 78 27
Number of buildings 139 148 30
Owned GLA (thousands of square feet) 24,846 9,907 3,699
Site area (in acres) 1,381 629 205
(1) Number of assets comprises a building, or a cluster of buildings in close proximity to one another attracting similar tenants.
Development strategy
The Trust is focused on building and executing a development pipeline across its target markets. Our development strategy has
three key components: 1) greenfield development, 2) intensification of excess land on our income-producing properties, and
3) redevelopment of existing properties with the goal of achieving higher density and rents.
The greenfield development program is currently comprised of the 24.5 acre site in Las Vegas, of which the Trust holds an 80%
interest through a joint venture and commenced construction of the 460,000 square foot Class A logistics property during the
quarter. In addition, during the quarter, we acquired two parcels of land: a 30.0 acre site in Brampton, Ontario and an 8.0 acre
land parcel in Caledon, Ontario. We intend to complete the planning and zoning for the sites and anticipate the construction of
Class A distribution facilities in the near term of 550,000 square feet and 150,000 square feet, respectively.
Our excess land portfolio is comprised of over 25 sites in Ontario, Québec, Europe and the U.S. with over 120 acres of excess land
providing an opportunity to add up to 2.9 million square feet of GLA over time.
We continuously evaluate redevelopment opportunities across our portfolio from technical and financial feasibility perspectives.
Our current redevelopment pipeline is comprised of several sites in Ontario and Europe. The current density on these sites is
approximately 35%, providing for an opportunity to fully redevelop the properties with modern logistics space commanding higher
rents and leading to over 300,000 square feet of incremental GLA.
Dream Industrial REIT 2021 Second Quarter Report | 8During the quarter, we acquired a pan-European logistics portfolio in which multiple assets located in France, the Netherlands and
Germany included excess land, offering expansion potential of over one million square feet. These development opportunities are
expected to occur in the near term with a forecast yield on incremental development costs of over 7%.
The following table provides details on the Trust’s near-term development pipeline:
Current GLA Target GLA
Site area (in thousands (in thousands
Location Region (in acres) of sq. ft.) of sq. ft.) Current objective
Underway
Range Road, Las Vegas(1) U.S. 25 — 464 New development
401 Marie-Curie Boulevard, Montréal Québec 38 527 754 Intensification
100 East Beaver Creek, Richmond Hill Ontario 6 110 153 Intensification
Total underway 69 637 1,371
Planning
Whitby, ON Ontario 24 210 380 Redevelopment
Mississauga, ON Ontario 10 212 209 Redevelopment
Montréal, QC Québec 14 206 296 Intensification/Redevelopment
Montréal, QC Québec 17 225 300 Intensification/Redevelopment
Dresden, Germany Europe 30 274 515 Intensification
Brampton, ON Ontario 30 — 553 New development
Caledon, ON Ontario 8 — 152 New development
Total planning 133 1,127 2,405
Total near-term development pipeline 202 1,764 3,776
(1) Held through a joint venture of which the Trust owns an 80% interest.
Construction commenced on the Las Vegas development during the quarter, with completion targeted for early 2022.
We commenced construction of a two-phase intensification project at 401 Marie-Curie Boulevard, a 527,000 square foot Class A
distribution facility in the Greater Montréal Area. The property is situated on 38.4 acres of land with site coverage of 32%, offering
the opportunity to increase the property’s footprint by approximately 227,000 square feet, taking coverage to 45%. The first phase
of construction for 131,000 square feet is well underway with structural steel erected and roof decking substantially completed.
The second phase for 96,000 square feet will commence in the third quarter of 2021. We expect to achieve a yield on construction
costs of over 6.5%.
Also, in the near term, we intend to expand an existing 110,000 square foot property in the GTA: 100 East Beaver Creek, located
in Richmond Hill, close to Highways 404 and 407. We expect to add 43,000 square feet in Q3 2021, with an expected yield on
construction costs of over 8.0%. The design-builder has been engaged with municipal approvals underway, advancing this project
to the next stage of development construction.
During the quarter, the Trust acquired multiple assets located in France, the Netherlands and Germany with an excess land
component, offering expansion potential of over one million square feet. These development opportunities are expected to occur
in the near term with a forecast yield on incremental development costs of over 7%.
Dream Industrial REIT 2021 Second Quarter Report | 9Tenant base profile
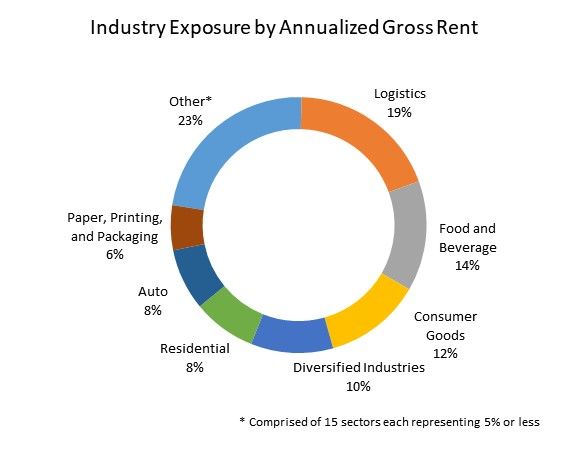
Our portfolio comprises primarily functional distribution and warehousing space occupied by tenants from various industries, with
no one industry accounting for more than 20% of annualized gross rent. As at June 30, 2021, the Trust had over 1,100 tenants
(including those tenants occupying investment properties classified as assets held for sale).
The following charts show the industries in which our tenants operate, and their use of space based on annualized gross rental
revenue as at June 30, 2021:
The following charts show the tenant size breakdown by annualized gross rental revenue and the tenant size breakdown by number
of tenants as at June 30, 2021:
Approximately 82% of our annualized gross rental revenue is derived from over 350 tenants each occupying over 15,000 square
feet with an average size of approximately 96,000 square feet. The remaining annualized gross rental revenue is derived from just
over 800 smaller tenants primarily located in the urban logistics assets.
Dream Industrial REIT 2021 Second Quarter Report | 10The following table outlines the contributions of our top ten tenants to our annualized gross rental revenue as at June 30, 2021:
Gross rental Thousands of WALT
Tenant Use of space revenue sq. ft. (years)
Auchan Supermarché Plaisir Distribution & warehousing 3.2% 1,577 6.4
Nissan North America Inc. Distribution & warehousing 2.2% 1,189 3.5
TC Transcontinental Distribution & warehousing, light industrial 1.3% 523 3.8
Conforama Distribution & warehousing 1.3% 597 0.9
Immeubles RB Ltd. Distribution & warehousing 1.1% 419 3.9
Gienow Windows and Doors Distribution & warehousing, light industrial 1.1% 371 7.9
RLS Slovakia, s.r.o. Distribution & warehousing 1.0% 597 7.0
Spectra Premium Industries Inc. Distribution & warehousing, light industrial 1.0% 472 3.9
DHL Supply Chain s.r.o. Distribution & warehousing 1.0% 660 6.0
ODW Logistics, Inc. Distribution & warehousing 0.9% 343 2.5
Total 14.1% 6,748 4.8
On January 1, 2021, Spectra Premium Industries Inc. vacated its Laval, Québec location, reducing its contribution to 1.0% of
annualized gross rental revenue. No impact is expected on the other two properties currently occupied by Spectra Premium
Industries Inc. which total 472,000 square feet. The Trust re-leased the Laval space with the new lease that commenced during
the quarter on June 1, 2021.
Assets (also known as investment properties) comprise a building, or a cluster of buildings in close proximity to one another
attracting similar tenants. Many of our buildings form parts of larger clusters and business parks. As part of our asset management
strategy, we approach these clusters as a single asset for the purposes of capital allocation, leasing and property
management initiatives.
The table below summarizes the grouping of buildings into property clusters by region as at June 30, 2021 and December 31, 2020:
June 30, 2021 December 31, 2020
Owned GLA Owned GLA
Number of Number of (thousands of Number of Number of (thousands of
buildings assets sq. ft.) buildings assets sq. ft.)
Ontario 82 46 7,031 79 47 6,758
Québec 45 32 5,435 40 29 4,278
Western Canada 81 43 5,084 81 43 5,079
Canadian portfolio 208 121 17,550 200 119 16,115
U.S. portfolio 31 20 7,698 29 18 7,276
European portfolio 78 74 13,204 42 40 3,885
Total portfolio 317 215 38,452 271 177 27,276
Dream Industrial REIT 2021 Second Quarter Report | 11OUR OPERATIONS
The following key performance indicators related to our operations influence the cash generated from operating activities.
Total portfolio in-place and committed occupancy
Our in-place and committed occupancy includes lease commitments totalling approximately 238,000 square feet for space that is
being readied for occupancy but for which rental revenue is not yet recognized.
The following table details our total portfolio in-place and committed occupancy by region:
Total portfolio
June 30, March 31, June 30,
(percentage) 2021 2021 2020
Ontario 96.2 97.9 96.2
Québec 98.5 98.5 98.8
Western Canada 95.9 94.2 94.6
Canadian portfolio 96.8 97.0 96.4
U.S. portfolio 98.8 97.8 94.0
European portfolio 99.2 97.2 95.6
Total 98.0 97.2 95.6
In-place and committed occupancy in Ontario decreased by 170 bps relative to March 31, 2021 primarily driven by the acquisition
of a 101,000 square foot vacant building in Kitchener. Located adjacent to our existing clusters, this building provides a value-add
opportunity for the Trust. During the quarter, 241,000 square feet of new leases and 75,000 square feet of renewals commenced
compared to 154,000 square feet of expiries. The Trust continues to actively market the vacant spaces and address future renewals
to capture higher rents. On a year-over-year basis, in-place and committed occupancy remained consistent relative to June 30,
2020.
In-place and committed occupancy in Québec remained relatively consistent from the prior quarter and June 30, 2020. During the
quarter, 215,000 square feet of new leases and 110,000 square feet of renewals commenced compared to 157,000 square feet of
expiries. The Trust continues to actively market the vacant spaces and address future renewals to capture higher rents.
In-place and committed occupancy in Western Canada increased by 170 bps compared to the prior quarter and 130 bps relative
to June 30, 2020, primarily due to 167,000 square feet of new and renewed leases taking occupancy during the quarter and
156,400 square feet of lease commitments on previously vacant space, partially offset by 134,000 square feet of lease expirations.
In-place and committed occupancy in the U.S. increased by 100 bps and 480 bps relative to March 31, 2021 and June 30, 2020,
respectively. The increase is due to positive leasing absorption resulting from the new lease that commenced last quarter with a
subsidiary of Amazon on 302,500 square feet of previously vacant space in Q2 2020. Additionally, the Trust entered into
69,000 square feet of new and committed leases during the quarter.
In-place and committed occupancy in Europe increased by 200 bps quarter-over-quarter and 360 bps compared to the prior year
comparative quarter, primarily as a result of the Pan-European logistics portfolio, which was newly acquired on June 24, 2021 and
was fully leased.
Dream Industrial REIT 2021 Second Quarter Report | 12Total portfolio occupancy continuity
The following tables detail the changes in in-place and committed occupancy across our Canadian, U.S. and European portfolios
for the three and six months ended June 30, 2021:
Three months ended June 30, 2021
Canadian portfolio U.S. portfolio European portfolio Total portfolio
Thousands Percentage Thousands Percentage Thousands Percentage Thousands Percentage
of sq. ft. of GLA of sq. ft. of GLA of sq. ft. of GLA of sq. ft. of GLA
Occupancy (in-place and committed) at
beginning of period 16,713 97.0% 7,252 97.8% 4,026 97.2% 27,991 97.2%
Vacancy committed for future occupancy (439) (2.6%) — —% (1) —% (440) (1.5%)
Occupancy (in-place) at beginning of period 16,274 94.4% 7,252 97.8% 4,025 97.2% 27,551 95.7%
Occupancy related to acquired properties
and remeasurements 208 282 9,063 9,553
Occupancy (in-place) at beginning of
period – adjusted 16,482 93.9% 7,534 97.9% 13,088 99.1% 37,104 96.5%
Natural expiries and relocations (445) (2.5%) (256) (3.3%) (242) (1.8%) (943) (2.5%)
Early terminations (45) (0.3%) — —% — —% (45) (0.1%)
New leases 558 3.2% 16 0.2% 17 0.1% 591 1.5%
Renewals and relocations 252 1.4% 256 3.3% 230 1.8% 738 2.0%
Occupancy (in-place) at period-end 16,802 95.7% 7,550 98.1% 13,093 99.2% 37,445 97.4%
Vacancy committed for future occupancy 184 1.1% 54 0.7% — —% 238 0.6%
Occupancy (in-place and committed) at
period-end 16,986 96.8% 7,604 98.8% 13,093 99.2% 37,683 98.0%
Six months ended June 30, 2021
Canadian portfolio U.S. portfolio European portfolio Total portfolio
Thousands Percentage Thousands Percentage Thousands Percentage Thousands Percentage
of sq. ft. of GLA of sq. ft. of GLA of sq. ft. of GLA of sq. ft. of GLA
Occupancy (in-place and committed) at
beginning of period 15,620 96.9% 6,735 92.6% 3,732 96.1% 26,087 95.6%
Vacancy committed for future occupancy (229) (1.4%) (27) (0.4%) — —% (256) (0.9%)
Occupancy (in-place) at beginning of
period 15,391 95.5% 6,708 92.2% 3,732 96.1% 25,831 94.7%
Occupancy related to acquired properties
and remeasurements 1,343 422 9,318 11,083
Occupancy (in-place) at beginning of
period – adjusted 16,734 95.4% 7,130 92.6% 13,050 98.8% 36,914 96.0%
Natural expiries and relocations (1,387) (7.9%) (341) (4.4%) (356) (2.6%) (2,084) (5.4%)
Early terminations (257) (1.5%) — —% — —% (257) (0.7%)
New leases 920 5.2% 420 5.5% 134 1.0% 1,474 3.8%
Renewals and relocations 792 4.5% 341 4.4% 265 2.0% 1,398 3.7%
Occupancy (in-place) at period-end 16,802 95.7% 7,550 98.1% 13,093 99.2% 37,445 97.4%
Vacancy committed for future occupancy 184 1.1% 54 0.7% — —% 238 0.6%
Occupancy (in-place and committed) at
period-end 16,986 96.8% 7,604 98.8% 13,093 99.2% 37,683 98.0%
The overall tenant retention ratio across our portfolio for the three and six months ended June 30, 2021 was 78.3% and 67.1%
respectively. Tenant retention ratio is calculated as the ratio of total square feet of renewed and relocated space over natural
expiries and relocations.
Dream Industrial REIT 2021 Second Quarter Report | 13New lease, renewal and relocation spreads
The following table details the new lease, renewal and relocation spreads for deals transacted from April 1, 2021 to July 31, 2021
across our total portfolio and that took occupancy during the quarter and beyond:
Thousands of sq. ft. Rental rate spread(1)
Ontario 311 70.4%
Québec 338 56.9%
Western Canada 487 (5.0%)
Canadian portfolio 1,136 26.0%
U.S. portfolio 208 16.9%
European portfolio 289 7.4%
(1) Rental rate spread (%) is calculated as the ratio of rental rate spread (per sq. ft.) divided by the weighted average prior and expiring rate (per sq. ft.). Rental rate
spread (per sq. ft.) is calculated as the difference between the weighted average new, renewal and relocation rate and the weighted average prior and expiring
rate. Rental rate spread excludes deals on leased space that has been vacant upon acquisition.
The following table details the new lease, renewal and relocation spreads for deals transacted from January 1, 2021 to July 31,
2021 across our total portfolio and that took occupancy during the quarter and beyond:
Thousands of sq. ft. Rental rate spread(1)
Ontario 715 60.1%
Québec 649 30.0%
Western Canada 708 (3.8%)
Canadian portfolio 2,072 24.5%
U.S. portfolio 652 14.0%
European portfolio 396 7.8%
(1) Rental rate spread (%) is calculated as the ratio of rental rate spread (per sq. ft.) divided by the weighted average prior and expiring rate (per sq. ft.). Rental rate
spread (per sq. ft.) is calculated as the difference between the weighted average new, renewal and relocation rate and the weighted average prior and expiring
rate. Rental rate spread excludes deals on leased space that has been vacant upon acquisition.
For the three and six months ended June 30, 2021, our leasing team transacted approximately 1.6 million and 3.1 million square
feet of leasing activity, respectively. Rental spreads were strong in Ontario, Québec, the U.S. and Europe, reflecting the robust
demand for industrial space. In Western Canada, the slightly negative rental spreads were paired with contractual rental steps
within these leases to capture some future rental growth.
Total portfolio rental rates
Average in-place and committed base rent is contractual base rent and excludes recoveries and recoverable tenant inducements.
The following table details the average in-place and committed base rent by region for our total portfolio:
Average in-place and committed base rent (per sq. ft.)
Total portfolio June 30, 2021 March 31, 2021 June 30, 2020
Ontario $ 7.46 $ 7.38 $ 6.85
Québec 6.98 6.85 6.60
Western Canada 8.72 8.74 8.75
Canadian portfolio $ 7.67 $ 7.60 $ 7.38
U.S. portfolio (US$) $ 4.12 $ 4.05 $ 3.95
European portfolio (€) € 4.51 € 5.20 € 5.16
As at June 30, 2021, the average in-place and committed base rent for our Canadian portfolio was $7.67 per square foot, compared
to $7.60 per square foot as at March 31, 2021 and $7.38 per square foot as at June 30, 2020. The increase in the Canadian portfolio
is driven by higher in-place rents on acquisitions closed in the quarter, as well as lease renewals and future lease commitments
capturing strong positive rental rate spreads primarily in the Ontario and Québec regions, partially offset by negative rental rate
spreads in Western Canada.
As at June 30, 2021, the average in-place and committed base rent for our U.S. portfolio was US$4.12 per square foot, compared
to US$4.05 per square foot as at March 31, 2021 and US$3.95 per square foot as at June 30, 2020. The increase is due to strong
rental spreads on lease rollovers in Cincinnati and Columbus as well as strong in-place rent from an acquired property in
Indianapolis during the quarter.
Dream Industrial REIT 2021 Second Quarter Report | 14As at June 30, 2021, the average in-place and committed base rent for our European portfolio was €4.51 per square foot, compared
to €5.20 per square foot as at March 31, 2021 and €5.16 per square foot as at June 30, 2020. The decrease in weighted average
in-place rent was attributable to acquired properties in Spain, Slovakia and Czech Republic within the Pan-European logistics
portfolio, availing us of the opportunity to drive rental rates higher as current in-place rents in this portfolio are approximately
10% below market.
The following table compares the average in-place and committed base rent per square foot with our estimated market rent per
square foot by region for our total portfolio as at June 30, 2021:
June 30, 2021
Estimated market
Average in-place and Estimated rent/average in-place
committed base rent market rent and committed WALT
Total portfolio (per sq. ft.) (per sq. ft.) base rent (years)
Ontario $ 7.46 $ 10.27 37.7% 4.7
Québec 6.98 8.16 16.9% 3.6
Western Canada 8.72 8.74 0.2% 3.4
Canadian portfolio $ 7.67 $ 9.17 19.6% 4.0
U.S. portfolio (US$) $ 4.12 $ 4.27 3.6% 3.6
European portfolio (€) € 4.51 € 4.84 7.3% 5.0
Total portfolio WALT (years) 4.3
Estimated market rent represents management’s best estimate of the base rent that would be achieved in a new arm’s length
lease in the event that a unit becomes vacant after a reasonable marketing period, with an inducement and lease term appropriate
for the particular space. Market rent by property is reviewed regularly by our leasing and portfolio management teams. Market
rents may differ by property or by unit and depend upon a number of factors. Some of the factors considered include the condition
of the space, the location within the building, the amount of office build-out for the units, the lease term and a normal level of
tenant inducements. Market rental rates are also compared quarterly against recent comparable lease deals in each market and
quarterly independent external appraisal information, if applicable. The current estimated market rents are at a point in time, with
no allowance for increases in future years, and are subject to change based on future market conditions in the respective regions.
As a result of when leases are executed, there is typically a lag between estimated market rents and average in-place and
committed base rent.
Lease maturity profile, net of lease commitments
The following table details our total portfolio lease maturity profile by region, net of renewals and new leases completed as at
June 30, 2021:
Total portfolio Vacancy, net of Remainder
(in thousands of sq. ft.) commitments of 2021 2022 2023 2024 2025 2026+ Total
Ontario 269 96 673 974 676 1,173 3,170 7,031
Québec 84 36 759 1,137 1,093 880 1,446 5,435
Western Canada 211 378 762 1,067 749 543 1,374 5,084
Canadian portfolio 564 510 2,194 3,178 2,518 2,596 5,990 17,550
U.S. portfolio 94 78 914 2,020 760 535 3,297 7,698
European portfolio 111 292 2,443 803 837 697 8,021 13,204
Total GLA 769 880 5,551 6,001 4,115 3,828 17,308 38,452
Percentage of total GLA 2.0% 2.3% 14.4% 15.6% 10.7% 10.0% 45.0% 100.0%
Dream Industrial REIT 2021 Second Quarter Report | 15Lease expiry profile for remainder of 2021
The following table details our total portfolio lease maturity profile for the remainder of 2021 by region, net of renewals and net
of committed new leases on vacant space:
Total portfolio Western Canadian U.S. European
(in thousands of sq. ft.) Ontario Québec Canada portfolio portfolio portfolio Total
2021 expiries (as at June 30, 2021) (279) (304) (600) (1,183) (457) (292) (1,932)
Expiries committed for renewals 183 268 222 673 379 — 1,052
Expiries, net of committed renewals (96) (36) (378) (510) (78) (292) (880)
Commitment as a % of expiries 65.6% 88.2% 37.0% 56.9% 82.9% —% 54.5%
Current vacancies (289) (91) (368) (748) (148) (111) (1,007)
Current vacancies committed for future occupancy 20 7 157 184 54 — 238
Current vacancies, net of commitments for future occupancy (269) (84) (211) (564) (94) (111) (769)
Net rental income from continuing operations
Net rental income is defined by the Trust as total investment properties revenue less investment properties operating expenses
from continuing operations.
For a detailed discussion about investment properties revenue and operating expenses from continuing operations for the three
and six months ended June 30, 2021 and June 30, 2020, refer to the section “Our Results of Operations”.
Three months ended June 30, Six months ended June 30,
2021 2020 2021 2020
Amount % Amount % Amount % Amount %
Ontario $ 13,511 26% $ 11,300 27% $ 26,121 27% $ 22,279 27%
Québec 9,259 18% 6,982 16% 16,744 17% 13,752 17%
Western Canada 10,556 21% 9,968 24% 21,108 21% 20,619 25%
Canadian portfolio 33,326 65% 28,250 67% 63,973 65% 56,650 69%
U.S. portfolio 9,363 18% 9,503 22% 18,503 19% 18,569 23%
European portfolio 8,406 17% 4,628 11% 15,281 16% 6,920 8%
Properties sold — —% (3) 0% — —% (20) 0%
Net rental income from continuing operations $ 51,095 100% $ 42,378 100% $ 97,757 100% $ 82,119 100%
Net rental income from continuing operations for the three and six months ended June 30, 2021 increased by $8.7 million, or
20.6%, and $15.6 million, or 19.0%, respectively, over the prior year comparative periods. The increase was mainly driven by the
impact of acquired investment properties in 2021 and 2020, as well as comparative properties NOI growth in the first half of 2021.
Comparative properties NOI and comparative properties NOI (constant currency basis)
Year-over-year comparison
Comparative properties NOI (constant currency basis) is a non-GAAP measure used by management in evaluating the performance
of properties fully owned by the Trust in the current and prior year comparative periods, using a constant currency basis.
Comparative properties NOI (constant currency basis) is lower during periods of free rent to reflect that there is no cash rent
received. For accounting purposes, free rent is recorded and amortized within straight-line rent. See “Non-GAAP Measures and
Other Disclosures” for a description of these non-GAAP measures.
Dream Industrial REIT 2021 Second Quarter Report | 16You can also read