R 349 - Questioni di Economia e Finanza (Occasional Papers) - Banca d'Italia
←
→
Page content transcription
If your browser does not render page correctly, please read the page content below

Questioni di Economia e Finanza
 (Occasional Papers)

 Capital and labour (mis)allocation in the euro area:
 some stylized facts and determinants

 by Elisa Gamberoni, Claire Giordano and Paloma Lopez-Garcia
September 2016

 349
 Number


Questioni di Economia e Finanza
(Occasional papers)

Capital and labour (mis)allocation in the euro area:
some stylized facts and determinants

by Elisa Gamberoni, Claire Giordano and Paloma Lopez-Garcia

Number 349 – September 2016
The series Occasional Papers presents studies and documents on issues pertaining to
the institutional tasks of the Bank of Italy and the Eurosystem. The Occasional Papers appear
alongside the Working Papers series which are specifically aimed at providing original contributions
to economic research.

 The Occasional Papers include studies conducted within the Bank of Italy, sometimes
in cooperation with the Eurosystem or other institutions. The views expressed in the studies are those of
the authors and do not involve the responsibility of the institutions to which they belong.

 The series is available online at www.bancaditalia.it .

ISSN 1972-6627 (print)
ISSN 1972-6643 (online)

Printed by the Printing and Publishing Division of the Bank of Italy

CAPITAL AND LABOUR (MIS)ALLOCATION IN THE EURO AREA:
 SOME STYLIZED FACTS AND DETERMINANTS

 by Elisa Gamberoni*, Claire Giordano† and Paloma Lopez-Garcia*

 Abstract
 We analyse the evolution of capital and labour (mis)allocation across firms in five euro-
area countries (Belgium, France, Germany, Italy and Spain) and eight main sectors of the
economy during the period 2002-2012. Three key stylized facts stand out. First, in all
countries except Germany, capital allocation worsened over time whereas the efficiency of
labour reallocation did not change significantly. Second, the observed increase in capital
misallocation has been particularly marked in services compared with industry. Third,
misallocation of both labour and capital decreased in all countries in 2009 and again for some
countries/sectors in 2011-2012. We then take stock of the possible drivers of input
misallocation dynamics in a standard panel regression framework. Restrictive bank lending
standards and heightened demand uncertainty in certain years led to growth in capital
misallocation, whereas since 2002 overall deregulation in both the product and labour markets
has helped dampen input misallocation dynamics. Controlling for all variables, the Great
Recession per se improved the allocative efficiency of both capital and labour.

JEL Classification: D24, D61, O47.
Keywords: total factor productivity, allocative efficiency, capital, labour, Great Recession.

 Contents
1. Introduction ......................................................................................................................... 5
2. The measurement of input misallocation ............................................................................ 9
3. Developments in labour and capital misallocation in selected euro-area countries.......... 12
4. The determinants of input misallocation: panel regression analysis ................................. 18
5. Conclusions ....................................................................................................................... 32
Annex A. The reallocation of resources from the non-tradable to the tradable sectors ........... 34
Annex B. Hsieh and Klenow’s (2009) model .......................................................................... 36
Annex C. The CompNet database and the measurement of input misallocation ..................... 38
Annex D. Additional descriptive evidence on input misallocation .......................................... 40
Annex E. The impact of labour and capital misallocation on TFP growth:
 a counterfactual exercise ....................................................................................................... 44
Annex F – Additional information on the determinants of changes in input misallocation .... 47
Annex G. Robustness checks ................................................................................................... 48
References ................................................................................................................................ 54

*
 DG Economics, European Central Bank.
†
 DG Economics, European Central Bank and DG Economics, Statistics and Research, Banca d’Italia.
Corresponding author: claire.giordano@bancaditalia.it.


1. Introduction 1

 Poor total factor productivity (TFP) growth has been a key issue in the euro area over the
last years. During the period 2002-2007 TFP dynamics dampened real GDP growth in Italy,
Portugal and Spain, whereas they boosted output performance in the Northern euro-area countries
(Figure 1; left hand side panel). Following the start of the Great Recession, however, TFP
negatively contributed to real GDP growth in all euro-area countries, albeit to a greater extent in the
Southern countries (Figure 1; right hand side panel). Cross-country empirical analysis is therefore
required to better understand the factors behind the diverging TFP performance of euro-area
countries.

 Figure 1. Contributions of production factors to real GDP growth
 (annual average growth rates)

 2002-2007 2008-2014
 Labour input ICT capital Non-ICT capital Total factor productivity GDP growth

6

5

4

3

2

1

0

-1

-2

Source: Conference Board.

 Aggregate TFP growth depends both on technology improvements within firms (within-firm
TFP growth) and on the efficiency with which production factors are allocated across firms
(between-firm TFP growth). If technology and knowledge flow freely and quickly across firms and
countries (Comin and Hobijn 2010) we would expect a convergence in cross-country within-firm
productivity growth rates and possibly in levels. Therefore remaining cross-country differences in
TFP growth would be explained by differences in so-called allocative efficiency, or the efficiency
with which resources are allocated across heterogeneous firms (Bartelsman, Haltiwanger and
Scarpetta 2013). Recent OECD research (Adalet McGowan et al. 2015), however, has pointed out
that technology diffusion has slowed down since the early 2000s. Moreover, Comin and Mestrieri
(2014) show that even if new technologies spread quickly across countries, they spread slowly to all
firms in a given economy. Lastly, cross-country differences in within-firm productivity growth may
also be explained by additional factors other than technology. 2 Hence, there is currently a consensus
that observed differences in aggregate TFP growth across countries respond to both differences in
within-firm and between-firm productivity growth. This paper focuses on the between-firm factor.

1
 We would like to thank Katerina Gradeva and Giovanni Palmioli for data assistance; Simone Emiliozzi for sharing
data with us; Valentina Dissette for editorial assistance; Matteo Bugamelli, Jan de Loecker, Filippo di Mauro, Ettore
Dorrucci, Andrea Gerali, Pavlos Karadeloglou, Hans-Joachim Klockers, Stefano Neri, Peter Praet, Fabiano Schivardi,
Zoltan Wolf, Roberta Zizza, Francesco Zollino and all participants of seminars held at the ECB, OECD, Girona
University, the Economic Institute of Barcelona and of the CompNet ECB-CNB conference held in Prague for useful
comments and suggestions on previous versions of the paper. Any errors remain the responsibility of the Authors. The
views here expressed are those of the Authors and not of the Institutions represented.
2
 There are many other determinants that may explain differences in within-firm productivity, such as differences in
management, in the quality of labour and capital or in firms’ organizational structure (see Foster, Haltiwanger and
Krizan 2001 and Syverson 2011 for detailed surveys).

 5
The two components of TFP growth – technical efficiency and reallocation of resources –
are not mutually exclusive and are both important sources of aggregate growth, in the short and in
the long run. However, it is difficult to pin down a magnitude for their relative contributions, as
these are highly dependent on the country, sector, period and decomposition methodology
employed. For example, at the two extremes, Foster, Haltiwanger and Krizan (2006) find that
aggregate productivity growth in the U.S. retail sector is almost exclusively due to the exit of less
efficient firms which contributes to a better allocation of resources, whereas Schmitz (2005)
estimates that productivity growth in the U.S. iron mining sector is driven almost entirely by within-
firm efficiency improvements. A plausible estimate of the relative magnitude of within-firm and
between-firm productivity growth in manufacturing, for example, is approximately 50 per cent for
each component, figure which is obtained as an average of estimates provided in selected studies
and summarised in Table 1.

 Table 1. Contribution of within vs. between productivity growth
 to manufacturing TFP growth, selected studies
 (percentage shares)
 Foster, De Loeker Petrin,
 Baily, Hulten Aw, Chen and Haltiwanger and White and
 and Campbell Roberts and Krizan Konings Reiter
Reference (1992) (1997)* (2006) (2006) (2011)
Country US Taiwan US Slovenia US
Years 1972-1987 1981-1991 1977-1987 1995-2000 1977-1996
Within-firm productivity growth 37 63 57 62 45
Reallocation 63 37 44 38 55
Note: All figures refer to manufacturing. (*) Median growth rates.

 Resources are reallocated across firms operating in the same sector, or in different sectors,
as a result of firm expansion and contraction as well as firm entry and exit. In this paper, due to data
limitations, we are not able to disentangle the contribution of net entry from the shift of resources
across incumbent firms operating within the same sector. 3 Furthermore, we disregard movements of
resources between sectors. 4 On this point, however, Davis and Haltiwanger (1991) report that,
across a variety of studies, only about 10 per cent of resource reallocation reflects shifts of
employment opportunities across industries, suggesting that the within-sector reallocation is the
most important channel; similar results are found by Garcia-Santana et al. (2016) specifically for
Spain. 5 In Annex A we too argue why across-sector reallocation is less relevant than within-sector
movements on the basis of firm-level data for selected euro-area countries.
 The degree of misallocation of resources across firms operating in the same sector may be
measured in several ways. The two most popular measures have been put forth by Hsieh and
Klenow (2009) and Olley and Pakes (1996). Hsieh and Klenow (2009) show that under certain
assumptions input misallocation can be measured by the within-sector dispersion in the marginal
productivity, in value terms, of factors of production (i.e. the change in total revenue earned by a
firm that results from employing one more unit of capital or labour). Alternatively, following the

3
 See Bartelsman, Lopez-Garcia and Presidente (2016) for a focus on the contribution to labour productivity growth of
the expansion and contraction of incumbent firms in selected euro-area countries.
4
 A recent paper on between-sector reallocation of labour in twenty advanced economies over the past forty years is
Borio et al. (2015), to which we refer.
5
 The reallocation of resources between sectors was instead particularly important in previous historical periods when
inputs flowed from the less productive agriculture sector to the more productive manufacturing sector. For example, see
Broadberry, Giordano and Zollino (2013) for the significant contribution of labour reallocation based on a shift-share
analysis of Italy’s labour productivity growth in the years 1861-2010 or see OECD (2003) for a focus on more recent
periods since the 1970s and on a cluster of countries.

 6

Olley and Pakes decomposition (1996), allocative efficiency can be captured by the covariance
between within-industry firm size and productivity. In this paper we choose the within-sector
dispersion in marginal productivity as our preferred measure of misallocation, although we then
check the robustness of our findings by employing the Olley-Pakes measure. Furthermore, we also
compute the indicator of resource misallocation proposed by Petrin and Sivadasan (2013), which
relaxes the assumption of equal marginal costs across firms underlying Hsieh and Klenow’s (2009)
framework.
 According to the recent empirical literature stemming from Hsieh and Klenow (2009) and
referring to European countries, misallocation of resources has been observed in euro-area countries
over the past 15 years, partially explaining their poor TFP performance. In particular, Gopinath et
al. (2015) show that the dispersion in the marginal revenue productivity of capital within the
manufacturing sector in Italy and Spain increased during 1999-2014, with an acceleration during the
Great Recession years. Garcia-Santana et al. (2016) consider several sectors in Spain other than
manufacturing during the period 1995-2007 and show that within-sector productivity dispersions
increased in the period under analysis, particularly in industries characterized by larger State
intervention (e.g. through licensing or regulations). They also find that small and young firms in
Spain faced higher market distortions than large and mature firms. Calligaris (2015) finds that
during the period 1993-2011 the significant and increasing input misallocation in the Italian
manufacturing branches was higher for firms located in Southern Italy, for those characterized by
low-technological intensity, as well as for small or young enterprises. Calligaris et al. (2016) extend
the analysis also to non-manufacturing sectors in Italy and to a longer time span (1993-2013),
finding instead that it is the large firms and those located in the Northwest that have been involved
in rising misallocation. Moreover, whereas misallocation fell in manufacturing during the recent
recessionary years, it appears to have increased in the non-manufacturing sectors. Finally, Dias,
Robalo Marques and Richmond (2014) find that input misallocation in Portugal increased during
the period 1996-2011, particularly in services.
 As seen, the existing evidence on resource misallocation is limited in terms of either country
(mainly one) or sector (mainly manufacturing) coverage. Moreover, these studies often cover solely
capital misallocation (e.g. Gopinath et al. 2015) or do not disentangle the different types of input
misallocation (e.g. Calligaris 2015; Calligaris et al. 2016). Based on CompNet data, this paper
instead provides a comprehensive analysis of both capital and labour misallocation across the main
service and industrial sectors in five euro-area countries (Belgium, France, Germany, Italy and
Spain) during the period 2002-2012. To our knowledge, this is the first paper in the literature on
core euro-area countries with such a wide country and/or sector coverage. 6 The cross-country
coverage of the analysis is crucial to identify common patterns, if any, in input misallocation and
the role played to explain those patterns by cyclical conditions and structural policies.
 Our analysis reveals three stylized facts. First, in all countries, with the exception of
Germany, capital allocation has worsened over time since 2002 whereas the efficiency of labour
allocation has not changed as dramatically. This piece of evidence confirms the importance of
analysing labour and capital misallocation trends separately. Second, the observed increase in
capital misallocation at the country level has been driven by the developments of services rather
than industry, suggesting that analyses focused solely on manufacturing may be grossly
underestimating misallocation dynamics and cross-sector heterogeneity. Third, misallocation of
both labour and capital dropped in the acutest year of the Great Recession (2009) in all countries
but recovered thereafter, although falling again in some country-sectors in 2011-2012, when the
sovereign debt crisis erupted.
 The paper then investigates the potential determinants of changes in input misallocation: a
better knowledge of the obstacles to within-sector reallocation processes is essential in order to
design sound and effective policies. As pointed out by the literature, strict product market
6
 A similarly wide country and sector coverage is found in Gamberoni et al. (2016) but this analysis refers to a sample
of Central and Eastern European countries.

 7

regulations, particularly those sheltering firms from international or new firm competition, might
result in poor allocation of resources because low productive firms will continue operating instead
of downsizing or exiting (Schiantarelli 2008; Restuccia and Rogerson 2013; Andrews and Cingano
2014). Stringent labour market regulation, in the form of high hiring and firing costs, might also
thwart resource allocation in sectors characterised by high job churning rates and risky
technologies, where firms need to scale up or down quickly after a demand or technological shock
(Haltiwanger, Scarpetta and Schweizer 2014; Bartelsman, Gautier and de Wind 2011). Although we
consider these structural determinants in our empirical analysis, all indicators capturing
developments in these variables have generally improved or remained stable over the timespan
considered, suggesting that other factors may be at play in explaining developments in input
misallocation, especially referred to capital. Moreover, these market distortions may not be
necessary to explain the observed within-sector dispersion in the marginal productivity in inputs, as
argued by Asker, Collard-Wexler and De Loecker (2014), who prove that, in the case of capital at
least, adjustment costs and demand shocks are sufficient to induce this dispersion.
 We therefore consider two demand-related indicators, namely realized demand and demand
uncertainty which attempt to take Asker, Collard-Wexler and De Loecker’s (2014) critique into
account. Moreover, slackness in demand could result in an improved reallocation of resources
because job destruction increases to a larger extent than the reduction in job creation. Most
importantly, the probability of exiting or downsizing is larger for less productive firms (Davis and
Haltiwanger 1990; Caballero and Hammour 1994; Mortensen and Pissarides 1994). Conversely,
higher demand during expansions may allow inefficient firms to thrive. Uncertainty has also been
put forward as a potential determinant of capital misallocation (Bloom et al. 2014; Riley, Rosazza-
Bondibene and Young 2015), suggesting that it is the more productive firms that defer investment
rather than the less productive units. The effect of uncertainty on employment is more ambiguous.
In times of high uncertainty, hiring is risky because it is costly, yet firms may also become more
reluctant to fire workers, as it would be costly to search for new workers in the case of a rise in
future demand (Schaal 2015; Guglielminetti 2016). To our knowledge, the impact of uncertainty on
within-sector labour misallocation has never been explored thus far.
 The recent literature further underscores the role of credit market distortions. Indeed, the
existence of frictions in the financial markets might prevent productive firms from obtaining the
resources needed to expand, so that input choices differ systematically across firms in ways that are
unrelated to their productivity (Gilchrist, Sim and Zakrajsek 2015). Caballero, Hoshi and Kashyap
(2008) show that in the Nineties large Japanese banks often engaged in lending to otherwise
insolvent borrowers, determining lower productivity in the industries affected. Using Korean,
Colombian and Chinese data, Midrigan and Xu (2014) however find that it is difficult to attribute
the bulk of the large TFP losses from within-sector input misallocation to financial frictions, which
instead are found to have sizable negative effects on the number of producers that operate as well as
on the level of technology that producers adopt. Moving to European countries, Gopinath et al.
(2015) show that after the drop in interest rates due to the adoption of the euro, in Spain and in Italy
firms with high net worth, which not necessarily were the most productive enterprises, gained
access to capital markets and were able to expand investment, leading to rising capital
misallocation. Finally, Schivardi, Sette and Tabellini (2016) have shown that the increase in input
misallocation in Italy during the crisis years is positively correlated with the combined presence of a
large number of both weak firms and weak banks, with the latter tending to lend to the former. In
order to test the role of financial constraints in our set of countries, we thus also consider the cost of
credit in our empirical analysis which, to the extent that it also captures firms’ demand conditions,
is also a way to control for another demand variable in the direction of Asker, Collard-Wexler and
De Loecker’s (2014) paper.
 Our results are the following. The reduction in the stringency in both product and labour
market regulations over the period under analysis contributed to dampen input misallocation
growth. Conversely, demand variables played a large role in explaining the observed rise in capital
misallocation. The increase in demand uncertainty was particularly important in explaining this type

 8
of misallocation, especially during the recent recessionary years. Increases in the cost of credit or, in
alternative, the tightening of non-cost credit standards, also affected capital misallocation dynamics
positively. Once controlling for all these factors, a crisis dummy enters our capital and labour
misallocation growth regressions negatively, suggesting a cleansing effect of the Great Recession.
 The structure of the paper is as follows. Section 2 describes the intuition underlying the
Hsieh and Klenow (2009) model, which is used to derive our preferred measure of resource
misallocation, also in comparison with alternative measures, the Olley-Pakes gap and the Petrin and
Sivadasan (2013) indicator. Section 3 presents descriptive evidence on the evolution of labour and
capital misallocation over time and across sectors in Belgium, France, Germany, Italy and Spain.
Within a standard panel regression framework, Section 4 explores the empirical relationships
between key cyclical and structural variables and the observed changes in input misallocation.
Section 5 concludes.

 2. The measurement of input misallocation

 This paper adopts the theoretical approach developed by Hsieh and Klenow (2009), which
shows that changes in sectorial TFP are proportional to changes in the within-sector dispersion of
the marginal revenue product of capital and labour (MRPK and MRPL, respectively). The authors
build a model of monopolistic competition with firm heterogeneity à la Melitz (2003), where firms
face the same marginal cost of inputs but differ in terms of their physical TFP. In their setting, firms
also face different potential input constraints. These constraints lead firms to produce different
amounts than what would be optimal according to their different capital-labour ratios.
 Intuitively, in the absence of constraints and in a static context, the returns to capital and
labour should be similar across firms operating within the same sector, given that the marginal cost
of labour and capital they face is the same. In other words, the allocation of resources across firms
would depend only on the physical level of firm-specific TFP: in an efficient setting, differences in
physical TFP across firms are fully compensated by firm price differentials leading to an
equalization of MRPK and MRPL across firms. The allocative equilibrium is static in the sense that
any shock that creates wedges in the marginal revenue product of an input across firms triggers a
reallocation of the production factor from less to most productive firms until the remuneration of
the input is again equalised across all firms. If dispersion in the marginal productivity of inputs is
observed instead, this could be attributed, at least partially, to constraints impeding the efficient
flow of resources across units of production. The extent of input misallocation is worse the greater
the within-sector dispersion of marginal products of inputs across firms.
 Hsieh and Klenow’s (2009) model is outlined in Annex B. The key equations of interest,
derived therein, are the following:

 (1) = (1 − ) −1 = 1
 1−

where is the marginal revenue productivity of labour of firm i in sector s, is the share of
capital in a Cobb-Douglas production process, > 1 is the constant elasticity of substitution across
varieties of goods, is the nominal value added of firm i, is the labour employed by firm i,
 is the wage faced by all firms in sector s, and , denotes distortions that affect output in firm i.
If the economy is frictionless and therefore = 0, is equal to the sector-specific
marginal cost of labour and labour is efficiently allocated. This equalization holds independently of
the way firms set their prices , i.e. independently of the market structure. Similarly:

 (2) = −1 = 1+
 1−

 9
where is the cost of capital in sector s and refers to the distortions affecting the level of
capital in firm i. If capital and output distortions are absent, is equal to the sector-specific
cost of capital and capital is efficiently allocated.
 By combining equations 1 and 2, we can express revenue total factor productivity as
follows:

 1− (1+ )
 (3) ∝ ∝ 1−
 Finally, under certain normality assumptions, Hsieh and Klenow (2009) show that sectorial
(log)TFP is negatively related to the variance in (log) . In other terms, sectorial TFP is lower
the higher the dispersion in TFPR across firms, which is in turn a function of the dispersion in
MRPK and in MRPL (and their covariance), and ultimately a result of capital and/or labour
distortions. 7
 One must be aware that distortions might not be the only explanation behind the observed
dispersion in TFPR. Indeed, Hsieh and Klenow’s (2009) model is based on restrictive assumptions
on preferences and on the production technology. TFPR dispersion could be the result of firms
setting firm-specific, as opposed to fixed, mark-ups (see, for example, Peters 2013). Additionally,
the Cobb-Douglas assumption might be too demanding. In this respect, Bartelsman, Haltiwanger
and Scarpetta (2013) show that the within-sector dispersion in labour productivity is larger than the
within-sector dispersion in TFP. This finding is difficult to reconcile with a Cobb-Douglas
production function and the assumption that profit-maximizing firms equate their MRPL to wages
since these two conditions would imply that there is no dispersion in labour productivity.
Furthermore, Asker, Collard-Wexler and De Loecker (2014) show that in a dynamic setting with
capital adjustment costs the within-sector dispersion in MRPK can be largely explained by changes
in the volatility of productivity across sectors, suggesting the role of distortions may be negligible.
In other terms, resource allocation may seem inefficient in a static sense (i.e. since the dispersion in
MRPK is different from zero) even in an undistorted economy, but actually be efficient in a
dynamic sense. 8
 In order to verify the soundness of the information on input misallocation stemming from
Hsieh and Klenow’s (2009) model, we also consider alternative measures of input misallocation,
namely, the Olley and Pakes (1996) gap and the Petrin and Sivadasan (2013) wedge between the
marginal revenue productivity and marginal cost of an input, which takes into account the
possibility that marginal costs are not equal across firms in a given sector. 9

7
 In following Hsieh and Klenow (2009) and using CompNet data, we only consider the reallocation of two production
factors, labour and capital, disregarding intermediate inputs. As Basu and Fernald (1997) and Jones (2013) argue, using
a value added production function will misclassify growth coming from the reallocation of intermediate inputs as
within-firm productivity growth, thereby understating the role of reallocation in explaining aggregate TFP growth.
Moreover, adjustment costs may be lower for intermediate inputs relative to capital and labour, thereby implying that
the dispersion in the marginal revenue product of these inputs is less subject to the critique put forward by Asker,
Collard-Wexler and de Loecker (2014) which we will discuss further on. CompNet data referring to the marginal
productivity of raw materials are in fact not available. This is because, as explained in Annex C, the firm-level marginal
productivity of an input is calculated as the average industry coefficient of the input multiplied by the average
productivity of the input at the firm level. The input coefficients are retrieved from the estimation of a Cobb-Douglas
production function where the value added, defined as turnover minus raw materials, is the dependent variable. Hence
the input coefficients of raw materials are not explicitly estimated.
8
 Hopenhayn (2014) also discusses the issue of adjustment costs, building upon Asker, Collard-Wexler and De Loecker
(2014).
9
 There are other proxies for resource misallocation that we do not consider in this paper. For example, Bartelsman,
Lopez-Garcia and Presidente (2016), following Foster, Grim and Haltiwanger (2014), estimate the productivity-
enhancing reallocation of inputs across firms looking at the elasticity of input growth to initial productivity relative to
that of the other firms in the sector. Results referring to resource misallocation in that paper are anyhow consistent with
the stylised facts we report herein.

 10
Regarding the Olley and Pakes’ (1996) indicator, the intuition is the following (the algebraic
formula is shown in Annex B): the (log) labour productivity of an industry is equal to the weighted
average of the labour productivity of firms active in the industry, where the weights are the firm’s
share in total industry employment. An industry’s labour productivity can be then decomposed into
two parts: a) the unweighted average of firm-level productivity and b) the within-industry cross-
sectional covariance between the relative productivity of a firm and its relative weight, given by its
size (the so-called OP gap). Given the unweighted industry mean, the higher the covariance the
larger the contribution of the allocation of resources across firms to the industry productivity level,
relative to a situation in which resources had been allocated randomly across firms (in that instance,
the covariance would be zero).
 Being grounded on a statistical decomposition, the OP gap has the advantage of being
simple to compute and, according to Bartelsman, Haltiwanger and Scarpetta (2013), quite robust to
mismeasurement. Additionally, it is easy to interpret, given that it provides the gain (in log points)
in sectorial labour productivity stemming from the actual allocation of resources, relative to that
obtained if resources were allocated randomly. On the other hand, the indicator also presents some
disadvantages. Without the standard assumptions on the production function and/or demand
curvature, the OP gap would be maximum if all resources were concentrated within the most
efficient firm. But given that there are preferences for product variety, this would not be welfare-
optimising. Secondly, the decomposition is cross-sectional and does not accommodate entry and
exit, in the sense that it does not decompose aggregate productivity changes into components that
are driven by entry and exit. However, regarding the latter Melitz and Polanec (2015) have recently
proposed a dynamic OP gap able to account for the contribution of net entry to industry productivity
growth. Lastly, Bartelsman, Haltiwanger and Scarpetta (2013) show that in the presence of
overhead costs, 10 the covariance between productivity and size is not zero, thereby suggesting that
cross-country differences in the OP gap could be reflecting cross-country differences in overhead
costs rather than differences in allocative efficiency.
 Regarding the other measure of input misallocation here considered, Petrin and Sivadasan
(2013) start from a microeconomic optimisation problem at the firm level and show that the wedge
between the value of the marginal product and that of the marginal cost of the input at the firm level
equals the increase in aggregate output resulting from the use of one extra unit of input by the firm.
Hence, in absolute terms, the average wedge across firms equals the average productivity gain from
adjusting the input by one unit in the optimal direction, that is, from a low-wedge firm to a high-
wedge firm. The larger the average wedge the greater the input misallocation, because of the larger
potential gains from reshuffling resources. As explained in more detail in Annex D, given our data
limitations we cannot exactly reproduce Petrin and Sivadasan’s (2013) indicator of allocative
inefficiency although we are able to sufficiently approximate it, at least for the capital input. 11 In
order to compute the average absolute capital wedge, we assume that each sector has five
representative firms, one for each size class, and then take the average of the absolute value of those
five wedges in each of the sectors considered. We proxy the average marginal cost of capital with
the average implicit interest rate paid by the firm on its stock of debt (total interest payments
divided by the stock of debt).

10
 Overhead costs are expenses that are necessary for the continued functioning of the business but cannot be
immediately associated with the products or services being offered, that is, they do not directly generate profits,
differently to labour, materials or capital expenses. They include, among others, accounting fees, advertising, insurance,
interest, legal fees, labour burden, rent, repairs, supplies, taxes, telephone bills, travel expenditures and utilities. They
are generally fixed costs, so they are incurred even in the absence of sales, but are positively correlated with size.
11
 The available labour data do not allow us to construct reliable estimates of this indicator.

 11
3. Developments in labour and capital misallocation in selected euro-area countries
 3.1 The data

 This section looks at trends in input misallocation in large euro-area countries (Belgium,
France, Germany, Italy and Spain) for which we have comparable data, taken from the
Competitiveness Research Network of the Eurosystem (CompNet) database and described in Annex
C, on a representative sample of firms with more than 20 employees. Our analysis covers eight
sectors at the one-digit industry level (according to NACE rev. 2): manufacturing, construction and
six service sectors (wholesale and retail trade; information and communication; transportation and
storage; food and accommodation services; professional, scientific and technical services;
administrative and support services). The period under study is 2002-2012, hence we are able to
analyse whether there are any significant changes in misallocation also during the Great Recession
years. Some sectors or years, however, are missing for some countries. 12
 Using CompNet data in Figure 2 we are able to broadly replicate the main trends in national
account TFP growth, reported in Figure 1. The chart shows the average annual growth rate of
median TFP considering all firms with at least one employee operating in the business economy. 13
With the exception of the very low, but positive, TFP growth recorded in Spain during the pre-crisis
and the somehow larger TFP growth of Belgium, both the country rankings and orders of
magnitude are quite similar despite the different nature of the data underlying national account
statistics and the CompNet dataset. As more thoroughly explained in Annex C, CompNet data do
not cover the agriculture, mining, finance, insurance and public sectors; moreover, self-employed
workers are excluded to ensure maximum comparability across country samples.

 Figure 2.TFP growth rates based on CompNet data
 (annual average growth rates)

Source: Authors’ calculations based on CompNet data full sample data.
Notes: Weighted averages, where the weights are the country-specific sectorial value added shares. Data for France
cover 2004-2012, data for Belgium cover 2003-2010, data for Germany cover 2003-2012.

 3.2 Developments in input misallocation

 In order to examine the average total-economy evolution of resource misallocation since
2002 in the countries under analysis, we weighted sector-level input productivity dispersions with
their corresponding country-specific time-varying sectorial shares in total value added. According

12
 In particular, data for 2012 are missing for Belgium. Concerning sectors, food and accommodation services are
missing for both Germany and Belgium and administrative and support services are missing for Germany.
13
 We only report the countries with good coverage of firms with less than 20 employees. Note that in the paper we use
the sample of firms with at least 20 employees which are population-weighted in all countries and therefore
representative of the underlying population of firms in terms of sector and size distribution.

 12
to this aggregated indicator of misallocation, dispersion in MRPK has been on an upward trend
since 2002 in all countries, with the exception of Germany, where the trend reversed in 2006
(Figure 3, left-hand side panel). The trend reversal in the latter country was entirely driven by a
decline in capital misallocation in industry, which weighs significantly in this country, whereas
allocative inefficiency remained stable or continued to increase after 2006 in all service sectors.
Dispersion in MRPL, on the other hand, grew significantly less over time in all countries, albeit
starting from higher initial levels than MRPK dispersion (Figure 3, right-hand side panel). These
findings are consistent with those found in the recent empirical literature discussed in the
Introduction, such as Gopinath et al. (2015) Garcia-Santana et al. (2016) and Calligaris (2015).
 Moreover, it is noteworthy that growth in both MRPK and MRPL dispersion turned abruptly
negative in 2008 or 2009 across all countries. In other terms, the pace of productivity-enhancing
resource reallocation picked up during the Great Recession relative to ‘normal’ times, albeit
temporarily, as seen by subsequent growth rates which generally turned positive once again. At the
onset of the sovereign debt crisis (2011-2012), especially labour misallocation fell again in some
countries.
 In Annex D we provide the correlations between the depicted changes in capital and labour
misallocation in each country: although positively related, correlation is weak (below 0.6),
suggesting that the determinants underlying growth in the two kinds of input misallocation are
potentially different. Interestingly, after 2008 the correlation between changes in MRPL and MRPK
dispersions increased slightly, suggesting a similar effect of the crisis years on both production
factors. Moreover, in Annex E, we show that the hypothetical losses in TFP resulting from the
reported developments in capital misallocation are much larger than those stemming from labour
misallocation, although the reported estimates are subject to large measurement uncertainty.

 Figure 3. Total-economy average dispersion in MRPK and MRPL by country
 (weighted averages)

 Dispersion in MRPK Dispersion in MRPL

Source: Authors’ calculations based on CompNet data.
Notes: Weighted averages, where the weights are the country-specific time-varying sectorial value added shares. The
value added series for Belgium ends in 2010.

 An increase in the total-economy dispersion in MRPK, as depicted in Figure 3 for most
countries under analysis, may be explained by a rise in the within-sector dispersion in MRPK
within each sector, i.e. a “pure” misallocation effect, and/or by an increase in the weight of sectors
where dispersion in MRPK is higher relative to that in shrinking sectors. To explore this issue we
use 2002-2012 average country-specific sectorial value-added weights to neutralize the effect of the
changing structural composition of the economy in order to appraise the “pure” within-sector
misallocation effect in two sub-periods (2002-2007 and 2008-2012; Table 2). Focusing on capital
misallocation (panel A), it is mainly the variation in within-sector dispersion in MRPK that drives
the variation in total-economy misallocation. The structural change of the economy, according to

 13
the period and country, has generally amplified capital misallocation compared to a constant
economic structure scenario, albeit to a small extent. Also, in the case of labour misallocation there
is a predominant role of ‘pure’ within-sector changes in misallocation in explaining aggregate
misallocation trends (panel B). However, if the five countries had kept their economic structure
constant over time, the pre-crisis increase in MRPL dispersion recorded in all countries would have
been more contained.

 Table 2. A decomposition of developments in total-economy capital and labour misallocation
 (percentage changes)
A. Capital misallocation
 1 2 3
 Sectorial
 Actual MRPK Fixed-weights composition
 dispersion MRPK dispersion effect
 Belgium
 2002-2007 15.45% 12.87% 2.58%
 2008-2010 7.52% 7.70% -0.18%
 France
 2002-2007 23.11% 22.93% 0.19%
 2008-2012 1.71% 1.45% 0.26%
 Germany
 2002-2007 21.46% 22.17% -0.71%
 2008-2012 -4.97% -5.22% 0.25%
 Italy
 2002-2007 29.97% 29.84% 0.13%
 2008-2012 3.47% 4.55% -1.08%
 Spain
 2002-2007 6.58% 6.55% 0.03%
 2008-2012 4.03% 2.87% 1.16%
B. Labour misallocation
 1 2 3
 Sectorial
 Actual MRPL Fixed-weights composition
 dispersion MRPL dispersion effect
 Belgium
 2002-2007 14.65% 10.58% 4.07%
 2008-2010 1.41% 1.00% 0.41%
 France
 2002-2007 14.53% 12.85% 1.69%
 2008-2012 -2.01% -2.09% 0.07%
 Germany
 2002-2007 17.30% 16.06% 1.24%
 2008-2012 -5.71% -5.71% 0.00%
 Italy
 2002-2007 7.99% 5.63% 2.36%
 2008-2012 -4.10% -4.45% 0.36%
 Spain
 2002-2007 -0.48% -1.16% 0.68%
 2008-2012 -1.51% -0.83% -0.68%
Source: Authors’ calculations on CompNet data.
Notes: Whereas column 1 depicts the cumulative (2002-2007 and 2008-2012) changes in MRPK(L) dispersion given
the actual structure of the economy, column 2 shows the cumulative changes in MRPK(L) dispersion when country-
specific weights are fixed at the 2002-2012 average. Column 3 is computed as the difference between column 1 and
column 2.

 14
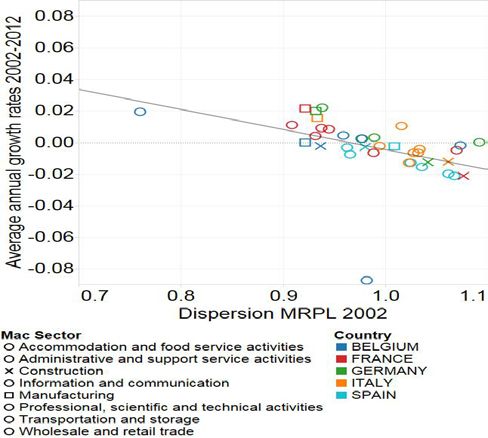
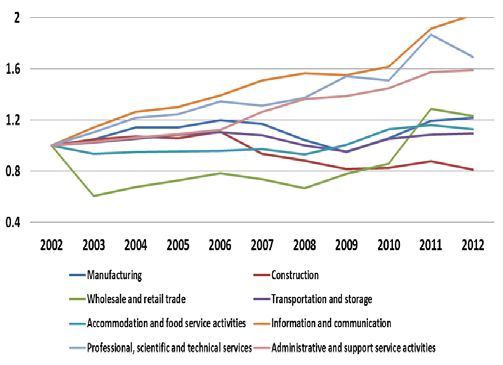
In order to analyse sectorial developments we next compute the (unweighted) averages of
sectorial dispersions in MRPL and in MRPK across the five countries (Figure 4). In services the
dispersion in MRPK has been more markedly upward-trending since the early 2000s than in
industry, thereby suggesting that analyses focused solely on manufacturing, such as Gopinath et al.
(2015), may be misleading. This upward trend is particularly pronounced for the information and
communication sector and for professional and administrative activities. It is a worrying finding for
two reasons. First, if the weight of services continues to grow in the economy, as is likely, then high
capital misallocation in services will also exert a drag on future aggregate TFP growth. Second,
resource misallocation and therefore low productivity growth in upstream service sectors indirectly
dampens productivity growth also in downstream industrial sectors. With respect to dispersion in
MRPL, we instead observe broadly stable developments across the service sectors, whereas labour
misallocation in manufacturing modestly increased over the entire period vis-à-vis a decline in
construction. The temporary drop in MRPL dispersions in 2009 was however common to most
sectors. In Annex D we show the (again quite low) correlations between changes in labour and
capital misallocation by sector, as well as reporting input misallocation dynamics across 2-digit
industries within the heterogeneous manufacturing sector. 14

 Figure 4. Input misallocation by sector
 (unweighted averages across countries)
 Dispersion in MRPK Dispersion in MRPL

Source: Authors’ calculations based on CompNet data.

 Gamberoni et al. (2016) have found that for a sample of Central and Eastern European
countries there is evidence of convergence in both capital and labour misallocation or of their
inverse, allocative efficiency. We too find descriptive evidence of a negative correlation between
the initial level of dispersion in 2002 and subsequent growth rates at the country-sector level
(Figure 5), in particular for capital misallocation. However, amongst others, Quah (1993) has
emphasised that this type of convergence, generally known as β–convergence, can be the result of a
more general statistical, not economic, phenomenon of regression to the mean, so that one should
actually focus on the so-called σ–convergence, i.e. the reduction in the dispersion of the cross-
sectional distribution of country performance. β–convergence is a necessary, but not sufficient
condition for σ–convergence. Figure 6 shows that the average cross-country dispersion across
sectors in capital misallocation, a component of TFP growth, has indeed gone down until 2007,
suggesting that the observed β–convergence in capital misallocation has resulted in σ-convergence,
at least until the outbreak of the global financial crisis. The dispersion in labour allocative
misallocation, on the contrary, seems to have risen in all sectors, which is consistent with the

14
 These data are not strictly comparable to the one-digit measures employed in this paper: the former are raw, the latter
are de-trended (see Annex C for details).

 15
weaker correlation found in Figure 5. We will further investigate these convergence hypotheses in
our empirical analysis.

 Figure 5. Yearly growth in input misallocation versus initial level of misallocation

 Capital misallocation Labour misallocation

Source: Authors’ calculations on CompNet data.

 Figure 6. Average cross-country and cross-sector standard deviation in input misallocation

Source: Authors’ calculations on CompNet data.

 Our descriptive analysis conducted thus far should not be biased by the fact that we are only
considering firms with more than 20 employees. Indeed in Annex D we show that the developments
described are robust to the inclusion of smaller firms, for those countries for which the full sample
of firms with employees is representative of the population (Belgium, Italy and Spain). Another
robustness check we conducted refers to the underlying data employed in this paper. Using the same
CompNet methodology described in Annex C, we computed the dispersion in MRPK and in MRPL
on alternative data sourced from Amadeus. Given the burdensome data collection process involved,
we focused solely on one case-study (the full sample of firms in manufacturing in Spain) and we

 16
confirm that developments in both MRPK and MRPL dispersion are similar to those reported in this
paper (Annex D). 15 Lastly, we checked the robustness of our results to the fact that firms in the
same sector do not necessarily face the same marginal costs, as assumed in Hsieh and Klenow’s
(2009) model. To that end, we computed the Petrin and Sivadasan (2013) average wedges by sector
and country and plotted their evolution over time (Annex D), obtaining similar trends to those
uncovered in this section.
 Table 3 compares the evolution of all the different measures of input misallocation
discussed in Section 2 in order to confirm the soundness of the highlighted stylised facts across
alternative measures. To be able to compare the dynamics of all indicators, we compute their
relative cumulative growth since 2001, setting the value equal to 1 in 2001 and taking the average
of the value of the index in the pre-crisis and the crisis period. Note that whereas an increase in the
dispersions and in the capital wedge reported in the first three columns signals a rise in input
misallocation, an increase in the OP gap provided in the fourth column suggests a fall in labour
misallocation. The dispersion in MRPL and the OP gap convey consistent information over time,
except for a small discrepancy in the case of Spain and Italy. In the former country, the modest
decline in labour misallocation during the Great Recession is documented only by the slight fall in
the MRPL dispersion measure and not by the alternative OP gap indicator. In the latter country,
growth rates in MRPL dispersions remained substantially invariant while the OP gap indicator
signals an improvement in labour misallocation. Lastly, the change in the average wedge between
marginal productivity and marginal cost of capital varies in a similar way to the dispersion in
MRPK. On the whole, our analysis based on the dispersion in marginal revenue products of inputs
across countries appears therefore to be robust also to alternative measures of factor misallocation.

 Table 3. Evolution of different measures of input misallocation
 (average indices in two sub-periods; 2001=1 but for Italy where 2002=1)

Source: Authors’ calculations on CompNet data.
Notes: A rise in the OP gap signals a decrease in misallocation. There are no data on capital costs, necessary to compute
the capital wedge, for Spain before 2008.

15
 A further confirmation of the robustness of CompNet data is given by the fact that our stylized facts on input
misallocation are in line with those tracked in the other papers we previously discussed, based on Amadeus or other
firm-level data.

 17
4. The determinants of input misallocation: panel regression analysis

 4.1 The empirical model

 In this section we investigate the potential determinants of changes in the dispersion in
MRPK and MRPL, respectively, at the country-sector level in a standard panel regression
framework. The difference in the variation of the two types of input misallocation, highlighted in
Section 3, could possibly suggest that capital-specific factors rather than common shocks were
mainly at work in the period under study. Similarly to Gamberoni et al. (2016), we adopt a
conditional convergence model, based on Barro and Sala-i-Martin (2004), which takes the
following form:

 (4)∆ ( ) , , = , , + ( ) 0, , + , ,

 where I denotes either capital (K) or labour (L), Δ indicates annual average growth rates 16,
indicates the country, indicates the sector, the time dimension and , , are shocks reflecting
changes in production conditions or consumers’ preferences. Owing to the conditionality of the
model, input misallocation also depends on variables that affect the steady state. In equilibrium
conditions, the dispersion in the marginal revenue in levels would equal zero. However, owing to
the presence of distortions, in equilibrium changes in input misallocation are affected by country
and sector-specific variables that determine , , in equation 4.
 In our full empirical specification, as well as initial conditions in misallocation, we consider
various types of shocks to the business environment. As suggested by the literature, we first
examine the role of two structural factors, i.e. changes in both product and labour market
regulations. In the presence of high barriers to entry, unproductive firms are able to survive and
therefore retain productive resources which are not shifted to the most efficient firms in a given
industry (Schiantarelli 2008; Restuccia and Rogerson 2013; Andrews and Cingano 2014).
Furthermore, more stringent employment regulation might prevent firms from adjusting their
workforce to optimal levels, therefore hampering the efficient reallocation of workers across firms
(Haltiwanger, Scarpetta and Schweizer 2014; Bartelsman, Gautier and de Wind 2011). Moreover, in
the labour misallocation regressions we also include an interaction term between the changes in
product and labour market regulations. The employment effect of interactions between the two sets
of policies is still an open issue. 17 Using a general equilibrium model, Blanchard and Giavazzi
(2003) find that combining product and labour market deregulation allows workers to counteract the
decline in total – and also their – rents with the gains as consumers and that introducing product
market deregulations is a means to pave the way for subsequent labour market deregulation, since
total rents decline and workers may appropriate lower shares of rents as a result. More recently,
Fiori et al. (2012) show that employment gains from product market deregulation are largest in
situations where labour market settings provide strong bargaining power to workers, so that product
and labour market policies are considered as ‘economic substitutes’. The effects of product market
liberalization on employment become even stronger over time since, by increasing competition and
creating downward pressures on total rents, it also reduces incentives for workers to defend high
levels of bargaining power through stricter labour market settings. In this respect product and labour
market regulations are considered as ‘political complements’ as product market reforms lead to

16
 We drop the 2003/2002 annual average rate owing to the inclusion of the 2002 level of capital misallocation as a
regressor, which could therefore lead to a potential endogeneity bias.
17
 To our knowledge, none of this literature has focused on the effects on investment nor, therefore, on capital
misallocation.

 18
labour market deregulation. 18 To our knowledge, no study has however analysed the interaction of
product and labour market policies on labour misallocation.
 Next, we also consider business-cycle conditions: changes in realized demand and demand
uncertainty, as well as a crisis dummy variable that equals one from 2008 onwards. The inclusion of
these variables is also a way of controlling for Asker, Collard-Wexler and De Loecker’s (2014)
critique that the dispersion in MRPK, at least in a given point of time, is the result of demand
shocks to firms that cannot adjust instantaneously. Regarding demand conditions, we include
changes in sectorial real turnover to capture booms and busts at the sectorial level. Slackness in
demand could result in an improved reallocation of resources because job destruction increases to a
larger extent than the reduction in job creation, given that the costs of job creation are lower owing
to a high supply of unemployed labour. Moreover, the probability of exiting or downsizing is larger
for less productive firms, as they become not profitable enough (Davis and Haltiwanger 1990;
Caballero and Hammour 1994; Mortensen and Pissarides 1994). Conversely, higher demand during
expansions may allow inefficient firms to thrive. Heightened uncertainty can also affect allocation
of capital as most productive firms might be more risk-adverse than less productive ones (as
potential losses are larger) and therefore decide to postpone their investments to a larger extent. For
example, Bloom et al. (2014) show that input misallocation increases in the economy in response to
an uncertainty shock. In the absence of uncertainty, unproductive firms contract and productive
firms expand. But when uncertainty is high, firms reduce expansion and contraction, adopting a
wait-and-see strategy to gather more information on the external environment (the so-called ‘real
option channel’) and therefore shut off much of this productivity-enhancing reallocation. Riley,
Rosazza-Bondibene and Young (2015) report low risk appetite and high uncertainty as being
significant factors explaining the lack of external restructuring among the largest (and possibly the
most productive) firms during the Great Recession in the U.K.. Moreover, using U.S. data, both
Schaal (2015) and Guglielminetti (2016) show that uncertainty can significantly dampen
employment, although to our knowledge there is yet no study that specifically explores the link
between uncertainty and within-sector labour misallocation.
 Finally, we also include the cost of bank credit in our regressions, another possible way of
controlling for firms’ demand conditions in the direction of Asker, Collard-Wexler and De Loecker
(2014). The key role of financial systems is to acquire information about investment opportunities
and facilitate the allocation of resources into viable entrepreneurial projects (Levine 2005).
Therefore, difficult access to external finance for certain types of firms (young or small firms, for
example) or loose credit standards due to weak screening of borrowers can lead to input
misallocation as high productivity but financially vulnerable enterprises may be forced to exit the
market (Gilchrist, Sim and Zakrajsek 2015). Caballero, Hoshi and Kashyap (2008) show that in the
Nineties large Japanese banks often engaged in lending to otherwise insolvent borrowers (i.e.
“zombie lending”), determining more depressed job creation and destruction, and lower
productivity in the industries affected. Using Korean, Colombian and Chinese data, Midrigan and
Xu (2014) however find that it is difficult to attribute the bulk of the large TFP losses from within-
sector input misallocation to financial frictions, owing to the fact that the most efficient firms
accumulate internal funds over time and grow out of their financing constraints; financial frictions
instead are found to have sizable negative effects on the number of producers that operate as well as
on the level of technology that producers adopt. Moving to European countries, Gopinath et al.
(2015) build a model in which, due to differences in net worth, firms may or may not have access to
bank credit. After the drop in interest rates due to the adoption of the euro, in Spain and in Italy
firms with high net worth, which not necessarily were the most productive enterprises, gained
access to capital markets and were able to expand investment, leading to rising capital
misallocation. Finally, Schivardi, Sette and Tabellini (2016) have shown that the increase in input
misallocation in Italy during the crisis years is positively correlated with the combined presence of a
18
 On the evolution of the relationship between workers’ bargaining power and of firms’ mark-ups by sector in Italy, for
example, see Giordano and Zollino (2016).

 19
You can also read


