RANDFONTEIN LOCAL MUNICIPALITY IDP 2016 -2021
←
→
Page content transcription
If your browser does not render page correctly, please read the page content below
RANDFONTEIN LOCAL MUNICIPALITY
IDP 2016 -2021

1
Table of Contents
SECTION A .................................................................................................................................................. 4
         VISION ................................................................................................................................................ 4
         MISSION STATEMENT ........................................................................................................................ 4
         MUNICIPAL CORE VALUES ................................................................................................................. 4
         In his state of the Province Address on the 27 June 2014 Gauteng Premier Mr. David Makhura announced a
         ten – pillars programme of radical transformation; modernization and re-industrialization. This new approach
         is aimed at building Gauteng into an integrated, inclusive, innovative and sustainable city-region that
         continues to be the leading economy in Africa and characterized by smart and green industrial and socio-
         economic development. The strategy to accelerate growth, eliminate poverty and reduce inequality by 2030
         will be realized through the National Development Plan (NDP) which lays the basis for economic
         transformation and modernization, to address development challenges and improve the lives of Gauteng
         citizens................................................................................................................................................. 6
         Provincial Priorities ............................................................................................................................ 6
         BACK TO BASICS ................................................................................................................................. 7
         West Rand District Priorities .............................................................................................................. 7
         Randfontein Local Municipality Strategic Objectives ................................................................................. 7
SECTION B ................................................................................................................................................ 13
THE MUNICIPALITY: DEMOGRAPHIC PROFILE .......................................................................................... 13
         LOCAL PROFILE ................................................................................................................................ 13
         The demographic profiles..................................................................................................................... 14
    Randfontein and Westonaria Socio-Economic Profile ......................................................................... 14
SECTION C ................................................................................................................................................ 23
POWERS AND FUNCTIONS OF THE MUNICIPALITY .................................................................................. 25
         WHO IS THE EXECUTIVE? ................................................................................................................. 25
         MUNICIPAL PUBLIC ACCOUNTS COMMITTEE (MPAC) ..................................................................... 27
    Process followed to develop the IDP ................................................................................................... 28
    TIMEFRAMES FOR IDP PROCESS PLAN................................................................................................. 29
DEPARTMENTAL SECTOR MEETINGS FOR 2016....................................................................................... 33
         PUBLIC PARTICIPATION AND GOOD GOVERNANCE ......................................................................... 33
SECTION E ................................................................................................................................................ 36
    SPATIAL ECONOMY AND DEVELOPMENT RATIONALE ......................................................................... 36
    6.      BUSINESS STRUCTURE.................................................................................................................. 41
    7.      CBD AREA ..................................................................................................................................... 42
    INDUSTRIAL DEVELOPMENT ................................................................................................................ 42
    RESIDENTIAL DEVELOPMENT ............................................................................................................... 43

2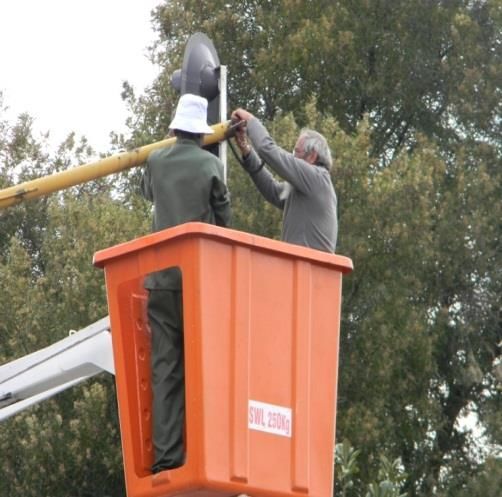
THE FOLLOWING TOWNSHIPS ARE IN A PROCESS OF ESTABLISHMENTS:- ..................................... 43
       Total Number of household .................................................................................................................. 44
    AGRICULTURAL HOLDINGS .................................................................................................................. 44
    Status Quo Assessment .......................................................................................................................... 47
    SWOT.................................................................................................................................................... 47
       Assessment of services per Ward ......................................................................................................... 49
       West Rand District Municipality ............................................................................................................ 58
       Provincial Government ........................................................................................................................ 58
SECTION G ................................................................................................................................................ 68
       ELECTRICITY & ENERGY: ................................................................................................................. 69
       Randfontein Local Municipality has submitted three business plans to the Department of Energy for the
       following Projects: ............................................................................................................................... 69
       General challenges that are not highlighted above. ................................................................................ 70
       ROADS: ............................................................................................................................................. 71
       SOCIAL TRANSFORMATION .............................................................................................................. 72
SECTION H ................................................................................................................................................ 77
SECTION I ................................................................................................................................................. 79
SECTION J ................................................................................................................................................. 83
       Alignment ......................................................................................................................................... 83
SECTION K ................................................................................................................................................ 83
SECTION K:             CAPEX PROJECTS ............................................................................................................. 84
INFRASTRUCTURE CAPEX MAINTENANCE PROJECTS: ............................................................................. 85
PROGRESS ON PROJECTS ......................................................................................................................... 86

3
SECTION A
VISION
“THE GOLDEN GREEN GATEWAY TOWN TOWARDS THE UNICITY”

MISSION STATEMENT
“THROUGH MOBILISING COMMUNITIES TOWARDS QUALITY SHARED SERVICES DELIVERY, THEREBY
FACILITATING A SUSTAINABLE AND PROSPEROUS SOCIETY BASED ON AGRICULTURE, INFRASTRUCTURE
INVESTMENT, MANUFACTURING AND MINERALS BENEFICIATION”

MUNICIPAL CORE VALUES

    No.                VALUE                                 DESCRIPTION
          Integrity (trust), honesty and   Always striving to have courtesy, dignity and
    1     respect                          honest in our dealings and observing laid down
                                           protocol

          Quality service and              Provision of first class services which reflect value
    2     performance excellence           for money

          Participation and                Consult with community and other stakeholders on
    3     empowerment                      decision-making

    4     Commitment and teamwork          Committed to pledge (deliver on what is promised)

          Accountability and               Openness in dealing with the community and
    5     transparency                     giving necessary information

          Continuing Learning and          Developing an organisational and employee
    6     development                      culture of learning and through that striving for
                                           development

          Batho Pele                       Observing the eight principles embodied in Batho
    7                                      Pele in service delivery

NATIONAL KEY PERFORMANCE AREAS
Municipal Transformation and Organisational Development
Basic Service Delivery
Local Economic Development
Financial Viability and Financial Management
Good Governance and Public Participation
Spatial Analysis (Spatial Development and Land Use Management)

4
SERVICE DELIVERY STRATEGIC ISSUES ARE THE FOLLOWING
Water, Electricity, Roads, Sanitation, Waste Management, Housing, Job Creation, Health, Sports, Arts
and Culture, Education, Public Safety, Skills Development, Equity, Revenue Collection, Community
Participation, Compliances.

NATIONAL OUTCOMES
A long and healthy life for all South Africans.
All people in South Africa are and feel safe.
Improved quality of basic education
Decent employment through inclusive economic growth.
Improved quality of basic education.
A skilled and capable workforce to support an inclusive growth path.
An efficient, competitive and responsive economic infrastructure network.
Vibrant, equitable and sustainable rural communities with food security for all.
Sustainable human settlements and improved quality of household life.
A responsive, accountable, effective and efficient local government system.
Environmental assets and natural resources which are well protected and continually enhanced.
Create a better South Africa and contribute to a better and safer Africa and World.
An efficient, effective and development orient public service and an empowered, fair and inclusive
citizenship.

NATIONAL DEVELOPMENT PLAN, 2030 (NDP)
We, the people of South Africa, have journeyed far since the long lines of our first democratic election on
27 April 1994, when we elected a government for us all.
We began to tell a new story then. We have lived and renewed that story along the way.
The National Development Plan aims to eliminate poverty and reduce inequality by 2030. South Africa
can realize these goals by drawing on the energies of its people, growing an indusive economy, building
capabilities, enhancing the capacity of the state, and promoting leadership and partnerships throughout
society.
South Africa has made remarkable progress in the transition from apartheid to democracy. This transition
has been peaceful despite the country’s history of violent conflict and dispossession.
The Commission’s Diagnostic Report, released in June 2011, set out South Africa’s achievements and
shortcomings since 1994. It identified a failure to implement policies and an absence of broad
partnerships as the main reasons for slow progress, and set out nine primary challenges:

    1. Too few people work.
    2. The quality of school education for black people is poor.
    3. Infrastructure is poorly located, inadequate and under-maintained.
    4. Spatial divides hobble inclusive development.
    5. The economy is unsustainably resource intensive.
    6. The public health system cannot meet demand or sustain quality.
    7. Public services are uneven and often of poor equality.
    8. Public services are uneven and often of poor quality.
    9. Corruption levels are high.
    10. South Africa remains a divided society.

5
South Africans from all walks of life welcomed the diagnostic as a frank, constructive assessment. This
led to the development of the draft national plan, release in November 2011. Building on the diagnostic,
the plan added four thematic areas:
rural economy;
social protection;
regional and world affairs; and
Community safety.
Gauteng Ten – Pillars Programme
In his state of the Province Address on the 27 June 2014 Gauteng Premier Mr. David Makhura
announced a ten – pillars programme of radical transformation; modernization and re-industrialization.
This new approach is aimed at building Gauteng into an integrated, inclusive, innovative and sustainable
city-region that continues to be the leading economy in Africa and characterized by smart and green
industrial and socio-economic development. The strategy to accelerate growth, eliminate poverty and
reduce inequality by 2030 will be realized through the National Development Plan (NDP) which lays the
basis for economic transformation and modernization, to address development challenges and improve
the lives of Gauteng citizens
In achieving the transformation, modernization and re-industrialization of Gauteng as a city region, the
following ten pillars are envisioned:
Radical economic transformation;
Decisive spatial transformation;
Accelerated social transformation;
Transformation of the state and governance;
Modernization of the public service;
Modernization of the economy;
Modernization of human settlement and urban development;
Modernization of public transport infrastructure;
Re-industrialization of Gauteng province; and
Taking the lead in in Africa's new industrial revolution.
Provincial Priorities
The Strategic priorities of the Province as derived from the national priorities are as follows:
Creating decent work and building a growing,
inclusive economy
Promoting quality education and skills development
Prioritising better healthcare for all
Stimulating rural development and food security
Intensifying the fight against crime and corruption
Building cohesive and sustainable communities
Strengthening the developmental state and good Governance
6
BACK TO BASICS
In his speech during the IDP/Budget roadshows, the Executive Mayor Councillor Mzi Khumalo stresses
the need for the municipality to go back to basics as it is overemphasised by the Minister of COGTA. This
means to implement all the small things a municipality is required to perform, e g the provision of Water,
Electricity, Roads and housing among others. The Executive Mayor has committed the Municipality to
continue providing quality water to the community of Randfontein and impressed upon the officials to
maintain the quality of water (BLUE DROP). The Executive Mayor has committed 90% of MIG funding
towards the upgrading and reconstruction of roads and storm water. As it takes a village to raise a child,
The Executive Mayor has established an Educational Trust which will ensure that NO CHILD IS LEFT
BEHIND after Grade 12. This is to prove that education is the key to success.
Public participation should be qualitative instead of being quantitative, that all municipal employees
regard themselves as people’s servants. BATHO PELE to be part of operations. He is intent on
eradicating corruption, thereby spending on what is needed by the community and not on something else.
West Rand District Priorities
Social Security (Health and Safety)
Community Services
Transformation Of Administrative And Institutional
Systems And Structures
Financial Viability,
Good Governance And
Institutional Development
Randfontein Local Municipality Strategic Objectives
The strategic objectives are identified to be the following:
Strategic Objective Strategic Outcomes
Build better communities Shared values
Enhance financial sustainability Financial liquidity, Good credit rating,
Accelerate an inclusive growing economy Employment and growth in the GDP, Investment
Plan for the future Liveable, integrated communities
Establish effective and efficient services Pay services,
Enhanced, effective, accountable and Good governance
clean institutional management and
corporate governance
Develop a learning organisation Human capital,
Strategic Objective Description of Strategic Objectives
Build better communities The scourge of HIV/AIDS as well as alcohol and drug abuse has an
impact on both service delivery and prosperity and sustainability of
communities. To this end the focus should be on HIV/AIDS, the
impact that sexually transmitted diseases and tuberculosis are having
on the quality of life of communities.
7
Strategic Objective                       Strategic Outcomes

                                          Health provisioning is now focusing on HAST to be more inclusive of
                                          the aforementioned diseases. Randfontein Municipality needs to
                                          strive to play a significant role to prevent the spread of the HAST and
                                          substance abuse as it has a direct impact on the welfare of its
                                          communities. Hence, focus should be given to activities that should
                                          be aimed at and focussed on reducing the impact, infection and
                                          prevalence rate of these maladies.

                                          It is therefore critical to identify and appraise development
                                          programmes that support sustainable livelihoods and social
                                          environment within which the communities exist and that the
                                          municipality should play an active role in facilitation and roll-out of
                                          such programmes.

                                          Randfontein Municipality should engage in meaningful dialogues with
                                          the youth about how to address underlying social, economic and
                                          environmental factors that perpetuate poverty and how mechanisms
                                          can be developed to address identified issues.

                                          The municipality should further mobilise support and collaborate with
                                          sector departments to address cross-cutting issues within the
                                          municipality.

Enhance financial sustainability          Randfontein Local Municipality seeks to identify potential revenue
                                          sources and also increase its own revenue through credit control and
                                          lobbying for more external funding for it to create a sustainable
                                          revenue base. These mechanisms will therefore entail the
                                          establishment of a proper credit control unit to handle credit collection
                                          processes. Hence, the improvement on billing accuracy will need to
                                          be optimised. These efforts need to be well-communicated to
                                          communities in order to secure buy-in and thereby enhance
                                          democratic governance. Given the complexity of the situation, the
                                          municipality will need to review its credit control policy and eliminate
                                          possible gaps in the process. It is therefore critical for the Budget and
                                          Treasury Department to develop business plans for projects that need
                                          funding and submit to WRDM donor fund raiser to lobby for funding.
                                          This will afford the municipality with an opportunity to develop and
                                          maintain the municipality for the next five years and beyond.

Accelerate an inclusive growing economy   The challenges that face the Randfontein Municipality are extensive
                                          and strategically it is essential to identify key activities to mitigate the
                                          challenges. The opportunity to do so lies in local economic
                                          development. Through growth in the Geographic Gross Domestic
                                          Product of the area, prosperity for all can be ensured.

                                          With gold mining being such an important industry it is important that
                                          the town looks forward and asks the key question of how they can
                                          further benefit. Through gold beneficiation a knock-on industry can
                                          emerge. This can be done through partnerships with the mining
                                          houses and through which jobs can also be created.

                                          The processing of agricultural products is a natural progression or

8
Strategic Objective   Strategic Outcomes
                      beneficiation of the agricultural production and thereby adding value
                      and once again creating jobs.

                      The current activities surrounding the assembly of Rea Via buses
                      coupled with the national and provincial government emphasis on
                      public transport means that Randfontein can become a contributor to
                      decreasing the carbon footprint of commuters across Gauteng while
                      creating jobs locally. An attempt must be made to expand the existing
                      activities for bus assembly into an assembly cluster of businesses.

                      Randfontein Municipality must seek to compile programmes and
                      formulate policies and by-laws that encourages entrepreneurship and
                      thereby monitor and evaluate performance of the local economy and
                      investment trends. This must be focussed on the bridging of the first
                      and second economies.

                      More investments and establishment of industries and enterprises
                      should be investigated and established to diversify the economy of
                      the municipal area .The design of projects needs to include labour
                      intensive methods and identify opportunity areas and expose SMMEs
                      to incubation projects which will stimulate development and thereby
                      enhance job creation.

                      SMMEs have been shown to be far more effective job creators than
                      large corporations. Randfontein must ensure local involvement and
                      the integration of and the appointment process of labourers in capital
                      projects. Invariably the municipality will seek to develop collaboration
                      agreements with both public and private entities on programme
                      implementation.

                      The approach demands that a shotgun approach not be used, but
                      that a carefully targeted strategy be applied to local economic
                      development trading on the strengths such as agricultural production
                      and processing, beneficiation of gold, tourism, industrial
                      manufacturing and the development and exploitation of Randfontein’s
                      strength as a transportation hub.

Plan for the future   Randfontein through the West Rand District Municipality will do a
                      special development plan. This will give up-to-date direction to the
                      municipality when carrying out its planning in relation to land zoning,
                      transport routes and the environment.

                      Furthermore investment in and establishment of and upgrading of
                      nature conservation reserves and enterprises should be investigated
                      to diversify the economy of the municipal area. Randfontein must
                      create an environment conducive for economic growth through
                      investments in socio-economic infrastructure to trigger local economic
                      growth and forge partnerships with stakeholders to invest in the local
                      economy.

                      Existing policies should be reviewed or new policies developed to
                      become more enabling and focussed on establishment of
                      partnerships and networks that will enhance and expand the SMME

9
Strategic Objective Strategic Outcomes
value chain.
South Africa has, since 1994, been faced with the double challenges
of re-integration into global markets as a global economy, while at the
same time positioning itself to realise the high expectations of its
populace regarding a successful transition towards a more democratic
order.
To achieve the objectives of economic growth through
competitiveness on the one hand and employment generation and
income redistribution as a result of this growth on the other, South
Africa's small, micro and medium-sized enterprise (SMME) economy
has been actively promoted since 1995. Particular attention needs to
be given to the opportunities presented by agriculture production and
processing.
Flowing from above, it anticipated that the above will optimise
economic growth and thereby reduce unemployment within the
municipal area. Hence, spatial positioning and related possibilities to
link with and benefit from other growing economies around the
municipal area should be exploited through extensive marketing and
branding of the municipality.
A strategy must be developed to address the economic development
of Randfontein by focussing on the strength of its roads infrastructure
and ensuring that the central geographic positioning and the potential
wealth created by its use as a transport route is translated into the
economic growth of the town.
The inward migration of people into the Randfontein area with the
mushrooming of informal settlements can have a negative effect on
the town. There is a need to address this inward migration through
creative and progressive planning and management of these
settlements.
Agriculture has shown to be a job creator. Randfontein has some
excellent agricultural land and the advantage that this has not been
developed for other uses, such as housing. A clear plan to ensure
that the full potential of this land is exploited is needed so that both
small scale and larger farming opportunities are opened on suitable
land.
Establish effective and efficient services It was expressed unambiguously that the municipality is in dire need
of reviving its ageing bulk infrastructure which has bearing on current
and future developments within the municipal area with reference to:
Water
Sanitation
Electricity
Parks and cemeteries
Community and municipal facilities
Solid waste disposal
10Strategic Objective Strategic Outcomes
Infrastructural facilities are currently under pressure to accommodate
the growing population of Randfontein and yet financial resources are
not proportional to the service delivery norms. Alternatively,
infrastructure funds made available to Randfontein are not being used
due to difficulties experienced by the PMU.
Moreover, it has been said that the municipality made provision for
Free Basic Services such as water, electricity, and sanitation
according to the indigent policy subsidised by the government. This
includes 6kl of water per month, 75kwh of electricity per month from
2009/10 and free refuse removal. However, there is a growth in
demand for indigent relief overall and so there needs to be an
increase in the amounts made available for this relief in line with the
growing demands.
This disparity gave rise to the need to develop a Municipal
Infrastructural Investment Plan with specific ratios that will mitigate
current and anticipated resource bottlenecks pertaining to
infrastructural development and maintenance.
It is envisaged that the MIIP will serve as municipal strategic
imperative to deal effectively with issues of infrastructural services. It
is also worth noting that the communities can only pay for services
they deem worth the payment. Therefore, this strategic objective
becomes critical and important to realise the municipal strategic
intent.
The costs to the household and the municipality can be reduced by
the introduction of a plan for renewable energy. This plan needs to be
wide enough to reduce the household expenditure on water and
transport costs.
In addition to regular maintenance a clear plan of where Randfontein
is going to in the next five years needs to be developed so that
demand for roads, electricity, land and water can be anticipated.
Enhance effective, accountable and There is no doubt that major changes within the municipality will occur
clean institutional management and in order realise the municipal strategic intent which will have a bearing
corporate governance on business processes, systems and practices. Significant changes to
even one of those areas require sound governance structures and
leadership.
Changing them simultaneously is an extraordinary task, hence it is
envisaged that the municipality will in the future need to realign its
processes, systems and practices to legislation and henceforth
automate accordingly. Re-engineering processes, systems and
practices simply demonstrate the significance of continuous
improvement and growth of the municipality which remains inevitable
going forward.
Randfontein Municipality seeks to strengthen and effectively manage
administrative and governance systems and procedures to ensure
sound governance practices are adhered to. This ought to begin with
11Strategic Objective Strategic Outcomes
the need for ensuring the full functionality of ward committee
structures and public participation systems to enhance democratic
governance.
These will give rise to the need to maximise organisational excellence
and provide accountability to the community of Randfontein.
Develop a learning organisation Randfontein Municipality needs to acquire highly competent
workforce to successfully implement its newly developed strategic
intent. In today’s marketplace, an organisation needs to ensure that it
has adequate human resources to accomplish its mission. Because
all employers compete for employees from the same labour pool,
workforce planning is therefore critical for attracting and retaining the
talent needed to serve the communities.
This planning will become increasingly important to Randfontein
Municipality over the coming years due to increased number of staff
turnover attributed to the following internal and external factors,
namely:
HAST (HIV AIDS, Sexually Transmitted Diseases and Tuberculosis)
Ageing workforce
Migration of people to big cities and/or economic high density areas
i.e. Johannesburg
Lack to scarce skills required by the municipality for future survival
and sustainability
High illiteracy rate and unemployment
Perpetual poverty
Global warming versus change of weather patterns leading to
retrenchment of employees
Effective workforce planning entailing the acquiring, developing and
managing of human capital is a necessary component of the
municipality’s strategic plan. It makes a provision for a flexible and
proficient workforce able to adapt to the changing needs of the
municipality.
This strategy will assist the municipality to deal effectively with staffing
implications of strategic and operational plans, it will have an effects
on a full-range of human resource activities, including recruitment,
hiring, classification, compensation, and retention.
12SECTION B
THE MUNICIPALITY: DEMOGRAPHIC PROFILE
LOCAL PROFILE
MUNICIPAL CODE: SIZE OF THE MUNICIPAL AREA: WARDS:
GT482 475km2 22
Randfontein Local Municipality serves as a local municipality in the Municipal Management Area GT482,
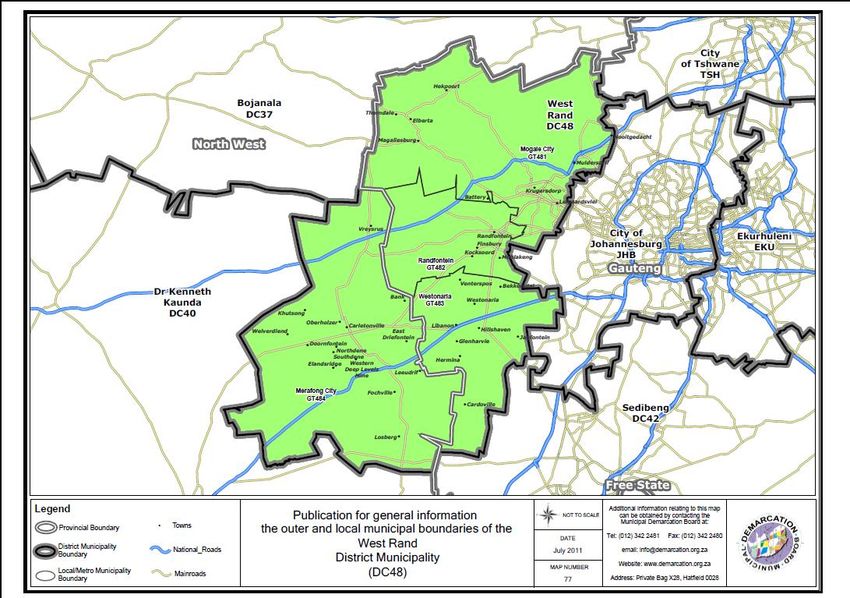
which is ±475km² in extent and its locality is depicted on figure below.
FIGURE 2: WEST RAND DISTRICT MUNICIPALITY
Randfontein
Local Municipality
The West Rand District is situated relatively close to the hub of economic activities in Gauteng, and is
traversed by major national and provincial roads, namely, the N-12, N-14, R28 and Road R559, which
creates certain potentials in terms of future economic development. RLM’s contribution to the province
lies primarily within the mining sector; however, Randfontein fulfils a residential function for many people
working in Johannesburg, Pretoria, Potchefstroom and Van der Bijl Park.
13The demographic profiles
The demographic profiles below indicate comparisons between Randfontein and Westonaria local
municipalities in the West Rand District Municipality. This is in line with MECs recommendations for
Gauteng City region planning. In view of our municipalities merging in 2016, it is indeed advisable to
compare our demographics.
Randfontein and Westonaria Socio-Economic Profile
1. Background
This document reviews the demographic profile of two of the West Rand local municipalities, Randfontein and Westonaria. It
further analyses their economic indicators and ends by briefly outlining some labour indicators.
2. Demographic Profile
According to information from the IHS Global Insight, in 2015, the total West Rand population was estimated at 850,445. Of
the total population, about 18.7 percent was accounted for by Randfontein and 13.2 percent by Westonaria region. The section
below looks at demographic profile of the two regions.
Figure 1: Total Population, Randfontein & Westonaria, 2015
180 000
160 000
140 000
Total Population
120 000
100 000
80 000
60 000
40 000
20 000
0
2010 2011 2012 2013 2014 2015
Randfontein Westonaria
Source: IHS Global Insight, 2016
Figure 1 shows that the populations of both the Randfontein and Westonaria local municipalities has been steadily increasing
since 2010, more significantly the population of Randfontein. In 2015, Randfontein accounted for 18.7 percent of West Rand’s
total population, and Westonaria for 13.2 percent.
14Figure 2: Average Population Growth, Randfontein & Westonaria, 2015
3.0% 2.0%
2.5% 1.5%
Average population Growth
1.0%
2.0%
0.5%
1.5%
0.0%
1.0%
-0.5%
0.5% -1.0%
0.0% -1.5%
1996-2001 2001-2006 2006-2011 1996-2014 2014-2019
Randfontein Westonaria (right axis)
Source: IHS Global Insight, 2016
Figure 2 shows the average and estimated population growth rates for Randfontein and Westonaria from 1996 to 2019. Over
this time, the average population growth shows a fluctuating trend between the two local municipalities. In Randfontein, the
average population growth was 2.6 percent between 1996 and 2001 and declined to 1.1 percent in the period 2006-2011,
before rising to 1.8 percent between 1996 and2014. It is expected to remain in the same rate for 2014-2019. The Westonaria
average population growth started at negative 1.5 percent in 1996-2001. It reached a high of 1.6 percent in 2006-2011 before
declining to negative 0.2 percent in 1996-2014. It is estimated to grow at an average of 1 percent in 2014-2019.
Figure 3: Population Pyramids, Randfontein & Westonaria, 2015
Randfontein Westonaria
70-74 70-74
60-64 60-64
50-54 50-54
Age Cohort
Age Cohort
40-44 40-44
30-34 30-34
20-24 20-24
10-14 10-14
00-04 00-04
9000 6000 3000 0 3 0006 0009 000 10000 5000 0 5 000 10 000
Females Males Females Males
Source: IHS Global Insight, 2016
Figure 3 shows the Randfontein and Westonaria population structures, by age and gender during 2016. About 34 percent of
the population of Westonaria is below the age of 25 in comparison to Randfontein’s 35 percent.
15Table 1: Municipal Demographics, 2015
Randfontein Westonaria
Age Structure
27,3% 28,2%
Population under 15
66,4% 68,4%
Population 15 to 64
6,4% 3,3%
Population over 65
Gender Ratio
99,9 87,8
Males per 100 females
Table 1 gives demographic information pertaining to the age structure and gender ratios of Randfontein and Westonaria local
municipalities. At 27.3 percent the population of Randfontein is below the age of 15 years in comparison to Westonaria’s 28.2
percent. The population over the age of 65 years accounted for 6.4 of the total population in Randfontein and for 3.3 percent of
the population in Westonaria. Overall, the majority of the population in both municipalities were of a working-age, at 66.4
percent and 68.4 percent in Randfontein and Westonaria, respectively. Women currently make up 50 and 47 percent of the
populations of Randfontein and Westonaria respectively.
Table 2: Municipal Demographics, 2015
Randfontein Westonaria
Dependency Ratio
50,7% 46,1%
Total Dependency Ratio
41,1% 41,3%
Child Dependency Ratio
9,6% 4,9%
Old Age Dependency Ratio
Source: IHS Global Insight & Own Calculation, 2016
Population dependency refers to the percentage of a population that depends on others for their well-being and survival. It is
expressed by means of a dependency ratio. In the case of the dependency ratios of children or of older people, these ratios
are calculated based on the number of children (0-14 years old) and older persons (65 years or over) who depend on the
working-age population (15-64 years old).1 Table 2 shows the dependency ratios of children (0-14 years) and those 65 and
older for Randfontein and Westonaria in 2015. The total dependency ratio is also given. Overall, the child dependency is
higher than that of the old age dependency, reflecting a relatively young population in both local municipalities.
Table 3: Population by Group, Randfontein & Westonaria, 2015
2010 2015
Randfontein Westonaria Randfontein Westonaria
African 101 462 100 509 113 275 104 477
White 29 502 8 119 29 486 6 281
Coloured 14 567 729 15 177 836
Asian 563 300 839 407
Total 146 094 109 658 158 777 112 000
Source: IHS Global Insight, 2016
Table 3 gives details of the municipalities’ populations by ethnic group for 2010 and estimates for 2015. The African population
group has the highest number of people in both Randfontein and Westonaria for 2010 and 2015. The White population has the
second highest number of people, followed by Coloured and then Asian population group.
163. Economic Review
Randfontein and Westonaria local municipalities are estimated to have accounted for 29.4 percent of the West Rand total
Gross Domestic Product (GDP) in 2015, combined. About 18.2 percent was accounted for by Randfontein and 11.2 percent by
Westonaria. It is worth noting that the two municipalities accounted for the least shares of the four West Rand locals. 2 The
section provides analysis of economic variables for the two selected locals and a brief overview of the labour indicators.
Figure 4: GDP-R, 2010-2015
11 000
10 000
9 000
GDP in R' 000
8 000
7 000
6 000
5 000
4 000
3 000
2010 2011 2012 2013 2014 2015
Randfontein Westonaria
Source: IHS Global Insight, 2016
Figure 4 shows the total GDP-R for Randfontein and Westonaria from 2010 to 2014 and estimates for 2015. The municipalities
had an estimated GDP-R of R8.7 and R5.4 billion in 2015 respectively, or a combined 1.5 percent of the province’s R1.1 trillion
GDP-R in that year. The figure indicates that the level of outputs in the two locals has been somewhat declining over the
analysis period except for 2013 where a marginal increase was recorded. This decline can be as result of slowdown in mining
activities in the two regions with mining companies closing down their operations.
17Figure 5: GDP-R Growth Rates, 2010-2016
10%
5%
Average Annual Growth
0%
2010 2011 2012 2013 2014 2015
-5%
-10%
-15%
-20%
-25%
Randfontein Westonaria
Source: IHS Global Insight, 2016
The figure 5 shows GDP-R growth rates for the two locals from 2010 to 2014 and estimates for 2015. Both local municipalities
had negative growth rates for most of the review periods except for 2013. Westonaria recorded a growth rate of negative 14.6
percent in 2012 before improving to negative 3.5 percent in 2014. This is so much so in Westonaria as mining activity
accounts for the largest share in the region. Growth in the Gross Domestic Product by region (GDP-R) of Randfontein and
Westonaria has been constrained by lower global and national economic growth, and thus lower demand, in major trading
partners and by internal factors such electricity supply challenges. The GDP by Region (GDP-R) of Randfontein and
Westonaria declined by 1.6 and 5.4 per cent respectively in 2015. The continued recent slump in commodity prices has also
placed pressure in economic activity of the region.
18Figure 6: Sector Share of Regional Totals, 2015
Agriculture, forestry & fishing
Mining & quarrying
Manufacturing
Electricity, gas & water
Construction
Wholesale & retail trade
Transport & communications
Finanace & busuness services
Government social & personal services
0% 10% 20% 30% 40% 50% 60% 70% 80%
Randfontein Westonaria
Source: IHS Global Insight, 2016
Figure 6 shows the sector shares of West Rand totals in the two locals for 2015. It indicates that mining dominates economic
activities in the two municipalities, more so in the Westonaria region. With the decline of mining in the Western Corridor area,
the municipalities of the West Rand have experienced significant deindustrialisation. This has had major negative effects on
the region’s economy. About 70.5 percent of economic activity in Westonaria was accounted for by the mining & quarrying
sector in 2015. In Randfontein this was at 34.7 percent, while manufacturing accounted for 15.3 percent of activity in the
region.
Figure 7: Growth in Mining Activity, 2010-2015
10%
5%
Mining & Quarrying Growth
0%
2010 2011 2012 2013 2014 2015
-5%
-10%
-15%
-20%
-25%
-30%
Randfontein Westonaria
Source: IHS Global Insight, 2016
Figure 7 expands and focuses on growth rates in mining activities between the two local municipalities from 2010 to 2014 and
estimates for 2015. The growth trend for mining activity somewhat follows that of the GDP-R of the two local municipalities as
shown figure 5 above. Growth in mining activity recorded negative 16.6 percent in 2012, while its GDP-R growth also recorded
negative 14.6 percent in the same period. Like the GDP-R growth, that of the sector remained in negative territory for most of
the review years. The Gauteng Transformation, Modernisation and Re-industrialisation (TMR) plans for the West Rand
19(Western Corridor) may help to change economic activities from being mining focussed in the two regions to include others
such as agriculture.
4. Randfontein and West Rand Labour Profile
The section reviews some labour indicators in the Randfontein and Westonaria local municipalities.
Figure 8: Total Employment & Growth, 2010-2014
100 0.0%
-2.0% 2010 2011 2012 2013 2014
90
Total Employment ('000)
Employment Growth Rate
80 -4.0%
70 -6.0%
60 -8.0%
50
-10.0%
40
-12.0%
30
-14.0%
20
-16.0%
10
0 -18.0%
2010 2011 2012 2013 2014 -20.0%
Randfontein Westonaria Randfontein Westonaria
Source: IHS Global Insight, 2016
Figure 8 shows both total employment levels and growth thereof in Randfontein and Westonaria from 2010 to 2014.
Employment levels in both local municipalities’ shows a declining trend over the review period. In Randfontein this decreased
from 46,470 in 2010 to 41,118 in 2014. That for Westonaria also decreased from 41,691 in 2010 to 33,300 in 2014.
Employment growth rate remained in negative territory for the entire review period. In Westonaria, employment growth was at
its lowest level in 2012 at negative 16.4 percent. During the same period, GDP-R growth also contracted by 14.6 percent.
20Figure 9: Employment by Sectors, 2014
Agriculture, forestry & fishing
Mining & quarrying
Manufacturing
Electricity, gas & water
Construction
Wholesale & retail trade
Transport & communications
Finanace & busuness services
Government & social services
Personal & household services
0% 5% 10% 15% 20% 25% 30%
Ranfontein Westonaria
Source: IHS Global Insight, 2016
Figure 9 shows the proportion of employment by sector in the two locals for 2014. The figure confirm mining & quarrying sector
at dominating employment shares at 25.6 percent for Randfontein and 20.5 for Westonaria. It however, also indicates the
strength of the wholesale & retail trade which accounts for 17.6 percent of people employed in Randfontein and 17.8 percent
for those in the Westonaria.
Figure 10: Unemployment Rates, 2010-2014
50%
45%
40%
Unemployment Rate
35%
30%
25%
20%
15%
10%
5%
0%
2010 2011 2012 2013 2014
Randfontein Westonaria
Source: IHS Global Insight, 2016
Figure 10 shows unemployment rates in Randfontein and Westonaria from 2010 to 2014. Due to low economic activity and
dependency on specific sectors such as mining & quarrying, district regions and their local municipalities tends to have one of
21the highest unemployment rates. The figure indicates an increasing trend in unemployment rates with Randfontein reaching a high rate of 34.2 percent in 2014, while Westonaria was at 47 percent in the same year. 5. Conclusion The population of the two regions continued to growth over the years, with Randfontein having the highest total dependency ratio compared to Westonaria. The economic size of Randfontein and Westonaria continued to decline over the years and its growth rate hovering around negative territory. Thus the heavy reliance onto natural resources proves to be negatively affecting economic activity in the two local municipalities. Growth of the activities in the mining sector also has deteriorated over the analysis period. The TMR as provincial government policy may help in growing the agro-processing sector, while the wholesale & retail trade sector is one of the prominent employers in the two local municipalities. 22
SECTION C

                         EXECUTIVE MAYOR
                      CLLR MZI ELIAS KHUMALO

SPEAKER                             CHIEF WHIP
CLLR BRENDA MAHUMA                  CLLR JEJE LEGOETE

MMC INFRASTRUCTURE                  MMC PUBLIC SAFETY
CLLR ARTHUR SAMPSON                 CLLR LAZARUS MATSHUISA

23
MMC: WASTE AND ENVIRONMENT MMC CORPORATE SUPPORT SERVICES CLLR THERESA KIMANE CLLR XOLISA NTSEPO MMC SOCIAL SERVICES MMC LED CLLR THEMBI MATUWANE CLLR MAMASOLE GAMA MMC DEVELOPMENT PLANNING MMC FINANCE CLLR SIPHO MATAKANE CLLR TINA GROBLER 24
POWERS AND FUNCTIONS OF THE MUNICIPALITY
WHO IS THE EXECUTIVE?

The Executive Authority in the Municipality is held by Council; however in terms of section 60(3) of the
Municipal Systems Act Council has delegated the Executive Functions to the Executive Mayor.

The executive is therefore constituted by the executive mayor and the chairpersons of the following
committees as delegated by Council:

 PORTFOLIO                                                    MMC
 Development Planning                                         Cllr. S. Matakane
 Social Services                                              Cllr. T. Matuwane
 Corporate and Support Services                               Cllr. X. Ntsepo
 Finance                                                      Cllr. T. Grobler
 Infrastructure                                               Cllr. A. Sampson
 Waste & Environment                                          Cllr. T. Kimane
 Public Safety                                                Cllr. L. Matshuisa
 Local Economic Development                                   Cllr M.Gama

The executive is directly responsible for taking decisions on matters concerning service delivery and
administration.

  LIST OF RANDFONTEIN LOCAL MUNICIPALITY WARD COUNCILLORS

          NAME                TYPE OF COUNCILLOR                 RESPONSIBILITY                  PARTY

 M Khumalo                   Proportional Rep              Executive Mayor                  ANC

 B Mahuma                    Proportional Rep              Speaker of Council               ANC

 J Legoete                   Proportional Rep              Council Whip                     ANC

 T Grobler                   Proportional Rep              MMC Finance                      ANC

 T Kimane                    Proportional Rep              MMC Environment and              ANC
                                                           Waste

 L Matshuisa                 Ward Councillor               WARD 16 MMC Public               ANC
                                                           Safety

 S Matakane                  Proportional Rep              MMC Development Planning         ANC

 M.Gama                      Proportional Rep              MMC Local Economic               ANC
                                                           Development

 T Matuwane                  Proportional Rep              MMC      Social Services         ANC

25
NAME TYPE OF COUNCILLOR RESPONSIBILITY PARTY X Ntsepo WARD Councillor WARD 2 MMC Corporate ANC A Sampson WARD Councillor WARD 5 MMC Infrastructure ANC M Mtyotywa WARD Councillor WARD 11 ANC T Bogale WARD Councillor WARD 14 ANC P Faku WARD Councillor WARD 22 ANC S Handula Proportional Rep ANC J Kutoane WARD Councillor WARD 17 ANC T Mananiso Proportional Rep ANC N Mapena Proportional Rep ANC B Matebesi WARD Councillor WARD 1 ANC F Matshogo WARD Councillor WARD 21 ANC N Mavuso Proportional Rep ANC J Mbangeni WARD Councillor WARD 12 ANC D Mogale WARD Councillor WARD 19 ANC K Mogapi WARD Councillor WARD 18 ANC W Nawa WARD Councillor WARD 15 ANC G Ndebele Proportional Rep ANC M Sello WARD Councillor WARD 13 ANC J Beaufort Proportional Rep DA P Bezuidenhout Proportional Rep DA B Blake Proportional Rep DA D Cloete WARD Councillor WARD 20 DA E du Plessis WARD Councillor WARD 6 DA P Dick WARD Councillor WARD 9 DA S Erasmus WARD Councillor WARD 4 DA 26
NAME              TYPE OF COUNCILLOR                RESPONSIBILITY                   PARTY

 P Francis                   Proportional Rep                                               DA

 C Harrison                  WARD Councillor               WARD 7                           DA

 G Kruger                    Proportional Rep                                               DA

 B Dreyer                    Proportional Rep                                               DA

 B Rooskrantz                WARD Councillor               WARD 8                           DA

 P Simon                     Proportional Rep                                               DA

 E De Lange                  Proportional Rep                                               DA

 A van Tonder                WARD Councillor (Party        WARD 3                           DA
                             Whip)

 S Bock                      WARD Councillor               WARD 10                          DA

 S May                       Proportional Rep                                               COPE

MUNICIPAL PUBLIC ACCOUNTS COMMITTEE (MPAC)

This is an oversight committee of council reporting to council. The committee is chaired by Councillor
Festus Matshogo and provides political oversight of financial management and accounts.

All MPAC Councillors

 Cllr. Festus Matshogo (Chairperson)

Cllr. Jerminah Kutoane
Cllr. Gwen Ndebele
Cllr. Philile Faku
Cllr. Kgomotso Mogapi
Cllr. Moses Mtyotywa
Cllr. Paul Francis
Cllr. Solomon May
Cllr. Regetta Beaufort
Cllr. Gerhard Kruger

27
Performance Accountability
Any programme or project whereby Randfontein improves its responsiveness and accountability to
communities for its performance, and specifically battling corruption.
SECTION D
Process followed to develop the IDP
Before embarking upon the IDP review Process, a Process Plan was prepared and adopted by Council in
August 2015. The process Plan, in accordance with the legislative requirements, sets out the following:
a programme identifying planning activities and associated timeframes;
mechanisms and procedures for participation and consultation;
the institutional arrangements to manage the IDP; and
plans and planning requirements binding the municipality in terms of legislation
All processes have been completed to comply with the following approved process plan:
Phase I: Analysis
All existing information will be provided to the Office of Municipal Manager – in electronic format by the
Executive Managers as well as Senior Managers.
Ward meetings will be arranged and facilitated by ward Councillors and/or chairpersons of ward
committees
Office of Municipal Manager will assist with the preparation of appropriate background material for ward
meetings
Phase II: Strategies
Allowance is made for participation at district level workshops during this phase.
Supportive and background documentation will be provided for IDP Representative Forum meetings.
All Representative Forum meetings will be chaired and facilitated by the Executive Mayor.
Phase III: Projects
During this phase, allowance is made for various professional persons to assist in designing and
determining the feasibility of various project proposals
Allowance is made for participation at district and provincial level workshops.
Background material for, as well as documentation of the results of one IDP Representative Forum
meeting will form part of activities in this phase
Phase IV: Integration
The information emanating from previous phases would be utilised to prepare the required sector
summary programmes.
Allowance is made for assisting in the preparation for and documentation of results of two IDP
Representative Forum meetings
Phase V: Approval
During this phase, the potential role of Office of Municipal Manager would mainly be to incorporate
comments from various parties into the draft IDP review.
28The estimated budget for direct expenses during the process is outlined below.
ITEM ESTIMATED BUDGET ESTIMATED BUDGET
(IDP) (PMS)
1. Press Advertisements R20 000.00 R20 000
2. Development, alignment and integration Operational Operational
of sector plans
3. Printing, translation and Duplicating R450 000.00 R600 000
Costs etc. (e.g. maps, diagrams,
documents) and Other Means of
communication (e.g. brochures, posters
etc.) Final Gloss Document.
4. Venue, re-imbursement for transport R166 000.00 R180 000
costs and Catering
Costs for IDP Representative Forum and
Advisory committee Meetings (allow for 4
meetings)
5. Roll-out of ward based programs to all R152 000.00 R160 000
wards. Tents and Chairs
TOTAL R 788 000.00 R960 000
TIMEFRAMES FOR IDP PROCESS PLAN
Table below provides all activities, responsibilities and stakeholders and timeframes.
PHASES ACTIVITIES RESPONSIBLE DATES
Phase 1 Planning
Process
Presentation to IDP/ budget and PMS IDP Unit August 2015
steering committee
Adoption of IDP/ budget and PMS IDP unit and BTO August 2015
Process Plan 2016/17
Strategic Presentation to councillors IDP and BTO August 2015
IDP/BUDGET/PMS Review of 2016/17 public participation IDP unit and BTO October 2015
workshop for Mayoral to determine the following
Committee and What needs to be improved
Senior Management for the public participation
What are the possible
alternatives for the next public
participation?
Review 1st quarter IDP unit and BTO October 2015
performance
Determine service delivery
priorities
Agree on MTFF and it
assumptions.
Agree on initial cash limits for
29each department
MEC comments review IDP Unit Oct/Nov 2015
Executive Managers/Managers All Departments Oct/November
complete stage 1 IDP/Budget input 2015
forms.
Public Participation Process Exec. Mayor Oct/Nov 2015
Phase 2 Analysis
Community and Community and stakeholder register Office of the October/Nov
stakeholder analysis Speaker 2015
Consideration of economic priorities Financial Services Oct/Nov 2015
Institutional analysis Corporate Services Oct/Nov 2015
Spatial Priorities Planning and Oct/Nov 2015
Development
Socio-Economic Priorities IDP Unit Oct/Nov 2015
Institutional transformation All Departments Oct/Nov 2015
Compliance with IDP legal framework The entire Oct/Nov 2015
municipality
Alignment of Priorities IDP unit Oct/Nov 2015
PHASE 3
STRATEGIES
Vision and Mission The entire October/Nov
municipality 2015
Objectives and development priorities The entire October/Nov
municipality 2015
Program and Project Identification The entire October/Nov
municipality 2015
PHASE 4
PROGRAMME AND
PROJECTS
Project &program Priority Programs and Projects All Departments
proposals
Project costing CAPEX and OPEX costing BTO
Setting of project targets and All Departments December
indicators 2015
PHASE 5
INTEGRATION
MEC comments IDP unit
Sectoral plans January 2016
Operational plans All Departments
Performance review M& E January 2016
Agreement on the 2016/17 IDP and BTO January 2016
adjustment budget
Agreement on changes
proposed by Executive Mayor
and Councillors on
30IDP/Budget and PMS
Tabling of the midyear performance Executive Mayor February 2016
review and 2016/17 annual report
Submission of stage II input forms by All Department February 2016
Executive Managers and Manager
PHASE 6
APPROVAL
Tabling of the Draft IDP/Budget/Draft IDP/Budget Office March 2016
SDBIP to IDP Steering Committee
Tabling of the draft IDP/ budget/SDBIP Executive Mayor March 2016
to council
Public Notice inviting comments IDP unit March 2016
Statutory Public Participation process
Responses to and incorporation of Exec. Mayor April 2016
comments including portfolio
Committees inputs
Tabling of IDP and budget and SDBIP Municipal Council May/June 2016
for consideration approval.
Submission of the approved IDP to the IDP unit June/July 2016
MEC of Local Government
Approval of the SDBIP Executive Mayor June/July 2016
Review of the previous year’s budget CFO July 2016
process by completing the budget
evaluation checklist
PHASE 7
IMPLEMENTATION
Project implementation in accordance All Departments July 2016
with the SDBIP
Monitoring M&E
Review All Departments January 2016
Quarterly reporting MM, MEC, council IDP and Internal Every quarter
Audit Unit
PHASE 8 ANNUAL
REVIEW
Draft Annual Report Submission of unaudited Draft Annual M&E Aug 2016
Report to MPAC
Submission of the Annual Report to M&E Aug 2016
AG
314th (April – June) quarter assessment PMS Manager Aug 2016
report and annual report presented to
the PAC
Make public the SDBIP and PMS Manager Aug 2016
Performance Agreements
Place annual performance agreements PMS Manager Aug 2016
on the website
Submission of the 2015/16 PMS Manager Aug 2016
performance report to the office of the
Auditor General
1st quarter performance assessment PMS Manager Oct 2016
Compile and distribute budget CFO Nov 2016
guidelines, parameters and formats
Review tariffs and charges and CFO Nov 2016
prepare proposals of new rates
Draft or review budget related policies CFO Nov 2016
such credit control and indigent policy,
tariff policy, budget policy etc.
Oversight Report Oversight Report made public and Council Dec 2016
Submitted to National Treasury and
Local Government Departments
Finalize first draft of annual PMS Manager Dec 2016
departmental operational plans,
service delivery and budget
implementation plan for reviewing
against strategic priorities
Finalize first draft of the annual report PMS Manager Dec 2016
including annual report of the entity
incorporating financial and non-
financial information on performance,
audits reports and annual financial
statements
Review implementation of the SDBIP, PMS Manager Dec 2016
identify problems, amend or
recommend appropriate amendments
Projects Consolidate and prepare proposed CFO Jan 2016
budget and plans for next financial
years taking into account previous
year performance as per audited
financial statements
2nd (October – December) quarterly report to PMS Manager Jan 2016
Performance Audit Committee (PAC)
Tabling of a revised budget through CFO Jan 2016
adjustment budget
Integration 3rd quarter Performance reviews PMS Manager Apr 2016
32You can also read