Reduction of CO2-Emissions ejected by Heavy-Duty-Vehicles
←
→
Page content transcription
If your browser does not render page correctly, please read the page content below
Reduction of CO2-Emissions
   ejected by Heavy-Duty-Vehicles
                           in the Port of Hamburg

Drafted by:            Hanseatic Transport Consultancy

Project Partner:       Port of Hamburg

Date:                  18 November 2020

        Interreg Europe – PGI05855, Reducing CO2 Emissions in Ports, SMOOTH PORTS | 1 / 72
EXECUTIVE SUMMARY
As one of largest ports in Europe, the Port of Hamburg is an important hub for international
transport and supply chains. On average 33,000 vehicles use the main port roads every day –
a third are heavy-duty vehicles (HDV) which account for a large proportion of the port's annual
produced CO2 emissions. Based on the provided data it can be estimated that around 17,500
tons of CO2 were produced by HDV in the Port of Hamburg during the first half of 2018. To
identify potential measures to reduce emissions, four different types where examined:
Measures which…

   •   have already been implemented in the Port of Hamburg and are in regular operation,
   •   are being tested as pilot projects in the Port of Hamburg,
   •   are currently being discussed in the Port of Hamburg and
   •   additional good practices with from other countries and ports.

In order to recommend a course of action for the Port of Hamburg different measures working
towards the same goal were combined into twelve clusters. This approach helps to build on
existing regional achievements while ensuring that the broadest possible overview can be used
in terms of transferability to and from other ports.

Figure 1 Classification of measures into categories and clusters

        Interreg Europe – PGI05855, Reducing CO2 Emissions in Ports, SMOOTH PORTS | 2 / 72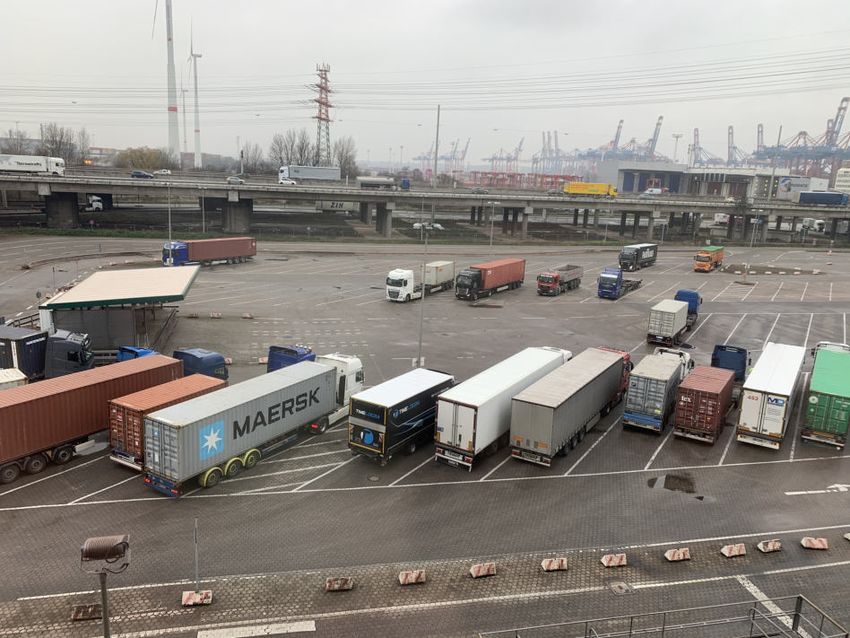
Each cluster has been assessed according to three aspects in order to recommend further
action:

   •      Impact (y axis) refers to the assessment of the possible success that can be achieved
          by establishing the cluster.
    • Effort (x axis) refers to the estimated contribution that is required for the
          implementation of the cluster.
    • Potential for the Port of Hamburg (bubble size) describes the compatibility as well
          as applicability to the conditions in Hamburg.

Based on these variables the clusters are presented in a matrix to make them comparable in
a comprehensive format and support the further decision-making processes.

Figure 2 Cluster Analysis Summary

Continuous steering of these measures is of particular relevance to enable the best possible
outcome. To reduce the risk that too many parallel initiatives emerge without benefiting from
another, conflicts should be minimized by identifying the relevant gaps and potential synergies
in advance. It is particularly important to develop a well-coordinated comprehensive strategy

           Interreg Europe – PGI05855, Reducing CO2 Emissions in Ports, SMOOTH PORTS | 3 / 72
and concept for the Port of Hamburg as a whole. A detailed and transparent data collection
process plays a key role for a complete and effective evaluation of emissions. In general, the
potential environmental impact is rarely quantitatively assessed or evaluated specifically when
projects are considered, analyzed or rated. Therefore, it is recommended to adjust the data
collection processes to allow a reliable and verifiable evaluation.

The four clusters with the highest potential to reduce CO2 emissions in the Port of Hamburg
are Support Technological Developments (4), Process Consolidation (12), Emissions
Reduction Strategy (1) and Sustainable Driving (2).

As indicated by the quadrants, the matrix is divided into four categories. The individual clusters
and related measures were assigned to the four quadrants and thus the prioritization of the
different clusters can be quickly assessed:

Easy Wins (top left) give a high return based on the necessary effort.
Big Bets (top right) provide long term results but require planning and strategy.
Increments (bottom left) do not require a lot of effort but neither do they offer many benefits.
Money Pit (bottom right) are time- & money-consuming activities with low impact.

        Interreg Europe – PGI05855, Reducing CO2 Emissions in Ports, SMOOTH PORTS | 4 / 72
CONTENTS

EXECUTIVE SUMMARY ...................................................................................................... 2

LIST OF FIGURES ............................................................................................................... 6

LIST OF TABLES ................................................................................................................. 8

ABBREVIATIONS ................................................................................................................. 9

1      PREFACE .................................................................................................................. 10

2      STRUCTURE OF THE REPORT ............................................................................... 11

3      STATUS ANALYSIS ................................................................................................... 12

    3.1       EMISSIONS IN THE PORT OF HAMBURG ...................................................... 14

4      IDENTIFICATION OF MEASURES ............................................................................ 16

    4.1       IMPLEMENTED PROJECTS ............................................................................. 17

    4.2       PILOT PHASE AND IN DISCUSSION ............................................................... 26

    4.3       IN DISCUSSION ................................................................................................. 31

    4.4       GOOD PRACTICES ........................................................................................... 33

5      ANALYSIS OF MEASURES ....................................................................................... 44

    5.1       STRATEGY ........................................................................................................ 46

    5.2       TRAFFIC SHIFT ................................................................................................. 51

    5.3       TRAFFIC MANAGEMENT .................................................................................. 54

    5.4       TRAFFIC AVOIDANCE ...................................................................................... 58

6      RECOMMENDATION ................................................................................................ 62

BIBLIOGRAPHY ................................................................................................................. 66

APPENDIX ......................................................................................................................... 72

          Interreg Europe – PGI05855, Reducing CO2 Emissions in Ports, SMOOTH PORTS | 5 / 72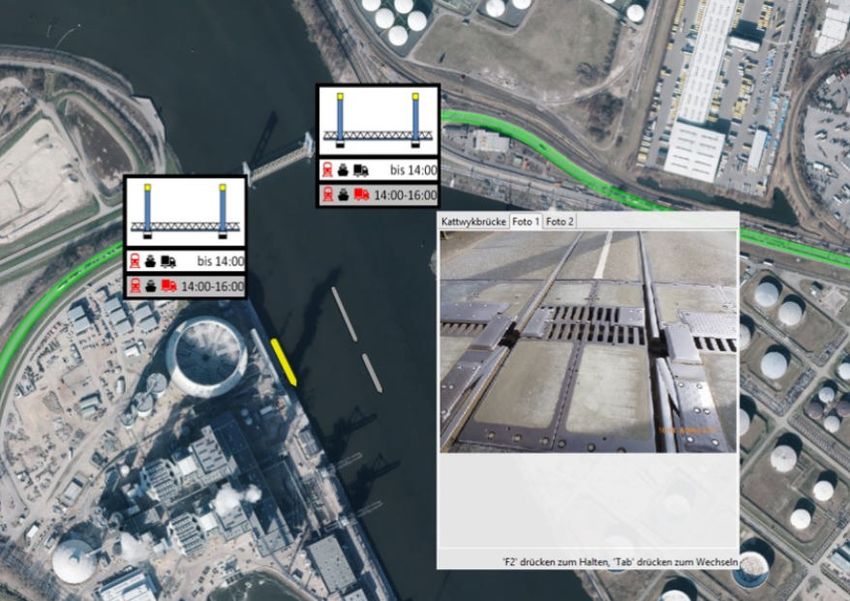
LIST OF FIGURES
Figure 1 Classification of measures into categories and clusters ............................................ 2
Figure 2 Cluster Analysis Summary ......................................................................................... 3
Figure 3 Approach .................................................................................................................. 11
Figure 4 Equation to calculate CO2 emissions from on-road heavy-duty vehicles (GEF-UNDP-
IMO GloMEEP Project and IAPH, 2018) ................................................................................ 12
Figure 5 Modal Split in the Port of Hamburg (Port of Hamburg, 2019) .................................. 14
Figure 6 Most important roads and crossing in the Port of Hamburg (HPA, 2018) ................ 14
Figure 7 HDV Population in the Port of Hamburg on an average weekday (HPA, 2019) ...... 15
Figure 8 Summary of the Identified Measures ....................................................................... 16
Figure 9 Container Taxi in Port of Hamburg (Eckelmann Group, 2020) ................................ 17
Figure 10 Dynamic parking space management for trucks (Port of Hamburg, 2016) ............ 18
Figure 11 The Port Road Management (Hamburg Port Authority, 2014)............................... 19
Figure 12 myboxplace.de - the digital exchange platform for empty containers (DAKOSY, n.d.)
............................................................................................................................................... 20
Figure 13 Night Trips in Hamburg (Hamburg Port Authority, 2019) ....................................... 21
Figure 14 Guiding Truckers to available spaces in Port of Hamburg (Nedap, n.d.) ............... 22
Figure 15 Smart Maintenance (Smart City Kompass, n.d.) .................................................... 23
Figure 16 Slot-Booking for truck visits (HHLA, n.d.) ............................................................... 24
Figure 17 New Safety Signs (own presentation based on Port of Hamburg, n.d.)................. 25
Figure 18 Truck Loading in the Night (HHLA, 2019) .............................................................. 26
Figure 19 Intelligent Traffic Lights (HPA, n. d.) ...................................................................... 27
Figure 20 The digital harbor (Hamburg Port Authority, n.d.) .................................................. 28
Figure 21 Driverless vehicles at the container terminal (HHLA, 2020) .................................. 29
Figure 22 "Green wave" with traffic light assistant for cyclist (City of Hamburg, 2020) .......... 30
Figure 23 The Port of Hamburg as a European sea customs port (Port of Hamburg, n.d.) ... 31
Figure 24 Container Hub (Logisitik Watchblog, 2020) ........................................................... 32
Figure 25 Mobile OCR (Port Technology, 2018) .................................................................... 33
Figure 26 Clean Truck Program in Los Angeles (Port of Los Angeles, n.d.) ......................... 34
Figure 27 San Pedro Bay Ports Clean Air Action Plan (The Port of Los Angeles, n.d.) ........ 35
Figure 28 The Valley Driving School in Canada (Valley Driving School, 2017) ..................... 36
Figure 29 Idle Free in BC (BC Climate Action Toolkit, n.d.) ................................................... 37
Figure 30 The Ecocalculator (Port de Barcelona, n.d.) .......................................................... 38
Figure 31 The Port Authority of NY & NJ (Port Authority NY NJ, 2020) ................................. 39
Figure 32 A green smiley for more safety (Presse Box, n.d.) ................................................ 40

            Interreg Europe – PGI05855, Reducing CO2 Emissions in Ports, SMOOTH PORTS | 6 / 72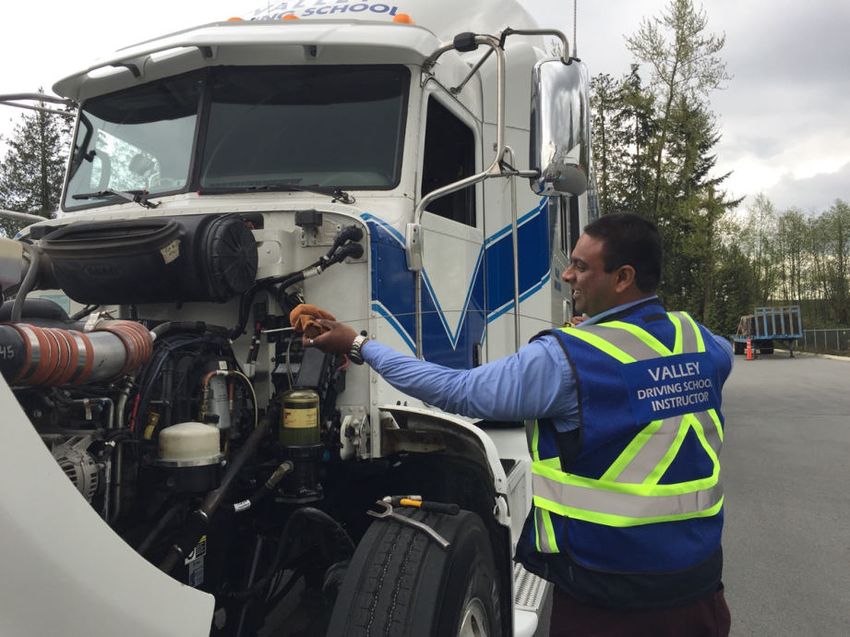
Figure 33 Portolog (Santos Port Authorithy, n.d.) .................................................................. 41
Figure 34 Front page of the annual Technology Advancement Program Report (Ports, 2019)
............................................................................................................................................... 42
Figure 35 The Integrated Truck Guidance (Duisport, n.d.) .................................................... 43
Figure 36 Classification of measures into categories and clusters ........................................ 44
Figure 37 Cluster Analysis Summary ..................................................................................... 62

            Interreg Europe – PGI05855, Reducing CO2 Emissions in Ports, SMOOTH PORTS | 7 / 72
LIST OF TABLES
Table 1 Summarized analysis of the Cluster Emissions Reduction Strategy                      47
Table 2 Summarized analysis of the Cluster Sustainable Driving                               48
Table 3 Summarized analysis of the Cluster Reduce Polluting Trucks                           49
Table 4 Summarized analysis of the Cluster Support Technological Development                 51
Table 5 Summarized analysis of the Cluster Time Shift                                        52
Table 6 Summarized analysis of the Cluster Support Model Shift                               54
Table 7 Summarized analysis of the Cluster Traffic Data Management                           55
Table 8 Summarized analysis of the Cluster Coordination of Arrival and Departure             57
Table 9 Summarized analysis of the Cluster Predictive Maintenance                            58
Table 10 Summarized analysis of the Cluster Parking Space Management                         59
Table 11 Summarized analysis of the Cluster Container Consolidation                          60
Table 12 Summarized analysis of the Cluster Process Consolidation                            61

        Interreg Europe – PGI05855, Reducing CO2 Emissions in Ports, SMOOTH PORTS | 8 / 72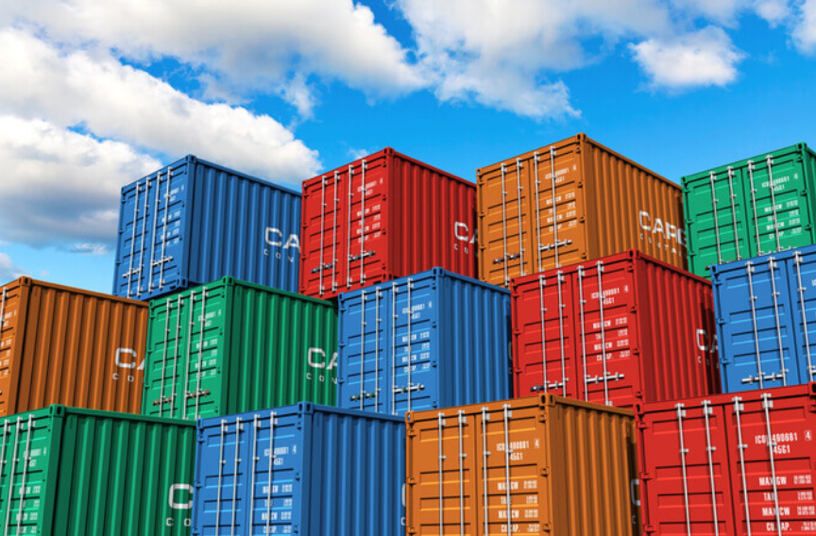
ABBREVIATIONS
BWI                Ministry of Economy and Innovation
                   (in German: Behörde für Wirtschaft und Innovation)
CO2                Carbon Dioxid
DIVA               Dynamic information on traffic flow in the port
                   (in German: Dynamisches Information zum Verkehrs-Aufkommen im Hafen)
ETV                European Union Environmental Technology Verification
EVE                Effective depiction of the traffic situation
                   (in German: Effektive Verkehrslagedarstellung)
GHG                Greenhouse gas
GloMEEP            Global Maritime Energy Efficiency Partnerships
HBEFA              Handbook Emission Factors for Road Transport
HDV                Heavy-Duty-Vehicle
HHLA               Hamburg Hafen und Logistik AG
HPA                Hamburg Port Authority
NMVOC              non-methane volatile organic compounds
LCL                Less than Container Load
LIHH               Logistics Initiative Hansestadt Hamburg
LNG                Liquefied Natural Gas
PRM                Port Road Management
NABU               Nature and Biodiversity Conversation
SO2                Sulphur Dioxid
UBA                Umweltbundesamt
VHSp               Hamburg Freight Forwarders Association
                   (in German: Verein Hamburger Spediteure e. V.)
VMT                Vehicle miles travelled
V2X                Vehicle-to-everything

       Interreg Europe – PGI05855, Reducing CO2 Emissions in Ports, SMOOTH PORTS | 9 / 72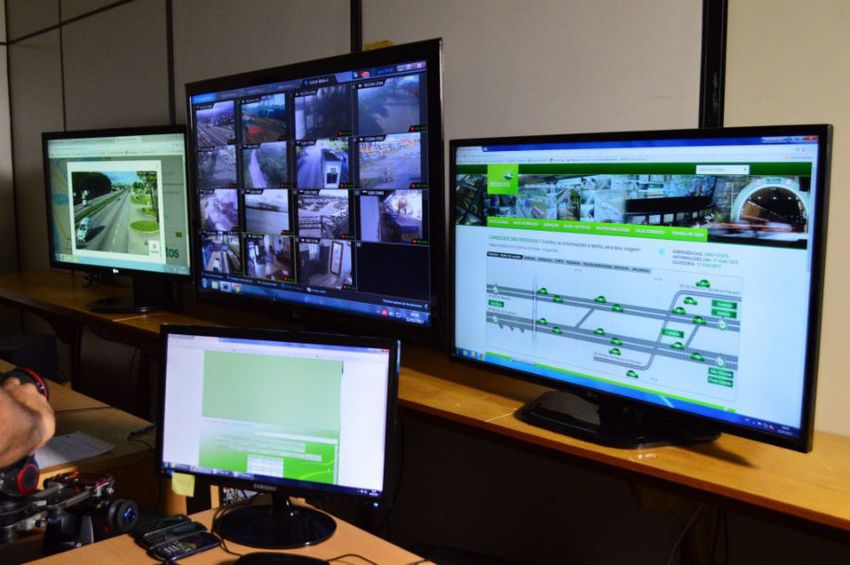
1       PREFACE
As one of largest ports in Europe, the Port of Hamburg is an important hub for international
transport and supply chains. Whereas a huge proportion of the long-distance transports to and
from the port are railway-based, road transport is still the dominating mode when it comes to
transports within the port area and short-distance haulage. On average 33,000 vehicles use
the main port roads every day – a third of which are heavy-duty vehicles (HDV) which account
for a large proportion of the port's annual produced CO2 emissions.

In the Interreg Europe project "Smooth Ports", Hamburg represented through the Ministry of
Economy and Innovation (BWI) partners with local authorities from four other European port
cities in France, Italy and Bulgaria to jointly work on solutions that improve the traffic flow within
the ports and potentially reduce CO2 emissions. For Hamburg, the project is an important step
within the execution of the climate plan and the necessary mobility transformation.

An essential part of the project are local studies prepared by each project partner. The aim is
to determine CO2 emissions caused by HDV in each port and identify ideas to reduce those
emissions according to local conditions. The focus of the Hamburg-based study is to identify
measures that increase efficiency in cargo handling and assess the potential to reduce
emissions. In the final stage, the individual results of each study will be shared and discussed
among all project partners.

        Interreg Europe – PGI05855, Reducing CO2 Emissions in Ports, SMOOTH PORTS | 10 / 72
2 STRUCTURE OF THE REPORT
Figure 1 gives an overview of the basic structure of this report consisting of the three work
packages Status Analysis, Identification of Measures and Analysis of Measures. The proposed
procedure is outlined and explained in terms of methodology and content. The individual work
packages are not to be understood as independent units in the sense of silos. Rather, the
intelligent networking of the findings from the individual work packages is key to a requirement-
oriented assessment of relevant measures.
Figure 3 Approach
The information collected in work package 1 Status Analysis determined the CO2 emissions of
the HDV (Heavy-Duty-Vehicle) transports. According to the European Commission, HDV
vehicles are defined as “freight vehicles of more than 3.5 tones (trucks) or passenger transport
vehicles of more than 8 seats (buses and coaches)“ (European Commission, 2014).
In total 27 measures are being discussed in work package 2 Identification of Measures. They
are grouped by their current project status in Port of Hamburg and international good practices.
Based on this, the measures are clustered and analyzed in work package 3 Analysis of
Measures. In the concluding chapter, the measures are prioritized and a recommendation for
further actions is outlined.
Interreg Europe – PGI05855, Reducing CO2 Emissions in Ports, SMOOTH PORTS | 11 / 723 STATUS ANALYSIS
Currently, there is no worldwide standardized process or formula for collecting the port
emissions. In order to ensure comparability within the SMOOTH PORT project, the produced
emissions were calculated by using the formula provided in the Port Emission Toolkit published
in 2018 by GloMEEP Project Coordination Unit International Maritime Organization (GEF-
UNDP-IMO GloMEEP Project and IAPH, 2018).
To estimate the emissions (Ei) caused by on-road HDV in the Port of Hamburg the formula
(Figure 2) as well as the needed variables are explained in the following paragraphs. It is
common practice to measure and/or determine emissions over the period of a year. For the
purposes of the project’s time constraints, the time frame has been specified for half a year.
The necessary background information and needed data for the assessment was obtained
from the Hamburg Ports Authority (HPA) as well as site-specific studies such as the Border
One Stop Shop Waltershof feasibility study. As a high-quality data basis is determining the
quality of the assessment the available data was reviewed and analyzed through qualified
expert interviews with relevant stakeholders such as the HPA, terminal operators and non-
governmental organization like the Nature and Biodiversity Conversation (NABU). For further
research the HPA's Sustainability Report (HPA, 2018) and Road Traffic Reports (HPA, 2019)
were reviewed.
Figure 4 Equation to calculate CO2 emissions from on-road heavy-duty vehicles (GEF-UNDP-IMO
GloMEEP Project and IAPH, 2018)
Interreg Europe – PGI05855, Reducing CO2 Emissions in Ports, SMOOTH PORTS | 12 / 72Emissions (Ei): There are many different types of emissions that are produced during on-road
heavy-duty transports. In addition to the well-known emission carbon dioxide (CO2), particulate
matter, nitrogen oxides (NO2) and small amounts of sulphur dioxide (SO2) as well as non-
methane volatile organic compounds (NMVOC) are produced. With regards to the overall
project goal and to ensure a cross-location comparability only CO2 emissions are to be
evaluated.
Population (Pop): The population includes all HDV vehicles accessing and exiting the Port of
Hamburg. In the case of the Port of Hamburg, the traffic censuses from 2018 provided by the
HPA will be used, as the data for 2019 is not available at the time of finalization of this study.
As there is currently no data available on the specific truck models and their age-weighted
distribution at the port, this initial estimate will be based on the data provided by the HPA so
far, published data by the Federal Environment Agency and the publicly available reports of
the Port of Hamburg.
Emissions Factor (EF): In Germany the emissions factor of HDV is calculated in the
“Handbook Emission Factors for Road Transport” (HBEFA) by the German Ministry of
Environment (in German Umweltbundesamt, short UBA). It is estimated in cooperation with
different European governments and research institutes. As the emissions factor is published
with an age-weighted distribution, the relevant emission factors can be applied without making
additional assumptions.
Activity (ACTi): The activity is broken down in three different areas: Vehicle miles travelled
(VMT) per vehicle trip, on-terminal activity as well as number of starts after vehicle rests. The
VMT per vehicle trip while in the port area are estimated based on expert statements within
the HPA. Currently no valid estimations could be recorded for the on-terminal activities or the
number of starts after certain vehicle rests.
Fuel Correction Factors (FCF): The fuel correction factor is dependent on the emissions
factor and the type of fuel used by the fleet. As in Germany the fuel is already estimated based
on standard average fleet estimations within the emissions factor of the HBEFA, the fuel
correction factor is 1.
Control Factors: Control factors account for emissions reductions, such as from emissions
control equipment installed by the manufacturer. Verified technologies for the European Union
can be reviewed online (European Commission, 2020).
Interreg Europe – PGI05855, Reducing CO2 Emissions in Ports, SMOOTH PORTS | 13 / 723.1 EMISSIONS IN THE PORT OF HAMBURG
The central location of the Port of Hamburg within the Hanseatic City increases the potential
for conflict with regard to air emission values and thus future developments. In comparison to
other European ports the rail share in hinterland traffic is quite high as more than half (51,3%)
of cargo is handled by trucks in the Port of Hamburg.
Figure 5 Modal Split in the Port of Hamburg (Port of Hamburg, 2019)
Additionally, many internal port transfers are conducted via the road as well. Due to the high
proportion of HDV traffic, the reduction of CO2 emissions from these transports is a critical
factor for sustainable port development, especially in Hamburg. The main transport network
covers 31 km and is divided into eight sections to enable a differentiated assessment. The
HPA distinguishes between two categories of port roads: service roads as well as main and
through roads. Most of the HPA's data collection focuses on the port's main and through road
network.
Figure 6 Most important roads and crossing in the Port of Hamburg (HPA, 2018)
Interreg Europe – PGI05855, Reducing CO2 Emissions in Ports, SMOOTH PORTS | 14 / 72Traffic data in the Port of Hamburg is collected selectively and recorded without destination-
source relationships (Figure 5). Roughly around 17.100 HDV entry and exit the port area on a
weekday. The HDV traffic consists of 61% articulated lorries, 33% trucks and trucks with
trailers and 3% cars with trailers as well as 3% coaches and buses. It should be noted that
there is a significant difference between working days and the weekend as only 2.000 HDV
are counted on Saturday and even less on a Sunday. Based on this data it is estimated that
2,2 million HDV arrived in the main road network of the Port of Hamburg in half a year of 2018.
Figure 7 HDV Population in the Port of Hamburg on an average weekday (HPA, 2019)
An average round trip distance of 10 km is estimated.1 The estimation is based on port area
accesses and exits as well as distances travelled within the port for terminal operations. This
means that a total of 21.46 million vehicle kilometers have been covered by HDV in half a year.
The German Federal Environment Agency assumes a pollution of nearly 815 grams CO2 per
travelled diesel driven HDV vehicle kilometer. No data could be generated regarding the
terminal activities or the number of required starts after vehicle rest. The emission factor
already includes a differentiated traffic composition for the area. Based on the provided data it
can therefore be estimated that in the first half of 2018 around 17.500 tons of CO2 were
produced by HDV in the area of the Port of Hamburg.
1
This assumption is based on statements from relevant stakeholders and was validated by reviewing
the physical layout of the port.
Interreg Europe – PGI05855, Reducing CO2 Emissions in Ports, SMOOTH PORTS | 15 / 724 IDENTIFICATION OF MEASURES
In order to identify potential sources for the reduction of HDV emissions, it is very important to
review existing measures from the Port of Hamburg. Since the port has to be viewed holistically
further developments in different port environments have to be taken into account when
deriving measures by including projects in Hamburg and other ports worldwide. To give a brief
description of the identified measures, they were divided into four categories:
Measures which …
• have already been implemented in the Port of Hamburg and are in regular operation,
• are being tested as pilot projects in the Port of Hamburg,
• are currently being discussed in the Port of Hamburg and
• additional good practices with additional value from other countries and ports.
Figure 8 Summary of the Identified Measures
Although not all of these projects are aimed to reduce CO2 emissions by HDV they directly or
indirectly lead to reduction of emissions produced by HDV. The research was focused on
projects and measures which reduce emissions in port areas in general, but a particular focus
was placed on selected initiatives and individual ports that have been dealing specifically with
the reduction of CO2 emissions by HDV, for example “Heavy-Duty Vehicles” by the
International Council on Clean Transportation, “Ports Initiative” by the United States
Environmental Protection Agency, “Zero Emission Initiatives” by the Port of Los Angeles or the
“Clean Truck Programs” (e. g. Port of Long Beach).
Interreg Europe – PGI05855, Reducing CO2 Emissions in Ports, SMOOTH PORTS | 16 / 724.1 IMPLEMENTED PROJECTS
Implemented Projects describe projects that are currently being used in the operations of the
Port of Hamburg. Although not all of these projects are aimed to reduce CO2 emissions by
HDV they directly or indirectly lead to the reduction of emissions by HDV traffic.
1 Container Taxi
Figure 9 Container Taxi in Port of Hamburg (Eckelmann Group, 2020)
Topic Container transport via waterways
Status Project Start 2004
Details Eckelmann currently uses six barges to transport containers in a
regular service between 8 spots within the port incl. the major
container terminals and empty depots. The barges have a capacity of
60 TEU (twin-use: 120 TEU) and allow the combination of separate
shipments. The barges are operated 24/7 and can be chartered
individually. Other barge operators like Walter Lauk offer similar
services.
Involved Lead Eckelmann Group
Parties
https://www.eckelmann.hamburg/index.php/en/transport-u-
Links
logistics/business-areas/container-taxi
Interreg Europe – PGI05855, Reducing CO2 Emissions in Ports, SMOOTH PORTS | 17 / 722 DIVA
Figure 10 Dynamic parking space management for trucks (Port of Hamburg, 2016)
Topic Digital boards for sharing information regarding congestion and
closings
Status Project Start 2014
Details DIVA, the dynamic information on traffic flow informs road users about
the traffic situation in the port on information boards with graphic and
text displays along the roads and on the HPA website. About 300
detectors record congestions, closures or movable bridges Thus,
disturbances can be displayed comprehensively as basis for
alternative routings. DIVA also provides information on available
parking spaces, distinguishing between small and big trucks. Currently
17 DIVA boards are being operated.
Involved Lead HPA
Parties
Links https://www.hamburg-port-
authority.de/fileadmin/user_upload/Flyer_Verkehrsmanagement_DIVA.pdf
Interreg Europe – PGI05855, Reducing CO2 Emissions in Ports, SMOOTH PORTS | 18 / 723 EVE
Figure 11 The Port Road Management (Hamburg Port Authority, 2014)
Topic Effective traffic situation display based on short-term and medium-
term traffic data
Status Project Start 2014
Since 2017 the interface is linked with the DIVA boards.
Details The HPA traffic management system monitors the roads using
Bluetooth, video detection and induction loops. In 2017 it was
supplemented by a model-based solution for proactive traffic
management which collects, compares, validates, and merges
stationary data in real-time. The model-based approach thus fills the
data gaps in the road network and creates a coherent and
comprehensive picture of the traffic situation. Due to the forecasting
capability HPA can react even more efficiently to disruptions in the
road network and provide traffic information. Separate analysis of car
and truck traffic allows for better parking space management within
the port, a traffic control to/from the terminals via pre-gate parking
spaces as well as dynamic traffic guidance.
Involved Lead HPA
Parties
GeVAS
https://gevas.eu/eve/
Links
https://www.hamburg-port-authority.de/fileadmin/user_upload/140401_HPA_Broschuere_spl_web.pdf
Interreg Europe – PGI05855, Reducing CO2 Emissions in Ports, SMOOTH PORTS | 19 / 724 Myboxplace.de
Figure 12 myboxplace.de - the digital exchange platform for empty containers (DAKOSY, n.d.)
Topic Optimize the transport of empty containers between container
terminals, packing companies and empty depots
Status Project Start 2018 (2016)
In 2016, HPA initiated the project Virtual Depot together with several
partners. The technical implementation was commissioned to IBM. In
2018, the project was transferred to DAKOSY and then integrated
into the myboxplace.de platform, which is used to arrange empty
container transports from seaport terminals to the hinterland/depots.
Details According to HPA more than one million trucks with empty containers
travel in the Port of Hamburg every year. After a full container has
been unpacked at a packing company, it is taken to an empty
container depot. At a later stage, this very same box is often taken
from the empty container depot to the same packing company e. g. for
use in sea export. The aim of myboxplace.de is to provide a platform
for different market players that usually do not communicate directly
to reduce the number of truck journeys in empty container logistics.
Contracts between the different market players are not affected.
Involved Lead DAKOSY
Parties
Link https://www.dakosy.de/loesungen/logistics/intermodal/myboxplacede
Interreg Europe – PGI05855, Reducing CO2 Emissions in Ports, SMOOTH PORTS | 20 / 725 Night Trips
Figure 13 Night Trips in Hamburg (Hamburg Port Authority, 2019)
Topic Shifting traffic to night hours to reduce daytime peaks
Status Project Start 2018
Details CTD as one of major trucking company in the Port of Hamburg
started to shift container traffic between terminals and depots to night
hours to relieve the road infrastructure in the port and reduce the
traffic volume during daytime peak periods. This results in 41 %
(20,500) of all port internal truck transports were carried out in the
period between 6 p.m. and 6 a.m. in 2018. For the trucking company
this ensures a steady utilisation of the vehicle fleet and increased
capacities for the daytime business. In addition, the vehicles are less
likely to be stuck in traffic jams, which makes transport planning
more reliable and at the same ecofriendly.
Involved CTD (HHLA subsidiary)
Parties
Links https://hhla.de/unternehmen/news/detailansicht/nachtfahrten-
entlasten-strassen-und-umwelt
Interreg Europe – PGI05855, Reducing CO2 Emissions in Ports, SMOOTH PORTS | 21 / 726 Smart Area Parking
Figure 14 Guiding Truckers to available spaces in Port of Hamburg (Nedap, n.d.)
Topic Implementation of systems to detect truck parking space
Status Project Start 2016
Details Currently Smart Area parking is implemented on four parking sites
(Aluminiumstraße, Altenwerder Ost, Altenwerder West and Dessauer
Straße). The occupancy rate of the parking sites is transferred
automatically to the PRM, which then displays the capacities on the
DIVA boards. This allows drivers to find free parking spaces more
quickly and avoids unnecessary trips within the port.
Involved HPA
Parties
Links https://www.smartcity-kompass.de/smartcity/smart-area-parking/
https://www.nedapidentification.com/cases/guiding-truckers-in-port-
of-hamburg/
Interreg Europe – PGI05855, Reducing CO2 Emissions in Ports, SMOOTH PORTS | 22 / 727 Smart Maintenance
Figure 15 Smart Maintenance (Smart City Kompass, n.d.)
Topic Using mobile devices to monitor the infrastructure and therefore
improve the maintenance process
Status Project Start 2014
Roll Out 2015
Details Mobiles devices such as tablets and smartphones are used to monitor
and record data about the status of the port’s transport infrastructure
(incl. road and railway) In a first step the project focused on mobile
infrastructures such as lifting or bascule bridges. and bridges. The
solution supports HPA's service teams during on-site maintenance
procedures. The data can automatically be processed and displayed
as alerts, which can draw attention to emerging problems that bear a
potential risk for the traffic flow.
Involved Lead HPA
Parties
CISCO Systems, SAP, Microsoft
Links https://www.smartcity-kompass.de/smartcity/smartmaintenance-
intelligente-instandhaltung/
Interreg Europe – PGI05855, Reducing CO2 Emissions in Ports, SMOOTH PORTS | 23 / 728 Slot Booking Platform
Figure 16 Slot-Booking for truck visits (HHLA, n.d.)
Topic Slot-Booking for truck pick-up and delivery
Status Project Start 2017
Roll Out 2019
Details Since 2017 slot booking is mandatory for container deliveries or
pickups by truck at the four major container terminals. In addition,
three container depots and the Veterinary Office are participating in
the procedure. Trucking companies need to book a time slot (always
comprises one hour e. g. 8 – 9 a.m.) at one of the participating parties
via the truckgate platform in advance. A slot has to be rebooked or
exchanged if the trucker does not show up with a tolerance range of
+/- 1.5 hour. The use of the service is not accompanied by any
expenses for the truck operators.
Involved Lead Terminal Operators
Parties
DAKOSY, Cargo Support
Links https://www.truckgate.de/en
Interreg Europe – PGI05855, Reducing CO2 Emissions in Ports, SMOOTH PORTS | 24 / 729 Truck Guidance System
SAFETY DISTANCE
Figure 17 New Safety Signs (own presentation based on Port of Hamburg, n.d.)
Topic Traffic guidance system to ensure an optimized traffic flow on the
highly frequented Köhlbrandbrücke
Status Project Start 2019
Details Special lane markings on the entire bridge show truck drivers the ideal
distance to the truck in front of them. If the driver always keeps the
distance of two marked triangles, he is optimally guided to the distance
requirements in the middle part of the bridge. The guidance system
should prevent both, unnecessary braking maneuvers, and excessive
distances between the trucks on the two ramps of the bridge and
therefore optimizing traffic flow. The markings are based on shapes
that have successfully been used in the Netherlands and Scandinavia.
Involved HPA
Parties
Links https://www.hamburg-port-authority.de/de/aktuelles-
presse/verkehrsfluss-optimiert-hpa-startet-neues-leitsystem-fuer-lkw-
auf-der-koehlbrandbruecke/
Interreg Europe – PGI05855, Reducing CO2 Emissions in Ports, SMOOTH PORTS | 25 / 724.2 PILOT PHASE AND IN DISCUSSION
This category includes measures that are currently either in the pilot phase or have already
been implemented for other means of transport and are currently being extended to HDV
transports.
10 Cargo 24/7
Figure 18 Truck Loading in the Night (HHLA, 2019)
Topic Truck handling in the port and relevant hinterland around the clock
Status Project Start 2016
Pilot Phase 2019
Details Based on the initiative Port 24/7 which creates the possibility to handle
trucks all day. In a second step, Cargo 24/7 is about integrating
logistics, industrial and trading companies in the hinterland into the
digital slot booking procedure at an early stage - and thus shifting
transports into the low-traffic off-peak hours.
Involved Lead Logistik-Initiative Hamburg
Parties
DAKOSY, HHLA, Eurogate Hamburg, Volkswagen, Cosco Shipping
Lines, Hapag-Lloyd, WEETS Group and Schnellecke
Links https://www.hamburg-port-authority.de/fileadmin/user_upload/port-
development-plan2025.pdf
Interreg Europe – PGI05855, Reducing CO2 Emissions in Ports, SMOOTH PORTS | 26 / 7211 Green4transPORT
Figure 19 Intelligent Traffic Lights (HPA, n. d.)
Topic V2X communication with light signal systems
Status Project Start 2016
Pilot Phase 2019 - 2020
First results will be presented at the ITS Conference 2021.
Details With V2X (vehicle-to-everything) communication between vehicles
and infrastructure HPA is testing a dynamic traffic management.
Therefore, different trucks are grouped, while speed and traffic light
phases are adapted dynamically to the amount of a traffic at any time.
The pilot phase focusses on two traffic lights near Kattwyk Dam and
about 150 trucks. The system can also integrate information from
other transport modes (rail, water) into the analysis to examine the
effects on the flow of intermodal transport. The aim is reduce waiting
times and thereby cut emissions. In the future it is planned to extend
the technology to the main port routes to capture 50% of the traffic
situation via on-board units.
Involved Lead HPA
Parties
NXP Semiconductors Scania CV AB, Siemens Mobility GmbH and
Technolution B.V.
Links https://www.hamburg-port-
authority.de/en/themenseiten/green4transport/
Interreg Europe – PGI05855, Reducing CO2 Emissions in Ports, SMOOTH PORTS | 27 / 7212 Port Monitor
Figure 20 The digital harbor (Hamburg Port Authority, n.d.)
Topic Control room software to keep all stakeholders in the Port of
Hamburg up-to-date
Status Project Start 2012
Roll out 2017
Details The Port Monitor gathers a variety of different information, e. g.
electronic maps, vessel positions, water level data, current
construction sites and bridge heights and widths. It can also be
accessed remotely. The information is collected and evaluated from a
various measurement and communication systems in the port and
displayed in a graphical format. The aim is to provide a comprehensive
overview of the current traffic situation and therefore enable proactive
decision making with regard to traffic management.
Involved Lead: HPA
Parties
Workplace Solutions GmbH and University of Hamburg
Links https://www.hamburg-port-authority.de/en/hpa-360/smartport/
Interreg Europe – PGI05855, Reducing CO2 Emissions in Ports, SMOOTH PORTS | 28 / 7213 TruckPilot
Figure 21 Driverless vehicles at the container terminal (HHLA, 2020)
Topic Fully automated and autonomous terminal trucking
Status Project Start 2018
Testing June 2020, on the MAN premises in Munich
July – December 2020
Two trucks are tested at HHLA Container Terminal Altenwerder.
Details The plan is to completely automate the truck loading and unloading
procedure at container terminals to increase process efficiency and
stability, and support truck drivers in their daily routine. The traffic flow
on the terminal premises can be positively influenced by automation,
which also offers potential for reducing fuel consumption. Additionally,
a proactive driving style can help to reduce safety risks.
Involved Lead Free and Hanseatic City of Hamburg and MAN
Parties
HHLA
Links https://www.truck.man.eu/de/en/man-world/man-in-germany/press-
and-media/MAN-and-HHLA-launch-_Hamburg-TruckPilot_-to-test-
automated-and-autonomously-driving-trucks--345920.html
Interreg Europe – PGI05855, Reducing CO2 Emissions in Ports, SMOOTH PORTS | 29 / 7214 Traffic Light Forecast
Figure 22 "Green wave" with traffic light assistant for cyclist (City of Hamburg, 2020)
Topic Predicting driving patterns to smoothen traffic and reduce delays
Status Project Start 2015
Testing 2017
Details With its real-time data, the project is intended to contribute to
anticipatory driving in the city of Hamburg. The results as well as the
collected data of the pilot project will be available to the public.
Since 2017, 70 traffic lights have been tested in Hamburg city center.
The mobile app uses the collected data to recommend to the driver
the optimal speed to get through the traffic without stop and go.
Involved Lead German Federal Ministry of Transport and
Parties
Digital Infrastructure
State Office for Roads, Bridges and Waters, State Office for
Geographical Information and Surveying, Hamburg Traffic Systems
GmbH and Cisco Systems
Links https://www.smartcity-kompass.de/smartcity/pilotversuch-ampelassistent-
traffic-light-forecast/
Interreg Europe – PGI05855, Reducing CO2 Emissions in Ports, SMOOTH PORTS | 30 / 724.3 IN DISCUSSION
Measures in this category have already been reviewed for the Port of Hamburg or are currently
still in discussion in various committees and/or authorities on regional and national level. These
measures have not been tested yet and practical implementation plans do not exist.
15 Border One Stop Shop
Figure 23 The Port of Hamburg as a European sea customs port (Port of Hamburg, n.d.)
Topic Relocating the border inspections for incoming goods
Status Project Start 2019
Feasibility Study completed in 2020
Details The idea is to combine veterinary, food control and phytosanitary
import controls with customs controls at one single location to make
the necessary inspection activities more customer friendly. The aim is
to identify synergies between the different parties, become more cost-
effective and lower emissions by reducing the number of truck
journeys. Along with the physical consolidation, a significant number
of port-internal transports could already be avoided through
digitalization of processes and optimized IT interfaces.
Involved Lead General Customs Directorate
Parties
Federal Agency for Agriculture and Food, Hamburg Ministry of
Justice and Consumer Protection and BWI
Links https://www.bdz.eu/fileadmin/dokumente/Bezirksverbaende
/BV_Nord/BV_Nord_Medien/BV_Nord_Info/OV_HZA_
Hamburg_aktuell_1_20_BOSS.pdf
Interreg Europe – PGI05855, Reducing CO2 Emissions in Ports, SMOOTH PORTS | 31 / 7216 PortHUB LCL
Figure 24 Container Hub (Logisitik Watchblog, 2020)
Topic Optimization and digitization of bundling of LCL cargo
Status Project Start 2019
Testing 2020 – 2021
Details To avoid unnecessary traffic, the delivery and collection of LCL goods
can be optimized and the corresponding processes digitized. For this
purpose, a physical and digital HUB could be established where freight
can be bundled in the port. The platform should be connected to
existing interfaces in order to be able to react dynamically to changes
e. g. customs clearance.
Involved Lead Association of Hamburg Forwarders e. V.
Parties
LIHH, HPA and DAKOSY
Link https://www.hamburg-
logistik.net/fileadmin/user_upload/aktivitaeten/projekte/its/Projektsteckbriefe/200416_HafenHUB_kb.pdf
Interreg Europe – PGI05855, Reducing CO2 Emissions in Ports, SMOOTH PORTS | 32 / 724.4 GOOD PRACTICES
Good practices describe approaches that are currently being pursued in other ports and other
countries. The measures listed are all already in the pilot phase or are being implemented in
various places.
17 Automated Container Scanning, Port of Rotterdam (NL)
Figure 25 Mobile OCR (Port Technology, 2018)
Topic Identification system that scans incoming trucks for registration
details
Status Pilot Phase 2018
Details All arriving and departing trucks are scanned to record registration
plate, container number, iso code as well as damage, and container
weight. This way the entire gate process can be optimized as manual
checks are reduced while performance and security are potentially
increased.
Involved Lead Port of Rotterdam
Parties
Barge Terminal Tilburg and Certus Port Automation
Links https://www.porttechnology.org/news/rotterdam_pilots
_new_container_scanning_system/
Interreg Europe – PGI05855, Reducing CO2 Emissions in Ports, SMOOTH PORTS | 33 / 7218 Clean Truck Program, Port of Los Angeles (US)
Figure 26 Clean Truck Program in Los Angeles (Port of Los Angeles, n.d.)
Topic Strategic program to reduce truck emissions
Status Project Start 2008
Details As part of the Clean Air Action Plan the Clean Truck Program is an
initiative that deals with the strategic orientation of the ports regarding
truck emissions. Various measures are being developed and
established to reduce the heavy environmental pollution caused by
trucks. The measures include banning HDV which did not meet the
2007 emission standards. Currently only new trucks produced after
2014 are allowed in the port area and trucks with alternative drive and
fuel systems are being funded.
Workshops involve the various stakeholders and reports ensure that
measurable success can be identified. Several ports have introduced
similar programs to take strategic action against truck emissions.
Involved Lead Port of Long Beach and Port of Los Angeles
Parties
Link https://cleanairactionplan.org/strategies/trucks/
Interreg Europe – PGI05855, Reducing CO2 Emissions in Ports, SMOOTH PORTS | 34 / 7219 Concession Review Program, Port of Los Angeles (US)
Figure 27 San Pedro Bay Ports Clean Air Action Plan (The Port of Los Angeles, n.d.)
Topic Mandatory concession agreement for trucks in the port area
Status Project Start 2008
Details At the Port of Los Angeles, it is mandatory for over 900 licensed motor
carriers to have a pending or approved concession agreement. This
allows to track emissions standards, compliances with vehicle safety
and maintenance standards as well as safety training for drivers,
which are then periodically published.
Involved Lead Port of Los Angeles
Parties
Links https://www.portoflosangeles.org/environment/air-quality/clean-truck-
program
https://kentico.portoflosangeles.org/getmedia/452bad8c-4e16-490f-
bab6-155b061866bb/POLA-Monthly-Gate-Move-Analysis
Interreg Europe – PGI05855, Reducing CO2 Emissions in Ports, SMOOTH PORTS | 35 / 7220 Driver Training, Port of Vancouver (CA)
Figure 28 The Valley Driving School in Canada (Valley Driving School, 2017)
Topic Policy to reduce idle operations and promote intelligent driving
Status Start 2016
Details The Port of Vancouver supports the trucking companies in training
their drivers for sustainable driving. The aim is to ensure that the Anti
Idling Campagin is also lived by the drivers.
Involved Lead Port of Vancouver
Parties
Link https://www.portvancouver.com/wp-content/uploads/2015/07/2017-
03-08-NRDE-Fact-Sheet-Fuel-Efficiency-Plans-and-Idle-Reduction-
Policy.pdf
Interreg Europe – PGI05855, Reducing CO2 Emissions in Ports, SMOOTH PORTS | 36 / 7221 Idle Reduction Policies, Port of Vancouver (CA)
Figure 29 Idle Free in BC (BC Climate Action Toolkit, n.d.)
Topic Policy to reduce idle operations
Status Start 2015
Details The purpose of the policy is to establish guidelines for unnecessary
idling of vehicles and other road equipments in the port area. Limiting
idling times contributes to a healthier work environment, reduces noise
as well as air pollution, reduces fuel consumption and extends the
lifespan of the engine. Through the Truck Licensing System and the
Smart Fleet Strategy, approx. 1,800 container trucks are tracked
through GPS signals after entering the port and thus can be observed
according to policy measures.
Involved Lead Port of Vancouver
Parties
Link https://www.portvancouver.com/wp-content/uploads/2015/07/2017-
03-08-NRDE-Fact-Sheet-Fuel-Efficiency-Plans-and-Idle-Reduction-
Policy.pdf
https://www.portvancouver.com/environment/air-energy-climate-
action/container-trucking/
Interreg Europe – PGI05855, Reducing CO2 Emissions in Ports, SMOOTH PORTS | 37 / 7222 ECOCALCULATOR, Port de Barcelona (ES)
Figure 30 The Ecocalculator (Port de Barcelona, n.d.)
Topic Software to inform about emissions for different transport modes
Status Project Start 2012
Roll Out 2015
Details The Port of Barcelona provides a tool that calculates the number of
tons of greenhouse gases generated in specific logistics chains for
each transported TEU based on a chosen set of parameters. Users
can get a transparent and comprehensive overview, and compare the
results provided by the web-based solution for different transport
modes and routings. Additionally, the software proposes tailored
alternatives with reduced emissions.
Involved Lead Port de Barcelona
Parties
Technical University of Catalonia (BarcelonaTech) and Port de
Barcelona Logistics Consultancy
Link http://planol.portdebarcelona.cat/ecocalc/index.html?idioma=2
Interreg Europe – PGI05855, Reducing CO2 Emissions in Ports, SMOOTH PORTS | 38 / 7223 Emissions Inventory, Port of New York and New Jersey (US)
Figure 31 The Port Authority of NY & NJ (Port Authority NY NJ, 2020)
Topic Annual report for port related emissions
Status Project Start 2006
Details The Port Authority of New York and New Jersey provides a yearly
emissions inventories concentrating on different air polluting
emissions. A detailed reporting of emissions ejected by cargo handling
equipment, heavy-duty diesel vehicles, railroad locomotives and
commercial marine vessels is published to ensure transparency
between stakeholders. By measuring their produced emissions, it is
easier to ensure that goals are met and identify necessary next steps.
Involved Lead Port Authority of New York and New Jersey
Parties
Links https://old.panynj.gov/about/pdf/PANYNJ-2017-Multi-Facility-EI-
Report.pdf
https://www.panynj.gov/port/en/our-port/sustainability/air-emissions-
inventories-and-related-studies.html
Interreg Europe – PGI05855, Reducing CO2 Emissions in Ports, SMOOTH PORTS | 39 / 7224 Free Tyre Check, Port of Rotterdam (NL)
Figure 32 A green smiley for more safety (Presse Box, n.d.)
Topic Offering a free tyre check at two locations within the port
Status Project Start 2015
Details The Port of Rotterdam promotes safe and clean driving by installing
an automatic measuring point for air pressure of truck tyres on a
bridge within the port area. The check area can be accessed free of
charge via a separate lane and takes one minute only. With the
optimal tyre pressure fuel consumption and emissions decrease
plus the safety risk can be reduced.
Involved Lead Port of Rotterdam
Parties
https://www.portofrotterdam.com/sites/default/files/hbr_folder_bandenspanning_mei_2017.pdf?token=FQeLz24M
Links
Interreg Europe – PGI05855, Reducing CO2 Emissions in Ports, SMOOTH PORTS | 40 / 7225 PORTOLOG, Port of Santos (BR)
Figure 33 Portolog (Santos Port Authorithy, n.d.)
Topic Fully monitored arrivals of trucks and cargo
Status Project Start 2015
Roll Out 2017
Details PORTOLOG notices each truck that is loaded and envisaged for the
port. The system puts all trucks and cargo in a virtual queue and every
time a checkpoint is passed the system receives a signal to notify the
predetermined terminal in the port. Currently it is focused on the port’s
public areas, terminals, and yards. But it will be extended to all main
road corridors in Brasil.
Involved Lead Federal Data Processing Service
Parties
Port of Santos, Terminal Operators
Link https://www.portodesantos.com.br/operacoes-logisticas/portolog-
sgtc/
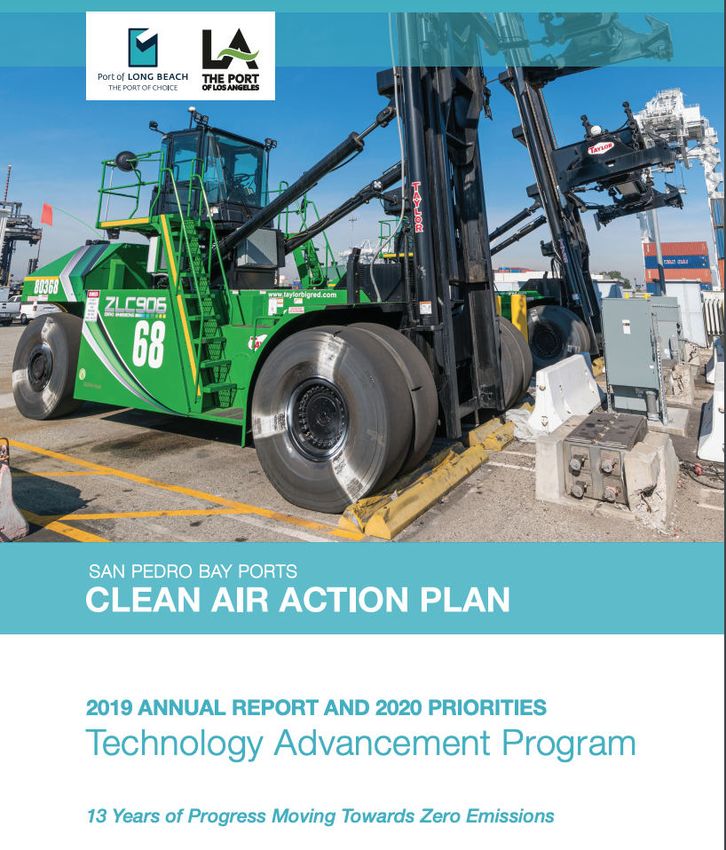
Interreg Europe – PGI05855, Reducing CO2 Emissions in Ports, SMOOTH PORTS | 41 / 7226 Technology Advancement Program, San Pedro Bay Ports (US)
Figure 34 Front page of the annual Technology Advancement Program Report (Ports, 2019)
Topic Promoting alternative fuels and developing technologies by
supporting change
Status Project Start 2007
Details The Technology Advancement Program is an initiative that focusses
on supporting clean technologies and the associated infrastructure
within the San Pedro Bay port area. Several approaches are
considered to identify and support potential projects. An Open
Request for Information (RFI) is now available where a proposer may
upload and submit a concept paper through an online portal at any
time. Other approaches may include Requests for Proposals (RFP)
and Port-Initiated Projects to encourage technology development or if
there are multiple interests in demonstrating a certain technology.
Involved Lead Port of Long Beach and Port of Los Angeles
Parties
Links https://cleanairactionplan.org/technology-advancement-program/
Interreg Europe – PGI05855, Reducing CO2 Emissions in Ports, SMOOTH PORTS | 42 / 7227 Truck Positioning Guidance, Duisport (DE)
Figure 35 The Integrated Truck Guidance (Duisport, n.d.)
Topic Truck guidance system to ensure an optimized traffic flow prior to the
port area
Status Pilot Phase 2020
Details Based on GPS tracking and a mobile app, which can be downloaded
by truck drivers, all participating parties can be informed about the
estimated time of arrival at the envisaged terminal. The truck is
assigned to the next possible slot. If an immediate slot is not available
– resulting in a delay – the app automatically informs the driver about
available parking spaces within the port area and the driver is
assigned a new destination slot. The aim is to reduce waiting times
and minimize congestions within the port area.
Involved Lead Duisport
Parties
Siemens
Link https://www.duisport.de/hafeninformation/strassenservice-leitsystem/
https://assets.new.siemens.com/siemens/assets/api/uuid:
4ff11208c253329e15b284d809991b12c1aa5d34/version:
1500550767/brochure-integrated-truck-guidance-en.pdf
Interreg Europe – PGI05855, Reducing CO2 Emissions in Ports, SMOOTH PORTS | 43 / 725 ANALYSIS OF MEASURES
In order to recommend a course of action for the Port of Hamburg while ensuring a certain
degree of transformability for other ports, different measures working towards the same goals
were combined into twelve clusters. In particular, the selection of established measures in the
Port of Hamburg in combination with international good practices were taken into account. This
approach helps to build on existing regional achievements while ensuring that the broadest
possible overview can be given in terms of transferability for other ports. Some measures are
relevant for different clusters, those appear twice in the overview. To reduce complexity the
clusters and belonging measures are grouped into four categories:
Figure 36 Classification of measures into categories and clusters
The subsequent derivation of the clusters is carried out with the objection that the measures
developed in the previous section are described in more detail and examined with regard to
their requirements. In order to determine the effect and therefore being able to recommend
further action, each cluster is assessed according to three aspects:
Interreg Europe – PGI05855, Reducing CO2 Emissions in Ports, SMOOTH PORTS | 44 / 72• Impact refers to the assessment of the possible successes that can be achieved by
establishing the cluster. These can be measured in different ways: The direct impact
described the achieved effect in terms of CO2 emissions reductions for example
caused due to traffic shift or traffic avoidance. The indirect impact can give information
on further potentials arising from the establishment of the cluster for example in terms
of the improved utilization of the given infrastructure, creating awareness for emissions
or building the basis for other clusters.
• Effort refers to the estimated contribution that is required for the implementation of the
cluster. This can involve various aspects such as time horizon, number of stakeholders
to be involved, necessary technical requirements, data collection and availability, and
financial needs.
• Potential for the Port of Hamburg describes the compatibility as well as applicability
to the conditions in Hamburg. Therefore, reference is made to the available data for the
current traffic situation, infrastructure, and general conditions within the port and
preliminary projects that potentially can be used as starting point.
To ensure transferability to other port locations the first two aspects Impact and Effort are
analyzed as broadly as possible while the third category explicitly focuses on the regional
potential for the Port of Hamburg.
Interreg Europe – PGI05855, Reducing CO2 Emissions in Ports, SMOOTH PORTS | 45 / 725.1 STRATEGY
Although the implementation of strategies and concepts does not reduce emissions directly for
example by avoiding traffic, it can have an immense impact on a sustainable port-wide
emissions reduction as it can form an encompassing directional guide for all means of
transport.
1. Emissions Reduction Strategy
Impact: An emissions reduction strategy does not reduce emissions itself, but it can create
the basis to develop further steps and policies. The purpose of an emissions inventory is to
report and explain generated air emissions associated with specific GHG emissions. It can for
instance enable a port authority as well as other relevant stakeholders to identify possible weak
points in a long-term perspective and track progress towards emission reduction targets.
Additionally, it can be used as a basis of argumentation or strategic foundation for possible
useful or needed investments. In this context, it is especially important to increase the
transparency and ensure comparability of the caused emissions by the different involved
parties. This cluster can also be used to increase the awareness of the various stakeholders
regarding the amount of emissions produced in different processes.
Effort: The effort is estimated as rather high, since many different stakeholders have to be
cross-linked and a large amount of information and data has to be gathered. For a diligent
emissions inventory the data collection processes must be refined to ensure a precise
monitoring and reporting throughout the entire process. As there are already many scientific
methodology reports (e. g. Port Emissions Inventory and Reduction Strategy by the United
States Environmental Protection Agency, Task Force on Emission Inventories and Projections,
European Environment Agency) and good practices (e. g. Port of London, Port of Oakland,
Port of Seattle) on how to design an emissions inventory the effort could be reduced. The
recording as well as the analysis have to follow a continuous approach. Many of the existing
emissions inventories provide either yearly revisions or time frames between three to five
years. A regular and minimum annual revision seems to be sufficient to flexibly follow up on
changes and adapt measures accordingly.
Potential for Hamburg: The potential for the Port of Hamburg is considered to be very high
while the effort can be kept relatively low, as the existing sustainability report by the HPA
already provides a base. Major stakeholders in the port also publish own sustainability reports,
but a methodological comparison of the collected data would be required. The different reports
and the underlying data can be used to reduce the efforts for the different emission producers.
Interreg Europe – PGI05855, Reducing CO2 Emissions in Ports, SMOOTH PORTS | 46 / 72You can also read