Refinancing behaviour by homeowners in Denmark when mortgage rates rise
←
→
Page content transcription
If your browser does not render page correctly, please read the page content below
2 FEBRUARY 2023 — NO. 2

Refinancing behaviour by
homeowners in Denmark
when mortgage rates rise

Henrik Yde Andersen Erik Grenestam The viewpoints and conclusions stated are the responsibility
Principal Economist Senior Data Scientist of the individual contributors and do not necessarily reflect
 the views of Danmarks Nationalbank.
ECONOMICS AND MONETARY FINANCIAL STABILITY
POLICY
 egr@nationalbanken.dk
hya@nationalbanken.dk

Marcus Bjerregaard Læssøe Alexander Meldgaard Otte
Senior Economist Senior Economist
FINANCIAL STATISTICS ECONOMICS AND MONETARY
 POLICY
mbls@nationalbanken.dk
 almo@nationalbanken.dk
Sigurd Anders Muus Steffensen
Economist
ECONOMICS AND MONETARY
POLICY

sams@nationalbanken.dk
ECONOMIC MEMO — DANMARKS NATIONALBANK
2 FEBRUARY 2023 — NO. 2

Refinancing behaviour by homeowners in
Denmark when mortgage rates rise

Abstract Introduction

Rising mortgage rates have led to one The Danish 30-year fixed-rate mortgage rate has
in five Danish fixed-rate mortgages to increased by approx. 4 percentage points during
be refinanced during the first three 2022. This represents the largest rate surge in 40
quarters of 2022. The unique Danish years and a strong contrast to the general decline in
match-funding principle has allowed yields following the global financial crisis, cf. chart 1
fixed rate mortgage borrowers to buy (left). These developments are expected to reduce
back their existing mortgages at a 18 home prices and economic activity, but particular

per cent discount, on average. features of the Danish mortgage system may
 attenuate the contractionary effects of higher interest
 rates on private consumption and housing
62 per cent of the realised net wealth
 investments in Denmark.
gain has been used to reduce
mortgage and bank debt, while 38 per
 The Danish mortgage framework resembles the US
cent was cashed out. The cash-out
 by having a large share of fixed-rate callable
share is higher for borrowers with mortgages. However, fixed-rate mortgages in
lower levels of wealth, indicating that Denmark are also issued under the match-funding
cash outs may be used to support principle, implying that the market value of the
consumption now or as precautionary individual loan is directly linked to the market value
savings. of the underlying fixed-rate mortgage bond.
 Consequently, net wealth of existing fixed-rate
Four in ten refinancers switched from mortgage borrowers increases as mortgage rates
fixed to adjustable-rate mortgages. rise.
When combined with cashing out,
homeowners become more sensitive To realise this net wealth gain, fixed-rate mortgage
to adverse developments in interest borrowers can prepay their mortgage at market

rates and house prices. Nonetheless, value at any point in time prior to maturity. By the
 end of 2022, some Danish mortgage bonds traded
most refinancers remain robust even
 below a price of 70, cf. chart 1 (right), meaning that
in severe scenarios.
 these particular borrowers could cut their
 outstanding mortgage debt by more than 30 per
 cent by refinancing their fixed-rate mortgage.1 For
 the rest of this memo, we refer to this realised net
 wealth gain simply as the ‘net wealth gain’.

1
 Refinancing into a new fixed-rate mortgage implies that the borrower the future. Calling the option means that the borrower prepays the
 pays a higher interest rate on a now lower outstanding mortgage debt. mortgage at par to lock in a lower interest rate on a new mortgage,
 This higher interest rate includes a sizeable premium for a call option while the outstanding debt remains almost unchanged when
 that can be exercised by the borrower should the market rates fall in abstracting from transaction costs.

 2
ECONOMIC MEMO — DANMARKS NATIONALBANK
2 FEBRUARY 2023 — NO. 2

 Higher interest rates drive down bond prices on long-term fixed-rate mortgage bonds Chart 1

 Per cent Market price
 9 100
 2'53
 8 1.5'53
 7 90
 6

 5
 80
 4

 3
 70
 2 1'53
 1 0.5'53
 0 60
 00 02 04 06 08 10 12 14 16 18 20 22 jan 22 apr 22 jul 22 okt 22 jan 23

 Note: Average effective 30-year mortgage rate (left) and bond prices on Nykredit fixed-rate mortgage bonds with different coupon rates.
 Vertical dashed lines on the left-hand panel marks the time period shown for the right-hand panel.
 Source: Finans Danmark, Refinitiv Eikon and own calculations.

This study uses micro-level data to describe the used to reduce mortgage debt, 20.5 per cent was
refinancing behaviour of Danish households who used to reduce debt in commercial banks, while the
refinanced their fixed-rate mortgage during the first remaining 37.9 per cent was extracted as cash to be
three quarters of 2022, a period of rapid rate used for consumption or savings. The share of the
increases. In addition, we point to possible motives net wealth gain extracted as cash is larger among
behind mortgage refinancing when mortgage rates homeowners with limited liquid wealth prior to
rise and quantify their relative importance. refinancing. This may indicate that the cash
 extractors are already liquidity constrained or expect
From January to September 2022, Danish to be so in the near future, and cash extraction can
homeowners have refinanced 30-year fixed-rate therefore support their consumption over the
mortgages by an amount that corresponds to about coming years.
21 per cent of all outstanding fixed-rate mortgages in
Denmark and 10 per cent of all outstanding Moreover, we find that four out of ten refinancers
mortgages. This high refinancing activity follows a used the buyback as an opportunity to switch from
period where many homeowners have obtained low fixed to adjustable-rate mortgages. Households
coupon mortgages with high duration. Rising rates refinancing early in 2022 faced relatively low short-
have led to an average bond buyback price of kr. 82 term rates, e.g. floating, three, and five years, which
per kr. 100 of notional debt, resulting in a net wealth could have served to make adjustable-rate
gain that corresponds to 18 per cent of their existing mortgages more attractive. On average, households
mortgage debt. The realised net wealth gain was, switching to adjustable-rate saw their interest rate
however, smaller because of transaction costs and initially decline by 0.25 percentage points. However,
fees. In total, our data shows that existing fixed-rate as the short-term rates started to increase later in
mortgage borrowers have realised a net wealth gain 2022, most refinancing households now face higher
by kr. 28 billion in connection to the buybacks in this debt service costs.
period.

Our empirical analysis indicates that 41.6 per cent of Households who extracted their net wealth gain as

the net wealth generated through refinancing was cash faced, on average, higher loan-to-value (LTV)

 3
ECONOMIC MEMO — DANMARKS NATIONALBANK
2 FEBRUARY 2023 — NO. 2

and debt-service-to-income (DSTI) ratios after
 Buybacks of callable mortgage Chart 2
refinancing. However, our results indicate that the bonds have increased significantly
average household is robust to adverse
developments. In fact, some households will likely kr. Billion
 500
fare better in a stress scenario because of lower
leverage and more favourable debt composition 400
 Q4
after refinancing. The share of refinanced loans Other buybacks
 300
characterised as vulnerable (LTV > 100 and DSTI > 40) Refinancing

is well below five per cent even when we expose Total buybacks
 200
them to a scenario of increased interest rates and Q1 - Q3

falling house prices. At-risk debt among refinancing 100

households amount to about kr. 3 billion in our most
 0
severe scenario. Our interpretation is that risks 2019 2020 2021 2022

associated with the high-levels of refinancing activity
in 2022 are relatively contained. Note: The chart displays the total notional value of bought
 back mortgage bonds. In this memo, we focus on
 household mortgages that were refinanced during the
The rest of the memo is structured in the following 1st to 3rd quarter of 2022 (blue bar). Data from the
 4th quarter is preliminary. ´Other buybacks´ include
way: Part 1 provides an overview of mortgage firm refinancing and prepayments due to home
refinancing in Denmark in 2022. Part 2 examines the transactions, extraordinary amortisations etc.
 Source: Scanrate Rio and Nationalbanken.
various types of refinancers in terms of how their
realised net wealth gains are allocated between debt
reduction and liquidity extraction, and discusses
possible motives for households’ refinancing choices. their contractual right to prepay their mortgages at
Part 3 evaluates the impact of refinancing for par, allowing them to lock in a lower fixed-rate on
households’ financial resilience to adverse economic their mortgage.2
developments.
 Access to credit register data enables analysis
 Loan level quarterly data from the Danish credit
Refinancing behaviour in the Danish
 register that covers the first three quarters of 2022
housing market
 allows us to observe all refinancing activity in
 Denmark. This provides a unique view into
Significant increase in buybacks following sudden refinancing behaviour of the individual households.
rise in mortgage rates during 2022 Appendix 1 provides detailed information on how
The sudden increase in long-term interest rates fixed-rate mortgage refinancing is identified in our
during 2022 has reduced the market value of data as well as our sample restrictions.
outstanding mortgages and subsequently given rise
to high bond buyback activity in Denmark, cf. chart 2. The decision to refinance during rising interest rates

Between the 1st and 3rd quarters of 2022, is complex and subject to expectations about the

households refinanced long-term fixed-rate future as well as household circumstances. In

mortgages for a nominal value of kr. 173 billion, appendix 2, we present a model for predicting

corresponding to about one in five of all outstanding refinancing and which observable characteristics best

fixed-rate mortgages. Over the past ten years, Danish explain a household decision to refinance. However,

mortgage borrowers have multiple times exercised

2
 See for example Mortgage refinancing supports private consumption,
 Danmarks Nationalbank Analyse, No. 17, September, 2019.

 4
ECONOMIC MEMO — DANMARKS NATIONALBANK
2 FEBRUARY 2023 — NO. 2

 Illustration of changes to household liabilities under different refinancing allocations Chart 3

 Note: The chart is an illustration that shows three possible uses of net wealth gains from refinancing. In this simplified example, the household
 has a nominal mortgage debt of kr. 1,000,000 and a bank loan of kr. 400,000. Due to rising interest rates, the market value of the
 underlying mortgage bond has fallen to 700,000, leaving the household with a potential capital gain from refinancing of kr. 300,000.

our main analysis focuses on the set of households The third scenario is similar in spirit to the second
that did refinance in 2022. scenario in that homeowners take out a new
 mortgage that is larger than the market value of their
Chart 3 illustrates stylised accounts of three possible existing mortgage. However, they use the proceeds
ways to use the net wealth gain from refinancing that to pay down non-mortgage debt. This debt includes
we can identify using micro data. As we will show, both collateralised loans, e.g. secondary mortgage
need not strictly adhere to either of the three, but debt, as well as uncollateralised bank debt. The
are free to combine different uses. change in total debt is identical in the first and third
 scenario, but the resulting composition between
In the first scenario, households refinance in order to
 debt to mortgage banks and debt to commercial
reduce their nominal mortgage debt. The decline in
 banks is different. As bank debt typically carries a
the market value of their current mortgage allows
 higher interest rate, the household can potentially
them to buy back the underlying mortgage bond at a
 lower their debt service bill.
discount financed by taking out a new mortgage. The
principal debt on the new mortgage is lower (as it is
 Net wealth gains are primarily used to reduce debt
equivalent to the market value of the old loan), but it
 The net wealth generated from refinancing fixed-rate
carries a higher interest rate. In this scenario, the
 mortgages during the first three quarters in 2022
mortgage refinancing has no effect on liquidity for
 amounted to kr. 28 billion, cf. chart 4. From this gain,
the borrower.
 62 per cent was subsequently used to reduce total
 debt. More specifically, the net reduction in
In the second scenario, the household chooses to
 mortgage debt amounted to kr. 11.6 billion and
take up a new mortgage with a principal that is
 another kr. 5.7 billion was used to reduce debt to
larger than the market value of the old mortgage.
 commercial banks. The remaining kr. 10.6 billion was
The difference comes in the form of cash extraction
which can be used for consumption or savings.

 5
ECONOMIC MEMO — DANMARKS NATIONALBANK
2 FEBRUARY 2023 — NO. 2

used for immediate consumption or they were saved
 Buybacks may support private Chart 4
in savings accounts. consumption opportunities
 through home equity
Precautionary savings motives may play a role for extractions

household behaviour during 2022. House prices have
 Kr. billion
started to decline over the course of the year and 30

consumer sentiments hit record lows in late 2022. 25
The immediate stimulating effect of mortgage
 20
refinancing on private consumption will inherently be
 15
weaker if the precautionary savings motive is
 10
stronger. Specifically, refinancing homeowners can
store the extracted liquidity on deposit accounts to 5

support spending in the near-term future or invest in 0
 Realized Reduction in Reduction in Liquidity for
financial asset or pension accounts to support capital gain mortgage debt bank debt consumption
 or savings
spending in the longer term.
 Note: The chart shows the usage of realized capital gains net
 fees from refinancing split into debt reduction and
Some of the mortgage refinancing in our data may liquidity extraction purposes.
 Source: Danmarks Nationalbank.
also have taken place even without the rise in
mortgage rates, as Danish households had ample
home equity available, particularly following the rise
in house prices during the covid-19 pandemic. In outstanding notional debt when refinancing. The
case many households in our sample were planning median debt reduction was 10 per cent of the initial
to extract home equity even before they learned that debt. This also implies that less than one in five
mortgage rates increased, a part if the kr. 10.6 billion refinancing households increased their notional debt
extracted cash that we find would have stimulated (blue area > 0 per cent).
the economy no matter how mortgage rates
developed during this period. However, we impose
sample restrictions that aim to exclude refinancings Most households do not extract liquidity
that would have occurred regardless of interest rate As refinancing households could both reduce debt
developments from our main sample (see appendix and extract home equity at the same time, we turn to
1). measuring how much liquidity is generated.
 Specifically, we take the net wealth gain realised by
Significant differences in households' debt changes each borrower who refinances their mortgage and
There is significant heterogeniety across subtract the change in their total debt. The resulting
homeowners in terms of how their debt changes number is their equity extraction, and the yellow
when refinancing. Some households extract large histogram in chart 5 (right) shows the distribution of
amounts of liquidity, while others obtain a new this measure.
mortgage at more or less the same size as the market
value of their original mortgage, thus not extracting
any home equity. Finally, a few pay down their debt
extraordinarily using already accumulated assets.

The blue histogram in chart 5 (left) displays the
change in total debt of all households in the sample,
including both mortgage and bank debt. More than
eight out of ten homeowners reduce their

 6
ECONOMIC MEMO — DANMARKS NATIONALBANK
2 FEBRUARY 2023 — NO. 2

 Refinancing has generally contributed to lower debt for the majority of Chart 5
 households, but a significant fraction has extracted liquidity

 Pct. of refinancing Pct. of refinancing
 6 12

 5 10

 4 8
 Change in liquidity for
 Change in mortgage and
 consumption and
 bank debt 6
 3 savings

 2 4

 1 2

 0 0
 -30 -25 -20 -15 -10 -5 0 5 10 15 20 25 30 -30 -25 -20 -15 -10 -5 0 5 10 15 20 25 30

 Pct. of initial debt Pct. of initial debt

 Note: The left panel show the distribution of changes in the total nominal value of debt following refinancing as a per cent of initial debt. The
 right panel shows the corresponding distribution of liquidity extraction for consumption and savings.
 Source: Danmarks Nationalbank.

Slightly more than 60 per cent of the sample lies with adjustable rate, while 60 per cent took out a
within a five-percentage-point interval around zero, new fixed-rate mortgage.3
meaning that they essentially just replace their
existing fixed-rate mortgage with a new mortgage of Chart 6 (left) shows the change in effective interest

similar size +/- 5 per cent. One third of the sample rates, excl. administrative fees, following refinancing.

did, however, extract home equity. The extracted The purple distribution depicts homeowners who

amounts varied substantially, in some cases up to 30 decided to take out a new fixed-rate mortgage and

per cent of the initial debt. Negative values indicate the blue distribution shows homeowners who

that borrowers repaid additional debt on top of what switched to an adjustable-rate mortgage. For the

can be explained by the net wealth gain that was majority of homeowners who opted for a fixed-rate

realised by mortgage refinancing. This implies that mortgage, the distribution tends to bunch around

these borrowers must have drawn down bank integers and half-integers consistent with the coupon

deposits or other sources of savings to repay rates that fixed-rate mortgage bonds are typically

additional debt. Around 5 per cent of refinancing issued with in Denmark. For homeowners that switch

households did this. to adjustable-rate mortgages there is an average
 initial reduction in interest rate of 25 basis points.

Four in ten refinancers switched from fixed to This distribution of effective interest rate changes for

adjustable-rate mortgages people switching to adjustable-rate mortgages is

Homeowners can switch to an adjustable-rate quite wide as it depends on the interest rate fixation

mortgage when refinancing if they are eligible period chosen by the household. These are typically

according to applicable lending policies. About 40 between six months and five years.

per cent of refinancers switched to a new mortgage

3
 The choice of variable rate mortgage is in Denmark tightly linked to the sample have also chosen adjustbale-rate mortgages with deferred
 slope of the yield curve. During the first quarters of 2022, an especially amortisation. This loan type is considered particularly risky for financial
 steep yield curve has incentivised many homeowners to exchange their stability, see Det Systemiske Risikoråd, Øget udbredelse af lån med
 fixed rate to an adjustable-rate mortgage in connection to the variabel rente og afdragsfrihed bidrager til risikoopbygning,
 buyback. See Stigende renter og priser kan udfordre bankernes kunder, Observation, 27. september 2022.
 Danmarks Nationalbank Analyse (2022). A number of households in our

 7
ECONOMIC MEMO — DANMARKS NATIONALBANK
2 FEBRUARY 2023 — NO. 2

 Interest rates on the new mortgage impact household budgets Chart 6

 Note: The left panel shows the distribution of changes to the effective mortgage interest rate for refinancing households before and after
 refinancing. The right panel shows the distribution of changes to household DSTI before and after refinancing.
 Source: Danmarks Nationalbank.

In order to capture the impact of changing debt reduction, bank debt reduction or liquidity extraction
service payments on household budgets, we over opting for a mixed allocation.
compute the DSTI ratio for each borrower before and
after refinancing. Borrowers who remained in fixed- We implement an allocation measure for how each

rate mortgages incurred a higher interest rate as borrower predominantly used the realised net wealth

shown in chart 6 (right), but the change in their DSTI gain. This will help us understand their motives for

was limited. This is because the higher rate is in many refinancing and assess the financial risk exposure

cases offset by a smaller mortgage principal after connected to their financial situation after

refinancing. The wide distribution of DSTI changes refinancing.

also implies that heterogeneity in household
behaviour is likely causing large differences in how The use of buyback liquidity can be well described

mortgage refinancing affects households budgets. by dividing households into three categories

The next part of the memo aims to map out this The first step is to categorise each refinancing

heterogeneity. borrower based on their predominant use of the net
 wealth gained from refinancing. We use the same
 categories as illustrated in chart 3. These are (i) a
Heterogeneous use of refinancing reduction in mortgage debt, (ii) extraction of home
gains among households equity and (iii) reduced debt to non-mortgage banks.
 Obviously, a household may opt for a mix of the
 three scenarios.
Exploring heterogeneity in behaviour is important to
understand motives for refinancing
Until now, we have shown that 62 per cent of the net
wealth gain from refinancing was used to repay debt,
while the rest was extracted as liquidity (see chart 4).
As we will show in this part of the memo, most
households focused on either mortgage debt

 8
ECONOMIC MEMO — DANMARKS NATIONALBANK
2 FEBRUARY 2023 — NO. 2

 Distribution of borrowers based on how they use the net wealth gained from refinancing Chart 7

 Note: The chart shows the probability distribution of how households allocate their realised capital gain. Points along the same line have the
 same probability density. A red shade signifies a higher probability and a green shade signifies a lower probability.
 Source: Danmarks Nationalbank.

Chart 7 shows the distribution of the three uses of realised net wealth gain. This means that, for
the net wealth gain. Each household is placed in example, borrowers who allocate 75 per cent or
either of the three corners if they allocated the entire more of the net wealth gained from refinancing to
capital gain to reducing mortgage debt (top), cashed mortgage debt reduction are categorised as
out through home equity extraction (bottom right) primarily reducing mortgage debt. If no single use
or reduced debt to banks (bottom left). The contour receives 75 per cent, the household is categorised as
lines describe the probability distribution density mixed. Using this simple classification rule, we find
over the three different uses of capital, with red that 46 per cent of the sample primarily reduced
(green) indicating a higher (lower) density of mortgage debt, while 17 and 16 per cent extracted
households. The distribution shows that households cash and reduced debt to banks, respectively. For
do in fact tend to favour one of the three uses over a the remaining 22 per cent of households, no single
mixed allocation of funds, with reduced mortgage use clears the 75 per cent threshold. These are
debt being the most popular choice. categorised as mixed use. To focus on the three
 distinct uses of realised wealth gain, we do not
In order to categorise each borrower based on their analyse the mixed-use group specifically.
main use of capital, we first determine whether any
single use receives 75 per cent or more of their

 9
ECONOMIC MEMO — DANMARKS NATIONALBANK
2 FEBRUARY 2023 — NO. 2

Mortgage debt reducers and cash-outs were similar refinancing decisions. We also fully recognise that
in terms of indebtedness prior to refinancing additional motives for refinancing exist.
Table 1 shows descriptive characteristics for the
three refinancing categories. Strikingly, mortgage The portfolio optimiser motive

debt reducers and cash-outs had very similar LTV, We first focus on refinancers that primarily spend

DTI, and DSTI ratios prior to refinancing. In fact, their their realised net wealth gain to reduce mortgage

LTV ratios were identical at 68 per cent on average. debt. We propose that this group may be driven by

Bank debt reducers, on the other hand, were more the portfolio optimiser motive. Based on individual

indebted by all measures, potentially also reflecting beliefs about future interest rate developments and

that they are typically younger. Their average LTV how long they expect to remain in their current

ratio was 82 per cent prior to refinancing. home, borrowers may find it optimal to refinance
 their existing fixed-rate mortgage. Their outstanding
Households who primarily reduced mortgage debt debt declines while they incur higher interest rates,
realised the largest capital gain, on average, which together leaves their total debt service
compared to the two other groups, which is likely payments (borrowing costs and repayments) at the
related to the fact that they own the most valuable time of refinancing almost unchanged. However, they
homes and are on average older. The group may be expecting mortgage rates to decline again in
reducing bank debt realised the smallest amount of near future. If this happens, they can refinance to
capital gains relative to the other groups, indicating lock in a lower rate. Because of the borrower’s
that this group also lived in the least expensive contractual right to always prepay mortgages at par,
houses with the smallest mortgages in the sample. their outstanding debt will not change when
 refinancing to lock in a lower rate. Together, this
Probability to opt for interest-only mortgages vary two-step strategy likely lowers the total borrowing
Among the group that extracted cash, the share of costs over the loan lifetime.
households taking up an interest only mortgage
increased by 11 percentage points. This indicates This strategy may reduce total borrowing cost if
that the cash extraction group generally has a high mortgage rates actually do decline again in the near
preference for liquidity and use all available sources future as this motive dictates. For illustration
to acquire more cash on hand. The propensity to purposes, we model interest rate dynamics based on
take out an interest only mortgage increased by 5 certain expectations in appendix 3.
percentage points for the mortgage debt reducers,
while dropping 10 percentage points for the bank
debt reducers. The behaviour of the latter group
should be seen in the context that they may have
repaid all their bank debt when refinancing. For this
reason, they may have more space in their private
budget and thus be more inclined to begin
amortisation on their mortgage.

We propose three motives for refinancing fixed-rate
mortgages when mortgage rates rise
In order to understand the driving forces behind the
buybacks, we propose motivations for each of the
three scenarios presented above. Naturally, each
borrower may not fully fall within one of the three, as
multiple circumstances and incentives may drive their

 10
ECONOMIC MEMO — DANMARKS NATIONALBANK
2 FEBRUARY 2023 — NO. 2

 Characteristics across the three borrower categories Table 1

 Variable Reduces Cashes out Reduces
 mortgage debt debt to banks

 Before refinancing

 LTV (%) 68 68 82

 DTI 2.56 2.39 2.66

 DSTI (%) 12 11 15

 Age of oldest household member 45.34 43.77 39.96

 Home value (kr. 1,000) 3,795 3,522 2,803

 Mortgage debt (kr. 1,000) 2,451 2,148 1,889

 Debt to banks (kr. 1,000) 112 111 442

 Bank deposits (kr. 1,000) 335 244 166

 Financial wealth (kr. 1,000) 492 351 206

 IO mortgage share (%) 24 30 34

 Mortgage interest rate (%) 1.09 1.12 1.18

 Bank loan interest rate (%) 4.62 5.09 4.41

 Combined interest rate (%) 1.20 1.27 1.81

 Mortgage fees (%) 0.72 0.75 0.81

 After refinancing

 Net wealth gain (kr. 1,000) 336 267 241

 Change in mortgage debt (kr. 1,000) -360 195 225

 Change in bank debt (kr. 1,000) 2 13 -315

 Cash out (kr. 1,000) -18 482 142

 Share switching from fixed to adjustable rate (%) 39 43 36

 IO mortgage share (%) 29 41 24

 Combined interest rate (%) 2.42 2.37 2.50

 Mortgage fees (%) 0.63 0.77 0.80

 Combined interest rate, 24-month forecast (%) 3.33 3.12 3.14

 Number of households 38,963 14,298 13,380

 Note: Columns show truncated means (the top and bottom 1 per cent of observations are removed). Household income and financial wealth
 is observed in 2020 (end of year).
 Source: Danmarks Nationalbank.

 11
ECONOMIC MEMO — DANMARKS NATIONALBANK
2 FEBRUARY 2023 — NO. 2

Based on the expectation that mortgage rates will
 Allocation of net wealth gains across Chart 8
decline from the current level of about 4 per cent to a financial wealth quartiles
long-run level of 1 per cent, the model suggests a 40
per cent probability that current refinancers will be
able to lock in this lower fixed-rate of 1 per cent
within five years. The probability increases to 80 per
cent by taking a 10-year perspective. These
probabilities are model simulations and cannot be
interpreted as the view of Danmarks Nationalbank.

The expectation of interest rates to converge back to
a lower level (1 per cent in the example) may be
motivated by the widely acknowledged fact that the
natural real interest rate has declined over the past
decades. Several factors still point to a low natural
real rate in the near future.4 If mortgage rates do not
 Note: The mean allocation of refinancing gains across
decline before the loan matures, the total payments households, split by quartiles of the financial wealth
 distribution in 2020.
from the borrower to the lender over the loan life- Source: Danmarks Nationalbank.
time will be larger compared to a situation where the
borrower did not refinance to a higher fixed-rate
mortgage. We explain the importance of interest rate borrowers who do refinance their mortgage.
expectations for the portfolio motive in appendix 3. However, we should keep in mind that a set of
 existing fixed-rate mortgage borrowers have not
Refinancing from a low-coupon to a higher-coupon refinanced their mortgages in 2022 despite also
fixed-rate mortgage comes with a cost. The new having experienced a net wealth gain when
higher-coupon mortgage has an embedded call mortgage rates increased. The net wealth increase
option where borrowers can prepay the mortgage at may induce them to increase spending without
par at any point in time. This is particularly valuable refinancing, simply in order to smooth consumption
for the borrower if the mortgage rates are likely to over their lifetime. In theory, this requires, however,
fall in the near future. The investor requires a that they believe that the net wealth gain is
premium for the risk of prepayment, implying that permanent, i.e., that mortgage rates remain elevated
the overall interest rate on the new fixed-rate until their mortgage matures.
mortgage may be well above the risk-free interest
rate. When market participants perceive the One example is refinancers who expect to move
probability of falling mortgage rates to be substantial within a few years. If they believe that mortgage
(resulting in a substantial risk of prepayment), the rates might come down before the expected time of
fixed-rate mortgage rate incurred by the refinancing selling their property, they may want to realise the
borrower is also substantially higher compared to, net wealth gain by refinancing today. When they
e.g., a risk-free rate of similar maturity or a short- eventually sell their property, and mortgage rates
term mortgage rate. may have come down again, they will realise more
 home equity compared to a situation where they did
The decision to refinance when mortgage rates rise not refinance when mortgage rates where high.
depends to a large extent on subjective expectations
by each borrower. In this memo we focus solely on

4
 Realrenter i lyset af inflation og højere offentlig gæld. Danmarks
 Nationalbank, Forthcoming.

 12
ECONOMIC MEMO — DANMARKS NATIONALBANK
2 FEBRUARY 2023 — NO. 2

Finally, mortgage borrowers do not necessarily pay face conflicting objectives: a desire to consume out
attention to changes in mortgage rates, meaning of their home equity and paying down bank debt.
that they do not realise their net wealth rising.
Inattention is found to play a significant role for The consolidation motive
 5
refinancing behaviour when mortgage rates decline. Mortgage refinancers who primarily use realised net
Inattention may play an equally important role when wealth gains to reduce bank debt are likely driven by
mortgage rates rise. the consolidation motive. For homeowners in this
 group, DSTI can be reduced by repayment of more
The liquidity motive expensive supplementary debt in commercial banks
Limited access to liquid wealth or an inability to take via the realised net wealth gain from refinancing the
out any more credit may prevent households from mortgage debt.
spending as much as they believe is optimal.
Borrowers can lift this liquidity constraint by The intuition is that homeowners who had additional
refinancing their mortgage when mortgage rates rise loans on top of their mortgage, either as part of their
to extract the net wealth gain. We term this the home financing or consumer credit, face relatively
liquidity motive. Similar patterns would be consistent high borrowing costs. Table 1 shows that bank debt
with an alternative explanation, namely that reducers had substantially more bank debt prior to
consumers are myopic by nature.6 Here, borrowers refinancing and that bank debt interest rates are
value near-term spending disproportionately highly, significantly larger, on average, than mortgage rates.
which may induce them to refinance and cash out the Home equity extractions made possible through
newly gained net wealth. refinancing allowed these households to repay the
 most expensive loans in their liability portfolios and
The liquidity motive is likely to dominate among thereby optimise and consolidate the composition of
homeowners who had relatively few liquid assets their liabilities.
prior to refinancing. Chart 8 shows exactly this by
dividing all borrowers into quartiles of financial
 Refinancing affects homeowners’
wealth prior to refinancing. The group to the left,
 financial robustness
with the smallest amounts of wealth, cashed out a
substantially larger part of their net wealth gain
when refinancing compared to households in the top Refinancing during rising interest rates can come at
quartile. For the same reason, it is likely that cash- the cost of higher sensitivity to financial stress.
outs have higher marginal propensities to consume Homeowners who use their realised net wealth gain
compared to the refinancers who reduced debt. for consumption will have higher LTV and DSTI ratios
 compared to homeowners who use the buyback
The median household in the two higher quartiles opportunity to reduce debt. Moreover, shifts from
had less than kr. 10,000 in bank debt prior to fixed to adjustable-rate mortgages expose borrowers
refinancing, explaining why they on average spend to the risk of higher debt service costs in the future,
little on repaying debt to banks. The lowest quartiles, than if they had kept their fixed-rate mortgage. This
who may have relatively high marginal propensities risk is most salient for households who opt for a
to consume, also have more debt in the form of bank short interest rate fixation period, cf. chart 9, which
loans. As they refinance their mortgage, they may

5 6
 Andersen, Steffen, John Y. Campbell, Kasper Meisner Nielsen, and Tarun See for example Strotz, R. H. 1955. Myopia and Inconsistency in
 Ramadorai. 2020. Sources of Inaction in Household Finance: Evidence Dynamic Utility Maximization. The Review of Economic Studies, 23(3),
 from the Danish Mortgage Market. American Economic Review, 110 pp 165–180 and Laibson, David. 1997. Golden eggs and hyperbolic
 (10), pp 3184–3230. discounting. Quarterly Journal of Economics, 112(2), pp 443–477.

 13
ECONOMIC MEMO — DANMARKS NATIONALBANK
2 FEBRUARY 2023 — NO. 2

constitute more than half of mortgages that were
 Fixation periods for households Chart 9
refinanced to an adjustable rate. refinancing to adjustable-rate mortgages

These concerns are particularly relevant under the
current macroeconomic outlook. Rising interest rates
not only reduce the market value of mortgage
bonds, they also put downward pressure on real
estate valuations, likely for years to come. This
increases the risk of negative home equity for highly
leveraged households.

Some households will face higher debt-service costs
To assess these risks, we examine the LTV and DSTI
distributions of refinancing households in all three
groups. The distributions are shown in chart 10.7 The
panels on the left show the end-of-quarter
 Note: Outstanding loan amounts after refinancing for new
distributions before and after refinancing. The right- adjustable-rate mortgages by interest rate fixation
 period.
side panels contain our two-year forecast of the Source: Danmarks Nationalbank.

distributions. Within the 24 months following
refinancing, many adjustable-rate mortgages will
reset to higher interest rates, and house prices will unchanged or declines slightly when compared to
likely fall due to rising rates. See the note in chart 10 the counterfactual.
for a description of our forecast scenario. In yellow,
we show our estimate of the counterfactual Cash extractors take on more risk when refinancing

distribution in absence of refinancing. Here, we use The post-refinancing LTV distributions show how

the same scenario for interest rates and house prices households that cashed out increased their leverage

but we assume that households kept their original when refinancing (see the bottom left panel in chart

fixed-rate mortgages (but still face higher rates on 10). Conversely, the group that opts to reduce

any other variable rate debt they might have). mortgage debt see a large overall drop in LTV ratios,
 with some signs of clustering around 60 per cent.
We forecast a slight increase in the share of stressed
households (DSTI > 40 per cent) in all three groups,
rising from near zero (left, blue) to between 1 and 3
per cent (right, red).8 However, the refinancing
decision affects the groups differently based on their
use of the realised net wealth gain. Compared to the
counterfactual of not refinancing (right, in yellow)
rising interest rates will increase the risk of high DSTI
for the cash extractors only (from 1.2 to 2.7 per cent).
For the two groups that reduced debt when
refinancing, the risk of facing a high DSTI is almost

7
 For data on LTV, we use loan amounts and property valuations schedule, effective interest rate, time to maturity and outstanding loan
 reported by banks and mortgage banks in the Danish credit register. amount. For income, we use household disposable income in 2020.
 8
 Our LTV measure accounts for all loans where the refinanced property While Denmark has no formal DSTI limit, several EU countries targeting
 is used as collateral. For DSTI, we estimate annual debt service DSTI as part of macroprudential policy have set their limit to around
 payments at the household level using data on loan amortisation 40. (European Systemic Risk Board. 2021. A Review of Macroprudential
 Policy in the EU in 2020.)

 14
ECONOMIC MEMO — DANMARKS NATIONALBANK
2 FEBRUARY 2023 — NO. 2

 Adverse scenarios of rising interest rates and declining house prices affect borrowers Chart 10
 differently, depending on their use of net wealth gains from refinancing

 Note: Top left: The household DSTI distribution density for mortgages that were refinanced between 1st and 3rd quarter of 2022 before and
 after refinancing. Top right: Forecasted DSTI in 2024 based on the assumption that adjustable mortgage rates remain at January 2023
 levels (320-340 bps). For adjustable-rate bank loans, we forecast an increase of 200 bps over 2022 levels. The percentages shown at
 the top indicate the share of stressed households (DSTI > 40) within each group. The horizontal lines represent means.
 Bottom left: The household LTV distribution density before and after refinancing. Bottom right: Forecasted LTV where house prices
 are assumed to fall by 15 per cent between 2022 and 2024. The percentages shown at the top indicate the share of underwater
 households (LTV > 100) within each group.
 Source: Danmarks Nationalbank.

This level is used as a guideline above which banks Banks provide subordinated mortgages designed to
should be restrictive when issuing interest-only cover the difference between the 80 per cent LTV
adjustable-rate mortgages. 60 per cent also marks a limit for mortgages issued by mortgage banks and
cut off where mortgage banks charge reduced the regulatory 95 overall LTV limit. After refinancing,
administrative fees. households paying down bank debt cluster tightly

 15
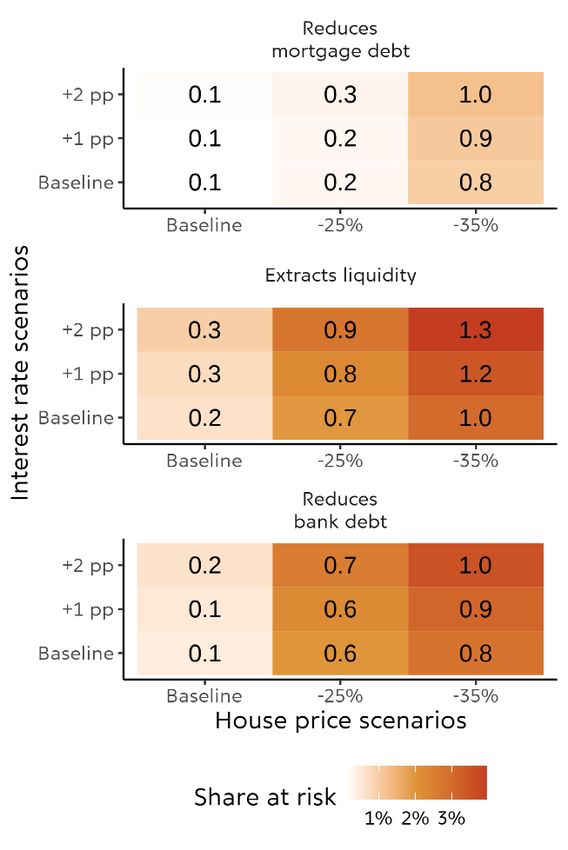
ECONOMIC MEMO — DANMARKS NATIONALBANK
2 FEBRUARY 2023 — NO. 2

around 80 per cent LTV, the limit for mortgages. This
 MFI exposure to refinancing households Chart 11
suggests that many households tend to refinance remain limited even in adverse scenarios
their homes up to the LTV limit and use the wealth
gain to pay down bank debt, with the remainder
extracted as cash.

When incorporating our baseline forecast of a 15 per
cent drop in home values by 2024 (right, red) and
comparing against the counterfactual LTV
distribution (right, yellow), we see that refinancing
can have a large impact on the likelihood of technical
insolvency (LTV > 100). In particular, the group that
reduces their bank debt as part of refinancing see a
substantial decrease in their vulnerability to lower
house prices. The households that cash out and
reduce their mortgage debt initially have similar LTV
ratios (cf. table 1). However, because of how they
allocate their realised wealth gain, the cash-outs find
themselves more exposed in our LTV forecast.
Ultimately, the latter group’s financial robustness
depends on how they use their refinancing gains. If
they invest in their homes or use the cash to boost
their savings accounts, they will be in a better
position than if they increase consumption.

MFI exposure to vulnerable refinancers is limited Note: The charts show the total amount of outstanding loans (in
In order to assess implications for banks and kr. billions) for refinancing households that would be
 vulnerable (LTV > 100 and DSTI>40) in different stress
mortgage banks in adverse scenarios, we examine scenarios. For house prices, we test drops of 15 per cent by
 2024 (baseline), 25 per cent and 35 per cent. The interest
the joint DSTI-LTV distribution given our baseline are scenarios for adjustable-rate mortgages are current
forecast for interest rates and home values (cf. chart market rates (baseline), +1 pp and +2 pp. The shading
 illustrates the share of debt at risk in each scenario.
10). In chart 11, we present the total amount of Source: Danmarks Nationalbank.

outstanding debt of borrowers with LTV > 100 and
DSTI > 40. We show this for our baseline forecast as group. However, this can be attributed to their
well as more severe scenarios. higher initial levels of indebtedness.

The top panel shows that mortgage debt reducers In total, we estimate that refinanced mortgages of
are expected to fare well even in our most serve around kr. 3 billion fall in the risky segment in our
scenario, with only about kr. 1 billion worth of loans most severe scenario. To put this number into
in the risky segment. Households who primarily context, our sample covers refinanced loans totalling
extract cash see similar levels of exposed debt. kr. 173 billion. The total nominal mortgage debt of
However, as the group is smaller, the relative risk Danish households amounted to about kr. 1,500
rate is substantially higher as up to 4 per cent of billion at the time when we conducted this study.
loans fall into the risky segment in our most severe
 To conclude, the impact of refinancing under rising
scenario. Refinancers who primarily reduce bank
 interest rates can serve to both weaken and
debt see relative risk rates to the cash extracting
 strengthen the financial robustness of households,

 16
ECONOMIC MEMO — DANMARKS NATIONALBANK
2 FEBRUARY 2023 — NO. 2

depending on how the realised net wealth gain is
allocated between debt reduction and cash
extraction. While some households who primarily
cash out their wealth gain will find themselves more
vulnerable in an adverse scenario because of
refinancing, the effects are small and will depend on
whether they use the cash for consumption, savings,
or housing investment. As a final word of caution, we
would like to emphasise that we do not stress
household income in this study. A recession along
with a negative employment shock could cause
dramatic shifts in the DSTI distribution, pushing many
more households into unsustainably high levels of
debt service.

 17
ECONOMIC MEMO — DANMARKS NATIONALBANK
2 FEBRUARY 2023 — NO. 2

Appendix 1: Quantifying realised capital gains from mortgages and par for adjustable-rate mortgages.
refinancing fixed-rate mortgages Fixed transaction fees are set to kr. 25,000.

The analysis builds on data from the Danish credit = − ∆
register containing reported quarterly observations
 Some households may have chosen to refinance a
covering the full population of outstanding
 fixed-rate mortgage even in the absence of the
mortgages and bank loans in Denmark. We focus on
 sudden 2022 mortgage rate rise. Such motives
the recent impact of rising interest rates and
 include the desire to extract home equity that was
consequently limit the reference period to between
 available even before the rate increase, e.g., for
the 1st and 3rd quarters of 2022.
 home renovations or spending. Other motives may

Importantly, we characterise a mortgage refinancing be adjustments of borrowing terms such as starting

as a full prepayment of a fixed-rate mortgage or ending interest-only features, or adjustments of

financed by a new mortgage backed by the same the mortgage duration. We therefore restrict the full

underlying collateral asset, without changes in the population of refinancers to cases where a capital

borrower base or any housing market activity. gains argument is justifiable, given the size of a
 potential gain and the assumed transaction fees. This
Capital gains from refinancing are not directly aims to limit the extent of alternative and potentially
reported to the credit register. We therefore estimate competing household circumstances in our
a realised capital gain for each individual refinancing refinancing sample.
transaction the loan-borrower level. The realised
capital gain in the simplest case of a sole debtor We therefore abstract from 7 per cent of the total

refinancing a single fixed-rate mortgage is calculated amount of mortgage refinancing which plausibly is

as the change in the market value of mortgage debt not connected to the increase in mortgage rates.

net transaction costs: These excluded refinancers are identified by
 buyback-prices being relatively high or mortgage
 debt being comparably low. Both restrictions are set
 = × to ensure that the market value of these mortgages is

 − × − not sufficiently affected by lower bond prices and
 consequently imply that these households are not
Where N denotes the notional mortgage debt, p responding to recent rate increases.9
represents the corresponding bond price and FC
captures the (fixed) transaction costs of refinancing. These sampling restrictions mainly affect the amount
Consequently, the liquidity extraction is calculated as of refinancing early in the 1st quarter of 2022 before
the residual capital gain net of total changes in bond prices began to fall materially. The excluded
outstanding debt commitments D. sample during the 2nd and 3rd quarters of 2022 is
 mainly caused by imposing the minimum debt level
For each buyback bond price, p, we use the daily restriction, resulting in only 3 per cent of refinancings
market price of the underlying mortgage bond two being excluded after the 1st quarter.
bank days before the initiation date of the
substituting loan. The bond price of the substituting
mortgage is assumed to be 98.5 for fixed-rate

9
 We set the cut-off bond price to 92 and the minimum debt limit to kr. and debt level restrictions are in line with the general rule-of-thumb
 500,000, meaning that all buybacks at or above a price of kr. 92 per kr. guidelines that the Danish mortgage credit institutions utilise when
 100 notional mortgage debt are excluded in the analysis. These price advising households on refinancing decisions.

 18
ECONOMIC MEMO — DANMARKS NATIONALBANK
2 FEBRUARY 2023 — NO. 2

 Refinancing characteristics using our sample restrictions Table A

 Variable averages at the individual borrower level Full sample Restricted sample Excluded sample
 (N=155,740) (N=139,957) (N=15,783)

 Bond buyback price 83.0 81.9 94.7

 Refinancing amount (kr. 1,000) 1,198 1,240 827

 Total debt before refinancing (kr. 1,000) 1,493 1,527 1,192

 Capital gain net fees (kr. 1,000) 182 200 16

 Change in total debt (kr. 1,000) -100 -124 117

 Liquidity extraction (kr. 1,000) 81 76 126

 Note: The table presents means for our full, restricted and residual (excluded) sample. The data is observed at the individual borrower level.
 Source: Nationalbanken.

Table A contains descriptive statistics for the average between the full and restricted sample averages, all
refinancing in each of the three samples, the full, the our aggregate findings are robust to this sample
restricted and the excluded sample. The average selection.
bond price of all refinancings in our preferred
(restricted) sample is 81.9, with an average notional
mortgage debt of kr. 1.2 million. This corresponds to
an average capital gain of kr. 200,000 per individual
transaction, net of fees. The majority of the capital
gain is used for debt reductions, while 38 per cent,
 The refinancing sample Chart A
on average, is extracted for spending or savings. For population
our main analysis, borrower-level data is aggregated
to the household level. As many households have Kr. billion
 80
two or more adults co-signing a mortgage, this
 70
aggregation reduces the number of observations (cf.
 60
table 1).
 50

This picture changes significantly in the excluded 40

sample in which the average buyback price is 94.7. In 30

combination with a lower refinancing amount, 20

realised capital gains are much smaller at kr. 16,000 10

per borrower. Oppositely, we observe an outsized 0
 2022Q1 2022Q2 2022Q3
liquidity extraction, resulting from an increase in
 Total refinancings Restricted sample Excluded sample
outstanding debt. This significant difference between
the two samples highlights the importance of the Note: Refinancing population sizes across sample
 restrictions.
excluded sample in the pursuit of isolating the effects Source: Nationalbanken.
from rising rates. Lastly, given the similarities

 19
ECONOMIC MEMO — DANMARKS NATIONALBANK
2 FEBRUARY 2023 — NO. 2

 The impact of LTV and coupon rate on the estimated probability of refinancing. Chart A

 Note: The figure shows the marginal impact on the probability of refinancing relative to the mean refinancing rate of 17 percent for different
 values of coupon rate rrior to refinancing (top left), LTV (top left), bank debt (bottom left) and financial wealth (bottom right). Each dot
 represents the mean of 100 households. In the top left graph, the variation along the x-axis within each discrete coupon is jitter added
 for illustrative purposes.
 Source: Danmarks Nationalbank.

Appendix 2: Who refinances during rising interest We then estimate a prediction model that attempts
rates? to predict whether or not a household refinanced
 during this period using a range of characteristics
To learn which predetermined household and loan observed in the 4th quarter of 2021.10 To account for
characteristics best explain the decision to refinance potential interaction effects and non-linearities, we
during 2022, we collect data on the universe of estimate a gradient boosted tree model (XGboost)
Danish borrowers with a 30-year fixed-rate mortgage and use Shapley values11 to examine the marginal
of at least kr. 500,000 at the end of 2021. Our sample impact of each variable on model predictions. To
consists of 426,000 households, 17 per cent of which avoid overfitting, we evaluate the model on 25 per
refinanced in the 1st to 3rd quarters of 2022. cent test sample that was not used to train the
 model.

10 11
 The variables are LTV, mortgage debt, bank debt, DSTI, DTI, household Lundberg, Scott M. et al. 2020. From local explanations to global
 income, municipality, home value, age of the oldest household understanding with explainable AI for trees. Nature Machine
 member, financial wealth, coupon rate, mortgage fee rate, change in Intelligence, 2, pp 56–67.
 home value between 2019 and 2021, interest-only status and indicators
 for current mortgage bank.

 20
ECONOMIC MEMO — DANMARKS NATIONALBANK
2 FEBRUARY 2023 — NO. 2

Unobservable household characteristics, such as
 Model performance matrix Table A
expectations, play an important role in the
refinancing decision. Therefore, our set of Predicted Predicted no
explanatory variables are likely insufficient for fully refinance refinance

explaining refinancing behaviour. Indeed, while the True
 Refinance 14,403 3,850 positive
model performs significantly better than random rate: 79%
guessing, the performance is far from perfect. Table No False
 32,391 56,058 positive
A summarizes model predictions on the out-of- refinance
 rate: 37%
training-sample test data. In particular, the model Precision: False
 31% omission rate:
overestimates the number of households that 6%
refinances. Only 31 per cent of all positive predictions
are actually true (precision). Note: The table presents the performance of our prediction
 model on the test dataset. The numbers capture the
 number of observations by their actual refinancing status
Nevertheless, we can draw some conclusions on how (rows) and their predicted status (columns).
 Source: Danmarks Nationalbank.
mortgage and household characteristics correlate
with the decision to refinance. The most important
predictors all relate to the size of the wealth gain that
can be realized through refinancing. In particular, the
coupon rate on the household’s current mortgage is
found to be the most important predictor. Having a
coupon rate of 0.5 or 1 per cent increases the
likelihood of refinancing by about 5 percentage
points, cf. chart A, top left. Households holding low-
coupon mortgages therefore stand to realise the
largest net wealth gains by refinancing their fixed-
rate mortgage. Another potential mechanism is that
households with a low coupon secured this rate by
refinancing in the recent past, when interest rates
were at record lows. Households that have
refinanced in the past could face lower information
costs when faced with the decision to refinance
again.

Another important predictor is Loan-to-value (LTV)
ratios. Here, our model predicts that LTV ratios
above 65 per cent are associated with a higher
likelihood of refinancing, cf. chart A, top right. This is
consistent with a consolidation motive as some
household may target an LTV ratio of 60 per cent in
order to qualify for adjustable-rate and interest-only
mortgages as well as lower fees. In support of a
liquidity and portfolio optimising motive, we find that
both low financial wealth and high levels of bank
debt are associated with a higher likelihood of
refinancing, although both matter much less than
LTV and coupon rate, cf. chart A, bottom.

 21
ECONOMIC MEMO — DANMARKS NATIONALBANK
2 FEBRUARY 2023 — NO. 2

Appendix 3: Rationalising refinancing behaviour
when mortgage rates increase Change in payments when Chart A
 refinancing depends on the type of
 the new loan
The Danish mortgage system allows borrowers to
refinance both in case of falling and rising mortgage Percentage change in the 30-year NPV when refinancing

rates. While mortgage refinancing is easily 150
 Fixed 4%
rationalised when mortgage rates decline12, the 100
optimal refinancing decision is more complex when
 50
mortgage rates increase.13 This appendix explains
 Fixed 4%
the main factors that may rationalise mortgage 0
 var 0.25%
refinancing in case of rising mortgage rates though -50
the portfolio optimisation motive. var 0.25%

 -100
 -100 -50 0 50 100 150
Household borrowing costs and liquidity Costs Annuity Percentage change in 1st-year expenditures

From an accounting perspective, the refinancing
decision is considered profitable insofar that the net Note: In these examples, we consider a situation where a fixed-
present value (NPV) of the after-tax interest rate 1% mortgage is refinanced and the entire net wealth
 gain is used to reduce mortgage debt. Based on bond
payments (incl. administration fee) associated with prices on 23 June 2022 where market prices of bonds
 were at a local minimum. We assume that the
the new loan are lower than that of the existing homeowner keeps the new mortgage until maturity
mortgage. In addition to the cost of borrowing, the (calculation horizon is 30 years). Discounting rate of 2.5
 per cent.
mortgage is typically amortised over a 30-year Source: Refinitiv Eikon and own calculations.

period. This implies that the cashflow constitutes
both interest payments and capital repayments. The
 In this case, the interest payments have risen from
latter is not considered to be costs of borrowing but
 1% on a kr. 1 million loan to 4% on a kr. 820,000
is rather a form of savings vehicle in the sense that
 loan. This is an immediate increase of 110 per cent in
the borrower effectively owns an increasing share of
 the 1st-year expenditures and over the full lifetime of
the property for each mortgage repayment.
 the loan, the NPV of all cash flows increase by 146
Nonetheless, mortgage repayments impact
 per cent (after tax). This is illustrated by the blue dot
borrowers’ budgets directly and may for that reason
 in chart A. However, as the size of the mortgage has
play an important role for the refinancing decision. In
 declined substantially, capital repayments are
the following, we focus both on the change in the
 substantially lower on the new mortgage compared
NPV of after-tax borrowing costs as well as the
 to the old one. In fact, the NPV and 1st-year
change in the NPV of the total annuity payments
 expenditures remain almost unchanged when
(after-tax borrowing costs and repayments).
 considering the sum of changes to borrowing costs
Consider an existing mortgage borrower with a 30- and capital repayments. This is illustrated by the
year kr. 1 million 1% fixed-rate mortgage. As fixed purple dot in chart A. In absent of interest rate tax
mortgage rates increase to, say, 4% the borrower deductions, the 1st-year payments would increase by
can buy back the existing mortgage at a reduced 10 percentage-points, rather than decreasing 1
price, say kr. 82 for each kr. 100 owed. The buyback percentage-point as shown in chart A. This illustrates
is financed by a new mortgage of kr. 820,000 at a 4% the importance of current tax rules on the refinancing
30-year fixed rate. decisions in households.

12 13
 See for example Andersen, Steffen, John Y. Campbell, Kasper Meisner See for example Jensen, Bjarne Astrup and Jensen, Michael Møller
 Nielsen, and Tarun Ramadorai. 2020. Sources of Inaction in Household Jensen and Møller. 2022, Den misforståede gevinst ved
 Finance: Evidence from the Danish Mortgage Market. American opkonvertering.
 Economic Review, 110 (10), pp 3184–3230.

 22
You can also read