Global Matters 32 Infrastructure, interest rates & inflation - October 2021 - 4dinfra.com
←
→
Page content transcription
If your browser does not render page correctly, please read the page content below

4dinfra.com

Global Matters 32
Infrastructure, interest rates
& inflation

October 2021
Infrastructure, interest rates & inflation                                                                                                      2

Infrastructure, interest rates and inflation: 3 dynamics that are commonly linked, but often in an
incomplete manner that does not reflect the full story of their correlation. Economic conditions over the
past 5 years have been relatively benign, meaning the relationship between these 3 factors has not been
a major market focus. However, with the spread of the COVID-19 virus and associated government
response, that environment has begun to show signs of change. In particular, inflation pressures have
begun to emerge, along with market discussions surrounding the direction of interest rates.
We have previously examined the infrastructure/interest rates/inflation dynamic in Global Matters
articles published in April 2016 (Listed infrastructure investment and rising interest rates) and April 2018
(Is infrastructure a bond proxy?). In this article, Sarah Shaw (4D’s Global PM & CIO) Greg Goodsell (4D’s
Global Equity Strategist) and the 4D investment team revisit and expand that earlier work.

Contents
Global economic outlook.............................................................................................................. 3
Inflation is the key risk ................................................................................................................. 6
Infrastructure & interest rates ...................................................................................................... 8
How do User Pay & Regulated Utility assets perform during rising interest rates?.......................... 9
Infrastructure & inflation: stock case studies .............................................................................. 12
Overall conclusion...................................................................................................................... 13
Appendix – detailed case study results and analysis .................................................................... 14
Infrastructure, interest rates & inflation                                                                    3

In order to properly examine the infrastructure/interest rates/inflation dynamic, we wanted to firstly
provide a brief backdrop of the prevailing macro-economic environment and how we perceive key factors
playing out.

Global economic outlook
GDP growth in 2021 looks like being curtailed somewhat compared with expectations 6 months ago, as the
Delta variant continues to spread and supply chain disruptions put pressure on prices. However, despite
the ongoing presence of the pandemic, the outlook for 2021 remains robust and we remain optimistic
about the outlook for the global economy and infrastructure asset class for 2022 and beyond. The latest
(September 2021) OECD GDP growth forecasts, shown below, are supportive of our view.

Our optimism for an ongoing recovery stems from the following.

•   COVID-19 vaccines are being deployed globally with high and increasing vaccine rates
    emerging
COVID-19 vaccines have been developed in record time, are now being deployed and are proving to be very
effective in preventing severe onset of the disease. You can be certain that vaccine versions 2.0+ are
currently being developed, along with other modes of COVID treatment. This is truly remarkable and should
hopefully see the currently rampant virus gradually tamed.
Bloomberg reports (September 2021) that India will restart exports of COVID-19 vaccines for the World
Health Organization’s Covax initiative, even as it races to inoculate its own adult population. Italy has
started giving third doses of vaccines to its most vulnerable citizens. The US will soon allow most foreign air
travellers to enter as long as they’re fully vaccinated; and it has added a testing requirement for
unvaccinated Americans. The UK has also significantly simplified its travel rules and restrictions along with
many parts of South America, and even Australia is hinting at a 2021 international re-opening. The Pfizer-
BioNTech vaccine was deemed safe and produced strong antibody responses in children ages 5 to 11 in a
large-scale trial, according to the companies: findings that could pave the way to begin vaccinating grade-
school kids. US regulators are expected to decide soon on whether and how booster shots should be
administered in the US, where the death toll has surpassed that of the 1918 influenza outbreak.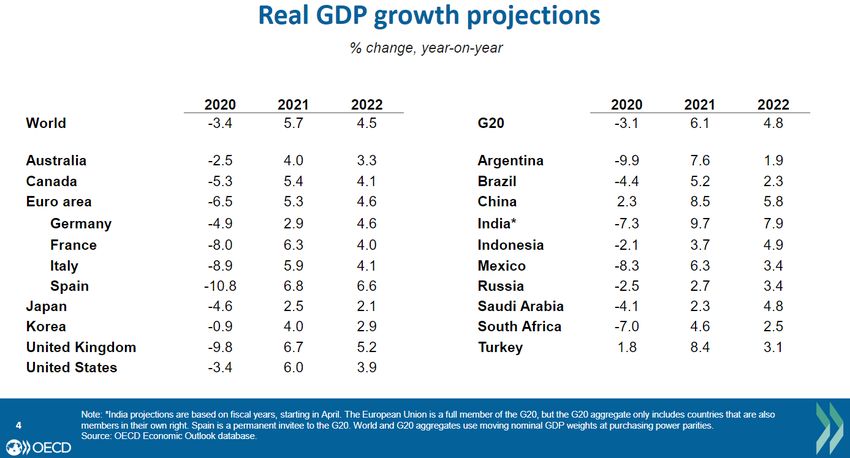
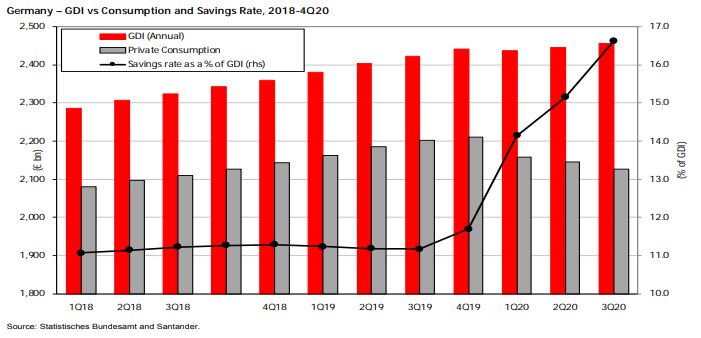
Infrastructure, interest rates & inflation                                                                   4

•       As vaccine percentages rise, lockdowns lift – which sees a huge demand boost
As the level of vaccinations around the world rises and greater acceptance of living with the virus emerges,
lockdowns gradually get lifted – releasing an immediate boost of pent-up demand and adding to the
recovery. This quantum of pent-up demand is illustrated in the following chart, which shows a rapidly
accelerating savings rate (as a % of GDP) in Germany in 2020 as lockdowns held consumer spending in
check.

•       Huge fiscal and monetary stimulus will continue to propel global economic growth
Prior to the advent of the Delta strain, it was beginning to look as if significant global fiscal and monetary
stimulus would begin to be wound back. However, that does not look to be the case now. For example,
UBS 1 estimates that, in aggregate, only 8% of last year’s stimulus will have been reversed by the end of
2021. Of course, that is largely because the virus keeps flaring up and because severe mobility restrictions
have been reimposed by numerous countries at some point this year while they rush to vaccinate the
populous. This has necessitated extending last year’s support schemes and the approval of some new ones,
pushing the adjustment out to 2022.
According to the IMF 2, since March 2020 governments have spent ~US$16 trillion providing fiscal support
amid the pandemic, and global central banks have increased their balance sheets by a combined US$7.5
trillion. Budget deficits are the highest they have been since World War II and central banks have provided
more liquidity in the past year than in the past 10 years combined. However, this was necessary – IMF
research indicates that if policymakers had not acted, last year’s recession, which was the worst peacetime
recession since the Great Depression, would have been three times worse. The world lost US$22 trillion in
output as a result of COVID-19, relative to what the IMF expected in January 2020.
Governments around the world are no doubt looking forward to the economic rebound and the return of
consumption and inflation as they seek to reduce their debt burden and wind back support.

1   UBS: Global Fiscal Stimulus Tracker – the ‘fiscal cliff’ looms (again), September 2021
2   IMF: Seizing the Opportunity for a Pro-Growth, Post Pandemic World, July 2021
Infrastructure, interest rates & inflation                                                                   5

                  Value of COVID-19 fiscal stimulus packages in G20 countries (May 2021 % of GDP)

            Statista,2021

•       Infrastructure investment is key to the longer-term global solution
While we think the pandemic will last longer than was initially hoped, we believe the global economy will
ultimately emerge stronger for the experience. The huge amount of fiscal and monetary stimulus is still to
be fully felt in economic terms with much of that spending focused on essential infrastructure investment
around the globe, including the green energy transition.
Recent IMF research 3 shows how effective such expenditure is in boosting jobs and growth. When
governments invest in infrastructure, they create many new jobs (see graphic below). The IMF evaluated
the direct employment effect of public investment in the key infrastructure categories of electricity, roads,
schools, hospitals, water and sanitation. Using data from 41 countries over 19 years, the IMF estimates that
US$1 million of public spending in infrastructure creates 3-7 jobs in advanced economies, 10-17 jobs in
emerging market economies, and 16-30 jobs in low-income developing countries. Overall, the IMF
estimates that 1% of global GDP in public investment can create more than 7 million jobs worldwide
through its direct employment effects alone. The infrastructure spend economic ‘multiplier’ is significant.

3   IMF: Putting Public Investment to Work, August 2021
Infrastructure, interest rates & inflation 6 • Infrastructure stimulus packages in practice After months of negotiations, Bloomberg reports (August 2021) the US Senate passed a US$1.2 trillion infrastructure plan (US$550 billion in new federal investment) that would represent the biggest burst of spending on US public works in decades. The bipartisan 69-30 vote marked a significant victory for President Joe Biden’s economic agenda. The bill still faces hurdles in the House, but if the package clears both chambers it includes new spending for roads and bridges, power grid upgrades and broadband expansion. Similarly, India, Reuters reports (August 2021), will launch a 100 trillion rupee (US$1.35 trillion) national infrastructure plan that will help generate jobs and expand use of cleaner fuels to achieve the country's climate goals, PM Narendra Modi said. The infrastructure program, called ‘Gati Shakti’, will help boost productivity of industries and boost the economy, Mr Modi said during his speech at the Independence Day celebrations in New Delhi: ‘We will launch a masterplan for Gati Shakti, a big program ... (it) will create job opportunities for hundreds of thousands’. Boosting infrastructure in Asia's third largest economy is at the heart of Mr Modi's plan to pull back the country from a sharp, COVID driven economic decline. These recent infrastructure specific programs follow the EU, which was a very early proponent of the infrastructure led recovery having launched its €750bn Next Generation EU recovery fund in H2 2020. Inflation is the key risk Critical to the positive scenario outlined above is the issue of inflation. The past 6 months has seen some inflationary spikes which are raising concerns. There are two broad schools of thought regarding inflation. 1. Inflation is here to stay This view is that inflation is here, if not to stay, then for a long time – possibly in a 1970s type double digit inflationary scenario. This argument has its origins in the huge amount of fiscal and monetary stimulus that has occurred so far (see above). All these dollars need to go somewhere and one argument is that we will see permanent, wide-spread inflationary pressures.
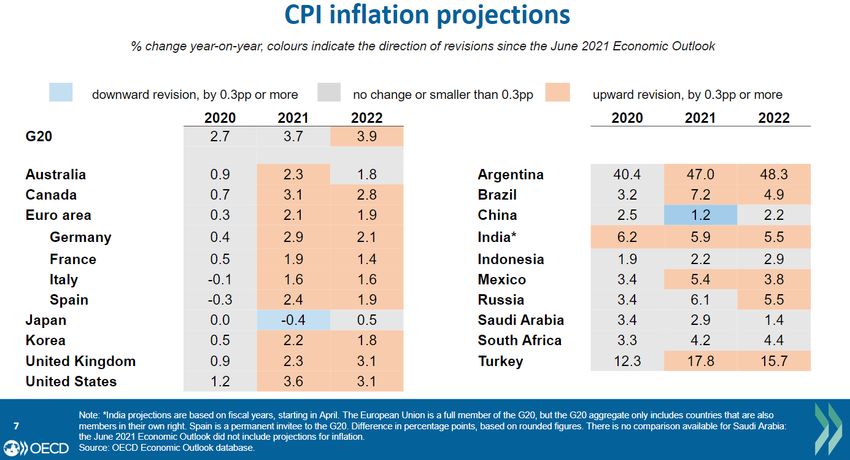
Infrastructure, interest rates & inflation                                                                     7

2. Current inflationary spikes are transitory driven by the unique environment we are in
This argument, which can probably be seen as consensus (the US Fed, IMF, RBA, ECB are in this camp), is
that there are no broad spread inflationary pressures on wages and that current inflationary blips are
driven by things such as the 2020 economic numbers being so distorted by COVID that when we look at the
yoy change in 2021, the resultant answer is not representative of the underlying environment.
Another argument for the current inflationary forces being transitory is that the ‘supply chain disruptions’
caused by the pandemic have contributed to recent price hikes. Bloomberg reports (August 2021) that
these disruptions remain prevalent in the global economy. Chip shortages that have held back automakers
and computer manufacturers are getting worse. Chip lead times, the gap between ordering a
semiconductor and taking delivery, increased by more than 8 days to 20.2 weeks in July from the previous
month. That gap was already the longest wait time since tracking this data began in 2017. Shortages of
microcontrollers, logic chips that control functions in cars, industrial equipment and home electronics
jumped in July. Even Toyota is affected. The automaker warned it will suspend output at 14 plants across
Japan and slash production by 40% due to supply disruptions, including chip shortages.
Our view is that the recent inflationary spikes are transitory and will gradually ease over time. However,
this is not to say we don’t expect a modest level of inflation to gradually return – this is what central banks
are targeting, and what we would like from an infrastructure investment perspective. Given the quantum of
stimulus yet to flow through into the real economy, coupled with the huge pent-up consumption demand
reflected in deposit rates having spiked through the pandemic, we do expect some inflationary pressures
will emerge over time. While we will be monitoring this closely, we are currently in the camp of near-term
inflationary spikes, with a gradual return of sustained modest inflation over time. As such, we don’t see
central banks being forced into any drastic action such as near-term interest rate hikes. We are also of the
belief that central banks may let inflation run somewhat ahead of target over the short to medium term, to
assist in the reduction of headline nominal government debt to GDP levels.
OECD September 2021 inflation forecasts are shown below.
Infrastructure, interest rates & inflation                                                                         8

Infrastructure & interest rates
Whatever your view on the nature of the current inflationary spikes and outlook, from an investment
perspective it is important to understand how infrastructure assets react in an inflationary environment.
A common dictum of listed equity investment is that infrastructure stocks under-perform as interest rates
and inflation rise. This is often associated with the perception of these stocks as being a ‘bond proxy’. The
logic then flows that, just like a government bond, as interest rates rise, share (bond) prices fall as the
present value of their ‘fixed’ future cash flows is now worth less and the required yield from the asset has
to increase.
However, many infrastructure stocks have built in inflation protection either directly linked to tariffs or
indirectly through their regulatory construct. As such, in our inflationary scenario (outlined above) some
parts of the infrastructure universe may enjoy the perfect storm over the short/medium term – namely low
interest rates to support future growth, economic activity flowing through to volumes, and explicit inflation
hedges through their tariff mechanisms to combat any inflationary pop we may experience.
To appreciate this dynamic, we need to segregate the infrastructure stock universe into its two key classes:
User Pay and Regulated Utilities.

•   User Pays
By their very function, User Pay assets are geared to capture GDP growth and wealth creation. Typical User
Pay assets are toll roads, airports, railways and ports, whereby the user ‘pays’ to use the asset. These stocks
have a direct positive correlation with GDP growth (volumes) and often have built-in inflation protection
mechanisms in their business models (tariffs). As interest rates/inflation increase over time, these
protection mechanisms begin to kick in and positively impact earnings. This is then reflected in the relevant
stock price and performance.
In addition, in recent years, management at these companies have generally been actively locking in
medium to longer-dated fixed rate borrowings during this extraordinarily long period of very low global
interest rates. As a result, the impact of higher interest rates on financials should be limited to the issue of
new debt, mitigating any overall earnings impact.

•   Regulated Utilities
In contrast Regulated Utilities, such as electricity, water and gas providers, can be more immediately
adversely impacted by rising interest rates/inflation because of the regulated nature of their business.
These assets are more ‘bond proxy’ in nature, particularly over the shorter term. While they are slower to
realise the benefits of economic growth, at the same time they are less exposed to economic contraction
and benefit from lowering interest rates.
The flow through of inflation is dictated by whether the Utility’s return profile is real or nominal. If the
Utility operates under a real return model, then inflation is passed through into tariffs much like a User Pay
asset. This model is more prevalent in parts of Europe and Brazil, for example, and limits the immediate
impact of inflationary pressure – and in fact can positively boost near-term earnings. In contrast, if the
Utility is operating under a nominal return model, it must bear the inflationary uptick reflected in certain
costs until it has a regulatory reset (see below), when the changing inflationary environment is
incorporated into new tariff/revenue assumptions. This nominal model is the standard model for the US
Utility sector. As such, those Utilities in a real model will weather inflationary spikes a little better than their
nominal peers.
However, in terms of interest rates shifts, the issues for both real and nominal models are consistent. For a
Regulated Utility to recover the cost of higher interest costs, it must first go through its regulatory review
process. This involves making submissions to the regulator, arguing that prevailing economic conditions
have changed and it should be entitled to recover those increased costs via increased rate charges to its
client base. While a regulator is required to have regard for the changing cost environment the Utility faces,
Infrastructure, interest rates & inflation                                                                                             9

the process of submission, review and approval can take some time or can be dictated by a set regulatory
period of anywhere between 1-5 years. In addition, the whole environment surrounding costs, household
rates and utility profitability can be highly politically charged. As a result, both the regulatory review
process and the final outcome can be quite unpredictable.

How do User Pay & Regulated Utility assets perform during rising interest rates?
Having established the premise that User Pay assets offer more protection from rising interest rates and
inflation while Regulated Utilities can be more vulnerable, we can test this thesis by examining how these
two distinct asset sub-sectors have performed during previous periods of rising interest rates.
We examined this scenario back in April 2018 in our GM article Is infrastructure a bond proxy? We
concluded that bucketing all infrastructure as a ‘bond proxy’ was a far too simplistic conclusion. Rather, the
inherently different asset characteristics of User Pays vs Regulated Utilities, and the performance they
deliver, mean infrastructure is an asset class that can be tailored to all stages of a market cycle. User Pay
assets facilitate a portfolio being positioned for a GDP growth/rising interest rate/inflationary environment.
Conversely, in more difficult economic times, possibly incorporating falling interest rates, Regulated
Utilities offer an ideal defensive home given their earnings certainty, which are largely immune to the
macro cycle.
Our earlier analysis holds true today, and so we revisit below how User Pay and Regulated Utility stocks
performed following: a) a rising US Federal Funds (Fed Funds) rate, and b) rising 10-year US Government
Treasury Bond (T-Bond) yields.

Rising interest rate cycles in the US since 2000
Since 2000, there have been two Fed Funds rate hike cycles (Chart 1) and three periods during which the US
T-Bond yield rose by more than 1% over consecutive months (Chart 2).
    Chart 1: US Fed Funds rate from 2000                      Chart 2: US 10-Year T-Bond Yield from 2000
                                                                 7
                                                                (%)
                                                                 6

                                                                 5

                                                                 4

                                                                 3

                                                                 2

                                                                 1
                                                                                              Yield increases > 1%
                                                                 0
                                                               31-Mar-00          31-Mar-04   31-Mar-08        31-Mar-12   31-Mar-16

    Source: Bloomberg                                         Source: Bloomberg

To test the thesis that User Pay assets can outperform in periods of rising interest rates/inflation, we:
•       segregated 4D Infrastructure’s investible universe 4 of ~300 global listed infrastructure stocks into User
        Pays (the ‘4DUP index’) and Regulated Utilities (the ‘4DUts index’); and

4   4D investible universe as at 31 March 2018
Infrastructure, interest rates & inflation 10
• then examined how these two indices, as well as the S&P Global Infrastructure Index (‘S&PI’),
performed versus the MSCI World Index (‘MSCI’ – as a proxy for global equity market performance)
during the above time periods – namely, rising Fed Funds rate and rising US 10-year T-Bond yields.
To better understand the performance behaviour of the indices, we separated performance over the first
six months and second six months (i.e. months 7–12) after rates started increasing.
Rising rates 1: Two Fed Fund rate hike cycles since 2000
As shown in Chart 1 above, since 2000 there have been two periods in which the US Fed Funds rate rose by
more than 1% over consecutive months. The performances of our infrastructure indices vs the MSCI during
these periods are shown in Table 1 below.
Table 1: MSCI World v 4DUP, 4DUts & S&PI
Relative performance from the date the US Federal Funds rate started rising
Period 1: FF rates start increasing in May 2004
Performance months 1–6 (%) Performance months 7–12 (%)
4DUP 4DUts S&PI 4DUP 4DUts S&PI
Index performance 21.6 18.2 22.8 6.8 9.0 7.2
MSCI World 9.2 9.2 9.2 2.5 2.5 2.5
Outperformance 12.4 9.0 13.6 4.3 6.5 4.7
Outperform v MSCI Yes Yes Yes Yes Yes Yes
Period 2: FF rates start increasing in November 2015
Performance months 1–6 (%) Performance months 7–12 (%)
4DUP 4DUts S&PI 4DUP 4DUts S&PI
Index performance 5.5 13.2 7.8 8.9 -2.1 -1.3
MSCI World 0.4 0.4 0.4 3.4 3.4 3.4
Outperformance 5.1 12.8 7.4 5.5 -5.5 -4.7
Outperform v MSCI Yes Yes Yes Yes No No
Source: Bloomberg. We used the S&P Global Infrastructure Index (S&PI) as a proxy for global listed infrastructure performance; it only became
available in November 2001, but is the longest running index for GLI stocks. The 4DUP and 4DUts indexes are market cap weighted. All
performance numbers are total return, converted to US$ equivalent using Bloomberg formulas.
Rising rates 2: Three periods where the US 10-year T-Bond yield rose by 1% since 2000
Chart 2 shows that since 2000 there have been three periods during which the US T-Bond yield rose by 1%
over consecutive months. Performance of our infrastructure indices during these periods is in Table 2.Infrastructure, interest rates & inflation 11
Table 2: MSCI World v 4DUP, 4DUts & S&PI
Relative performance from the date the US 10-year T-Bond yield started rising
Period 1: US 10-year T-Bond yields start increasing in May 2003
Performance months 1–6 (%) Performance months 7 – 12 (%)
4DUP 4DUts S&PI 4DUP 4DUts S&PI
Index performance 16.4 7.0 12.6 9.4 10.4 10.1
MSCI World 14.9 14.9 14.9 8.1 8.1 8.1
Outperformance 1.5 -7.9 -2.3 1.3 2.3 2.0
Outperform v MSCI Yes No No Yes Yes Yes
Period 2: US 10-year T-Bond yields start increasing in August 2010
Performance months 1–6 (%) Performance months 7 – 12 (%)
4DUP 4DUts S&PI 4DUP 4DUts S&PI
Index performance 23.3 11.0 19.6 -0.9 1.3 -6.4
MSCI World 26.3 26.3 26.3 -8.9 -8.9 -8.9
Outperformance -3.0 -15.3 -6.7 8.0 10.2 2.5
Outperform v MSCI No No No Yes Yes Yes
Period 3: US 10-year T-Bond yields start increasing in April 2013
Performance months 1–6 (%) Performance months 7 – 12 (%)
4DUP 4DUts S&PI 4DUP 4DUts S&PI
Index performance 7.2 1.2 3.8 9.4 11.1 9.7
MSCI World 10.0 10.0 10.0 6.6 6.6 6.6
Outperformance -2.8 -8.8 -6.2 2.8 4.5 3.1
Outperform v MSCI No No No Yes Yes Yes
Source: Bloomberg. See further comments in Table 1.
Performance conclusions
As evident in Table 1, a rising US Federal Funds rate:
• did not significantly impact the performance of the 4DUP, which outperformed the MSCI in all four
measured periods;
• but the performance of the 4DUts and S&PI were not as strong, significantly underperforming the
MSCI during months 7-12 of the November 2015 rate hike cycle.
In contrast, Table 2 suggests that rising US Bond yields are far more influential for listed infrastructure
equity market performance. Notably:
• the 4DUP outperformed the MSCI over four of the six measured time periods, underperforming only
during the first six months of Periods 2 and 3, and recovering much of that underperformance during
months 7-12; and
• both the 4DUts and the S&PI underperformed the MSCI during the first six months of each of the three
periods of rising yields before outperforming during months 7-12.
We believe this analysis supports our thesis that User Pay assets are resilient through periods of rising
interest rates/inflation and can provide the out-performance sought. In contrast, Regulated Utilities are
more inclined to demonstrate the ‘bond proxy’ profile.Infrastructure, interest rates & inflation 12 Infrastructure & inflation: stock case studies Looking at the issue now at a company level, we used 3 test case scenarios to attempt to illustrate the fundamental impact of higher inflation leading to faster than anticipated increases in interest rates on 3 quite different infrastructure assets – Transurban, CMS Energy and SNAM. A summary of the impact on revenue, EBITDA and earnings (NPAT) over the next 3 years, as well as to the 5-year IRR, is depicted below. • Analytical framework The analysis below is measured relative to our current 4D Base Case company forecasts. Key assumptions and test cases are summarised below, keeping all other assumptions constant (e.g. GDP growth). Base Case (current 4D forecasts): Premised on inflation being transitory with a pop in 2021/22 before reverting to a more gradual path to long-term averages. In this scenario, interest rates gradually revert to a normalised level over a number of years. Test Case 1: Explores the impact of inflation two percentage points above current Base Case assumptions for the next 3 years (2022-2024) before reverting to a normalised long-term level in response to interest rate moves. Bond rates move up by 1% in 2022 (relative to current assumptions) and a further 1% in 2023 before reverting to long-term averages in 2025 (ahead of the timeline in our Base Case). In this case, the higher 2022 bond rate will also impact the discount rate used to value long-term cash flows and will see our cost of equity move up 0.5% 5 pa. This test case assumes inflation moves interest rates but the interest rate response works to bring inflation back to long-term averages. Test Case 2 (extreme case): Inflation is three percentage points above our Base Case assumptions for the next 3 years and remains 1% above long-term averages, with bond rates moving up 1% in each of 2022, 2023 and 2024 before stabilising 1% above our long-term assumptions. • Summary results We believe the results of the above test cases applied to our 3 stocks, shown below, support our view that inflation and indeed interest rates do not need to be negative for infrastructure assets in terms of earnings and/or long-term valuations. Instead, the impact is very much dependent on the type of infrastructure asset (as illustrated in the table below). Detailed results can be found in the appendix. 5 4D does not use spot bond rates as the starting point for our DCF analysis. Rather, as we a see a reversion to norm in economic data over the life of our cash flow models, we also use a normalised bond forecast as the starting point for our discount rate. This ‘normalised’ bond rate is an average of spot and the long-term bond rate; hence the impact to discount rates, relative to our Base Case, is only 50bps, not the full 100bps.
Infrastructure, interest rates & inflation                                                                                           13

                Table 3: Stock case studies: summary results v 4D Base Case assumptions
        Stock             Asset type                Test Case 1 results                       Test Case 2 results
 Transurban            User Pays             Y1, Y2 & Y3: EBITDA & NPAT            Y1, Y2 & Y3: EBITDA & NPAT increase
 (Australia)                                 increase across all 3 years           across all 3 years
                                             5-year IRR -28bp                      5-year IRR +111bps
 CMS Energy            Nominal return        Y1, Y2 & Y3: EBITDA & NPAT            Y1, Y2 & Y3: EBITDA & NPAT
 (US)                  Regulated Utility     decrease across all 3 years           decrease across all 3 years
                                             5-year IRR -190bps                    5-year IRR -271bps
 SNAM (Italy)          Real return           Y1: EBITDA & NPAT decrease            Y1: EBITDA & NPAT decrease
                       Regulated Utility     Y2 & Y3: EBITDA increases             Y2 & Y3: EBITDA & NPAT both
                                             Y2 & Y3: NPAT decreases in Y2         increase
                                             before increasing in Y3               5-year IRR +266bps
                                             5-year IRR -64bps
 Test case             Test Case 1: Inflation 2% above current Base Case           Test Case 2: Inflation 3% above Base
 assumptions           assumptions for the next 3 years (2022-2024) before         Case assumptions for next 3 years and
                       reverting to a normalised long-term level. Bond rates       remains 1% above long-term averages,
                       move up by 1% in 2022 and a further 1% in 2023 before       with bond rates up 1% in 2022, 2023 and
                       reverting to long-term averages in 2025 (ahead of the       2024 before stabilising 1% above our
                       timeline in our Base Case).                                 long-term assumptions.
 Source: 4D Analysis

Overall conclusion
We believe the global economic recovery is continuing, although the Delta strand of the COVID virus has
likely pushed out the timing of the full recovery. This may cause some unease in equity markets, which had
already largely ‘baked in’ a ‘V’ shaped economic recovery.
Inflation remains a key risk, although we believe current inflationary spikes are transitory. However, even if
we do enter a period of sustained inflation, we believe infrastructure is the ideal asset class to take shelter
in given its explicit or implicit hedges.
In this article we have looked to outline the important differences between User Pay and Regulated Utility
assets, and why we believe certain sub-sets should outperform during a rising inflation/interest rate period
due to a more immediate and direct hedge. At 4D we remain overweight User Pay assets and within the
Regulated Utility sector favour those with real returns. However, should the market overreact to the
economic outlook we would use it as a buying opportunity across all sectors.

For more insights from 4D Infrastructure, visit 4dinfra.com
The content contained in this article represents the opinions of the author/s. The author/s may hold either long or short positions
in securities of various companies discussed in the article. This commentary in no way constitutes a solicitation of business or
investment advice. It is intended solely as an avenue for the author/s to express their personal views on investing and for the
entertainment of the reader.
This information is issued by Bennelong Funds Management Ltd (ABN 39 111 214 085, AFSL 296806) (BFML) in relation to the 4D
Global Infrastructure Fund and 4D Emerging Markets Infrastructure Fund. The Funds are managed by 4D Infrastructure, a
Bennelong boutique. This is general information only, and does not constitute financial, tax or legal advice or an offer or solicitation
to subscribe for units in any fund of which BFML is the Trustee or Responsible Entity (Bennelong Fund). This information has been
prepared without taking account of your objectives, financial situation or needs. Before acting on the information or deciding
whether to acquire or hold a product, you should consider the appropriateness of the information based on your own objectives,
financial situation or needs or consult a professional adviser. You should also consider the relevant Information Memorandum (IM)
and or Product Disclosure Statement (PDS) which is available on the BFML website, bennelongfunds.com, or by phoning 1800 895
388 (AU) or 0800 442 304 (NZ). Information about the Target Market Determinations (TMDs) for the Bennelong Funds is available
on the BFML website. BFML may receive management and or performance fees from the Bennelong Funds, details of which are
also set out in the current IM and or PDS. BFML and the Bennelong Funds, their affiliates and associates accept no liability for any
inaccurate, incomplete or omitted information of any kind or any losses caused by using this information. All investments carry
risks. There can be no assurance that any Bennelong Fund will achieve its targeted rate of return and no guarantee against loss
resulting from an investment in any Bennelong Fund. Past fund performance is not indicative of future performance. Information is
current as at the date of this document. 4D Infrastructure Pty Ltd (ABN 26 604 979 259) is a Corporate Authorised Representative
of BFML.
Infrastructure, interest rates & inflation 14 Appendix – detailed case study results and analysis Case study 1: pure User Pay asset – Transurban Group (TCL-AU) Transurban Group is Australia’s largest privately-owned toll road developer, owner and operator. The company has a presence in 5 markets across Australia and North America, with interests in 23 concessions within Sydney, Melbourne, Brisbane, the Greater Washington Area and Montreal. TCL has a significant pipeline in development and delivery across these jurisdictions, requiring deployment of capital and debt over the near to medium term. Its existing network has an average remaining concession life of ~30 years. TCL has a somewhat unique portfolio of assets whereby, depending on the concession, annual toll increases may allow for inflation (typical for road concessions), the higher of an agreed percentage (4%) or actual inflation, or a fixed increase (4.25%). The latter two tolling arrangements are particularly attractive, as in low inflation environments tolls still move up by 4-4.25% pa. In the Test Case scenarios, we analysed the impact of increases to both government bond yields and inflation in all 3 of Transurban’s geographic markets (Australia, United States & Canada). The results are summarised in Table 4 below, illustrating the impact on TCL’s forecasted proportional revenues, EBITDA and earnings. We also highlight the valuation implications from such scenarios. In high inflation environments, inflation is fully passed through in all but 2 concessions which have the fixed cap 6. The vast majority of these concessions stipulate that tolls cannot be lowered as a result of deflation. Historically, traffic growth has been relatively predictable and collectively, as a network, has outpaced GDP growth. 6 Source: Transurban, FY21 Results Presentation, August 2021
Infrastructure, interest rates & inflation                                                                              15

                          Table 4: Transurban (TCL AU) – current price A$14.00

                                  Base Case               Test Case 1        Variation        Test Case 2         Variation

                                                                                              Sharp spike in
                                 Current 4DI        Inflation and interest
                                                                                         inflation and interest
                                  forecasts         rates 2% above Base
                                                                                               rates with a
                                (inflationary          Case for 3 years      % change                             % change
                                                                                           sustained up-tick in
                                  pressure           before reverting to
                                                                                            both at 1% above
                                 temporary)         long-term averages
                                                                                          long-term averages
Year 1 (A$m)
Revenue                            2,706.8                 2,725.3            0.68%             2,734.6            1.03%
EBITDA                             1,943.9                 1,955.3            0.58%             1,961.0            0.88%
NPAT                               -483.7                  -473.1             2.20%             -467.5             3.35%
Year 2 (A$m)
Revenue                            3,307.2                 3,353.5            1.40%             3,376.9            2.11%
EBITDA                             2,515.9                 2,542.6            1.06%             2,556.1            1.60%
NPAT                                33.3                    52.0             56.36%               68.0            104.36%
Year 3 (A$m)
Revenue                            3,724.9                 3,800.7            2.03%             3,839.6            3.08%
EBITDA                             2,893.9                 2,937.9            1.52%             2,960.5            2.30%
NPAT                                327.4                   357.1             9.08%              383.2            17.04%
Valuation 5-year IRR %             10.29%                  10.01%             -0.28%            11.40%             1.11%
Source: 4D Infrastructure forecasts as at 30 Sept 2021
* Note 1: Year 1, 30 June 2022
** Note 2: Proportional Revenue, EBITDA & Earnings Used

•    Revenues
Assuming no changes to traffic forecasts in the Test Case scenarios, a two percentage point increase in
inflation provides a minor benefit to proportional revenues in each year. The forecasted proportional
revenues increase because in approximately 60% of TCL’s toll road concessions (~45% of FY22e
proportional revenues) they pass through inflation increases via toll escalations. On the other 40% of TCL’s
road concessions (~55% of FY22e proportional revenues) they have the right to increase tolls by the higher
of an agreed percentage (4-4.25%), or actual inflation. In Test Case 2, inflation doesn’t exceed the higher of
4% or 4.25%, limiting the operational upside relative to Base Case for 55% of revenues. In Test Case 2 they
benefit from the inflation uptick on all but 2 concessions which have capped increases.

•    EBITDA
While the revenue uptick is capped as discussed above, the opex reflects the full pass through of inflation.
This translates into proportional EBITDA improvement, but EBITDA margin contraction relative to our Base
Case. This is attributable to the majority of proportional revenues being derived from concessions which
already have toll escalations at an agreed percentage in excess of inflation. There is no change to the tolls
on these concessions relative to our Base Case as a result of the inflation increase per the test scenarios.
That is, TCL’s Base Case already factors in a CPI + toll hike.

•    Net income
The earnings growth reflects TCL’s strong operational leverage as the EBITDA increases flow through to the
bottom line, partly offset by slight increases in interest costs. In the near-to-medium term, an increase in
Treasury yields has little implication for TCL’s existing debt and interest expense profile, as 99.8% of TCL’s
debt is interest rate hedged (30 June 2021). The only impact to earnings comes from new debt issues at a
higher cost.
Infrastructure, interest rates & inflation 16 Over the longer term as debt matures and rolls over, in Test Case 2 interest rates will be higher than currently forecast, but this is more than offset by the improved operational leverage. • IRR valuation In terms of valuation impact, Test Case 1 reduces the 5-year IRR valuation by ~28bps. This is attributable to the higher equity discount rate, valuing cashflows that are boosted only in the interim before reverting to long-term averages. However, in Test Case 2 of sustainably higher inflation and interest rates, valuations increase despite the cost of equity increasing by 1%. This is due to the higher long-term cash flows mitigating the higher discount rate. • TCL conclusion Evident through our case study analysis, as a User Pays asset with concession contracts stipulating the pass- through of inflationary fluctuations (or higher), Transurban is relatively shielded from interest rates/inflation increases over time. Inflation increases have a positive impact on earnings and operational leverage outweighs interest rate increases over the longer term, whilst in a deflationary environment the majority of concessions are protected by either a pre-agreed percentage increase or nil floor. Case study 2: nominal return Regulated Utility – CMS Energy (CMS-US) CMS is a regulated Utility with a single operating jurisdiction in Michigan, USA. CMS, like the majority of US regulated Utilities, operates under a nominal return regulatory model. It has the ability to file regulatory rate cases to recover costs and investment as required, but historically filed every 2-3 years. Post the filing of a rate case, the regulator, the Michigan Public Service Commission (MPSC), usually takes approximately 12 months to complete a review of the filing and adjusts customer rates accordingly. Power and fuel costs are updated and recovered automatically on an annual basis. In the test case scenarios, we have assumed that it would take 2 years for CMS to recover increasing O&M costs (from inflation) in customer bills. The increase in inflation and base Treasury bond yields would also put significant upward pressure on customer bills, impacting affordability. As a result, the likelihood of the MPSC allowing debt and equity returns to increase by the full increase in base Treasury yields is likely to come under scrutiny, particularly assuming the very sharp move of >3-4 percentage points 7 since the last regulatory rate review in late 2020. To represent this, we have assumed that the allowed return on equity and allowed cost of debt stays constant over the 2021-2025 period, although in reality there could be upside to this assumption. We have allowed benign increases in allowed regulatory returns in later years, in line with the increase in long-term base rates. In reality, pressure from increasing inflation and base Treasury yields is not applied to company earnings ceteris paribus. In this inflationary environment, the economy is likely growing strongly. Regulatory bodies may have less concern regarding customer affordability, and therefore be more open to passing through increasing base rates to allowed regulatory returns. As such, we believe our analysis is a worst case regulatory outcome for the scenarios in play. 7 Test Cases assumes US Treasury yields of 4.1-5.1% pa at the time of regulator rate case submission compared to 0.9% pa when the allowed ROE was set in 2020.
Infrastructure, interest rates & inflation                                                                                      17

                            Table 5: CMS Energy (CMS US) – current price US$59.73

                                     Base Case               Test Case 1          Variation         Test Case 2           Variation

                                     Current 4DI         Inflation and interest                Sharp spike in inflation
                                    assumptions          rates 2% above Base                  and interest rates with a
                                    (inflationary           Case for 3 years      % change    sustained up-tick in both   % change
                                      pressure            before reverting to                  at 1% above long-term
                                     temporary)          long-term averages                          averages
Year 1 (US$m)
Revenue                                  6,895                   6,900              0.07%              6,902                0.10%
EBITDA                                   2,679                   2,649             -1.11%              2,634               -1.67%
NPAT                                      751                     714              -5.01%               702                -6.58%
Year 2 (US$m)
Revenue                                  7,108                   7,119              0.16%              7,125                0.24%
EBITDA                                   2,893                   2,832             -2.11%              2,801               -3.18%
NPAT                                      850                     767              -9.69%               743               -12.58%
Year 3 (US$m)
Revenue                                 7,321                   7,125               1.37%              7,472                2.07%
EBITDA                                  3,104                   3,092              -0.40%              3,086               -0.61%
NPAT                                     941                     881               -6.46%               845               -10.27%
Valuation 5-year IRR %                  16.4%                   14.5%              -1.90%              13.7%               -2.71%
    Source: 4D Infrastructure forecasts as at 30 Sept 2021

•      Revenues
The increase in inflation in both Test Cases doesn’t change revenues from the regulated business of CMS in
the years of 2022 and 2023, with the only improvement driven from CMS’ small unregulated business.
Regulated revenue in 2024 increases to facilitate the recovery of increased O&M expenses through
customer bills as the regulatory rate case filing is implemented.

•      EBITDA
The increases in inflation are reflected in O&M expenses from 2022. Revenues are not adjusted to account
for this increase in costs until 2024. EBITDA therefore falls in 2022-23. With the adjustment to revenues,
EBITDA in 2024 recovers to near Base Case levels.

•      Net income
In 2022 and 2023 the increases to inflation and base Treasury yields combine to reduce net income against
the Base Case scenario. This incorporates the adjustments made to EBITDA driven by the increase in
inflation, combined with increases in cost on the issuance of new debt, with existing debt not impacted due
to its fixed interest cost nature. Revenues in 2024 have been adjusted to recover the increased O&M
expenses, but not the increase in new debt finance costs, resulting in under-recovery of interest expense
compared to the Base Case scenario – with net income underperforming the Base Case.

•      IRR valuation
In terms of valuation impact, the test cases reduce the 5-year IRR valuation. This is the combination of the
cashflow impacts (short term in Test Case 1 and longer term in Test Case 2) together with the higher
discount rate to value cashflows discussed above in the ‘Analytical framework’ section.
Infrastructure, interest rates & inflation 18
• CMS conclusion
The scenario analysis shows that the earnings of nominal return Utilities are likely to be negatively
impacted by rising inflation and interest in the short term due to delays in recovery through updated
regulatory assessments. Longer-term regulatory bodies should allow companies to recover increased costs
due to inflation from customer bills – although it’s unclear whether customer affordability will inhibit
regulators from allowing companies to increase their regulatory return levels in line with increasing base
interest rates. We have conservatively assumed that this will be moderated by regulators, negatively
impacting valuations due to increasing valuation discount rates. As such, there is potential upside for
Utilities to the degree that they are allowed to pass through their increased funding costs to customers.
Further, history suggests that the market over-reacts to interest rate shifts and these stocks end up over
sold relative to the valuation impact, which could provide a buying opportunity.
Case study 3: real return Regulated Utility – SNAM (SRG-IM)
SNAM is a Regulated Utility controlling the largest gas transport network in Europe. Its core assets are in
Italy where it is responsible for gas transmission, storage and regasification activities. Outside Italy it owns
stakes in gas infrastructure assets across Europe and the Middle East.
Italian Utilities like SNAM are typically insulated (and can actually benefit) from inflation as they operate
under a real return framework. This means annual inflation indexation is applied to the regulated asset
base on which a real return is earned. Returns are determined under a 6-year WACC regulatory period, with
an interim adjustment on several parameters every 3 years. There are also separate regulatory periods of
between 4-6 years. Each regulatory period defines the broader tariff framework including incentives.
Allowed opex is determined at the start of the regulatory period and is adjusted for inflation less an
efficiency factor.
Table 6: SNAM (SRG IM) – current price €4.80
Base Case Test Case 1 Variation Test Case 2 Variation
Current 4DI Inflation and interest Sharp spike in inflation
assumptions rates 2% above Base and interest rates with
(inflationary Case for 3 years % change a sustained up-tick in % change
pressure before reverting to both at 1% above long-
temporary) long-term averages term averages
Year 1 (€$m)
Revenue 2,767 2,762 -0.17% 2,760 -0.25%
EBITDA 2,236 2,231 -0.25% 2,228 -0.38%
NPAT 1,067 1,054 -1.23% 1,051 -1.52%
Year 2 (€$m)
Revenue 2,843 2,864 0.72% 2,874 1.08%
EBITDA 2,321 2,339 0.80% 2,349 1.21%
NPAT 1,099 1,097 -0.21% 1,103 0.39%
Year 3 (€$m)
Revenue 2,912 2,969 1.95% 2,998 2.96%
EBITDA 2,403 2,454 2.12% 2,480 3.21%
NPAT 1,129 1,129 0.04% 1,158 2.60%
Valuation 5 year IRR % 13.1% 12.5% -0.64% 15.8% 2.66%
Source: 4D Infrastructure forecasts as at 30 Sept 2021Infrastructure, interest rates & inflation 19 • Revenues There is a small increase in revenues in both test cases as the higher inflation supports growth in the asset base. The unregulated business in the near term has a faster growth trajectory independent of inflation and so isn’t impacted by the change in inflation in the near term. • EBITDA The increase in inflation is reflected in expenses, with a similar impact as revenues. We are conservative in our estimates in assuming margins in the regulated business stay constant and SNAM doesn’t outperform its allowed opex. At the same time, EBITDA margins are slightly impacted as SNAM faces more competition in its unregulated/new businesses. • Net income The increases to inflation and bond yields have a small impact on interest costs as the cost of new debt becomes more expensive. Nevertheless, the company has strong financing in place with a large proportion of fixed rate debt at very low rates, so the impact on earnings is again minimal. Currently the company has an average debt maturity of ~6 years at an average cost of less than 1%, which is amongst the lowest in the industry. • IRR valuation In terms of valuation impact, in Test Case 1 the 5-year IRR valuation reduces by ~64bps. This is attributable to a higher discount rate in an environment where inflation reverts to long-term averages. As the long-term cashflows are largely unaffected from the change in variables, the only real valuation change comes from the increasing discount rate. In the Test Case 2 scenario of sustained higher inflation and interest rates, the 5-year IRR valuation increases by ~260bps. The ongoing inflation adjustment in the RAB over the long term supersedes the impact of increased funding costs and higher discount rate used in the valuation. • SRG conclusion The scenario analysis above supports our assertion that increases in inflation and Treasury bond yields will more negatively impact the earnings (as measured by EBITDA and net income) of nominal return Utilities compared to real return Utilities in the short term. Over the long term, the impact will be influenced by how direct the link is between regulatory returns and macro data points and the ability for the Utilities to fully pass on the economic shifts in a timely manner. The valuation of nominal return Utilities is impacted by the increase in assumed future interest expenses (current debt costs are hedged), but more significantly so from the increase in discount rate used to value cashflows. These impacts are only partially offset by an increase in allowed regulatory returns in the longer term as they have historically proven to be somewhat inelastic to increases/decreases in base Treasury yields. This has benefited in an interest rate declining environment, but will now be a headwind in an interest rate rising environment. By contrast, the real return Utilities tend to have a more fluid and direct link to economic data points which automatically flow through into returns and resets, allowing them to more quickly adjust to a new environment (both positively and negatively).
You can also read