REPLY TO JANSSEN, H. COMMENT ON "CABRERA ET AL. A USER-FRIENDLY TOOL TO CHARACTERIZE THE MOISTURE TRANSFER IN POROUS BUILDING MATERIALS: FLOW1D ...
←
→
Page content transcription
If your browser does not render page correctly, please read the page content below
applied
              sciences
Reply
Reply to Janssen, H. Comment on “Cabrera et al. A
User-Friendly Tool to Characterize the Moisture Transfer in
Porous Building Materials: FLoW1D. Appl. Sci. 2020, 10, 5090”
Virginia Cabrera , Rubén López-Vizcaíno * , Ángel Yustres *, Miguel Ángel Ruiz, Enrique Torrero
and Vicente Navarro

                                            Department of Civil Engineering and Construction, Institute of Technology, Universidad de Castilla-La Mancha,
                                            Campus Universitario s/n, 16071 Cuenca, Spain; virginia.cabrera@uclm.es (V.C.); miguel.ruiz@uclm.es (M.Á.R.);
                                            enrique.torrero@uclm.es (E.T.); vicente.navarro@uclm.es (V.N.)
                                            * Correspondence: ruben.lopezvizcaino@uclm.es (R.L.-V.); angel.yustres@uclm.es (Á.Y.)

                                            1. Introduction
                                                 A significant part of the critical comments by Prof. Janssen, in relation to the work
                                            presented in [1], are based on an assessment of statements that are not really made in the
                                            latter work. As it is scientifically inconsistent to discuss issues that one has not stated,
                                            the present reply is based on analysing the only three issues raised by Prof. Janssen that
                                            are very critical to [1]: the scope of the van Genuchten–Mualem model, the capabilities of
                                            FloW1D, and the validity of the parameter estimations presented in [1].

                                     2. Discussion
Citation: Cabrera, V.; López-Vizcaíno,      2.1. The Van Genuchten–Mualem Model
R.; Yustres, Á.; Ruiz, M.Á.; Torrero, E.;
                                                  First, Prof. Janssen claims that [1] is invalid because the hygric properties of porous
Navarro, V. Reply to Janssen, H.
                                            building materials cannot be described by unimodal van Genuchten–Mualem equations.
Comment on “Cabrera et al. A
                                            While the authors of the present reply do not feel able to reduce the scope of the van
User-Friendly Tool to Characterize
                                            Genuchten–Mualem equations as drastically as [1] does, it is agreed that the model has
the Moisture Transfer in Porous
                                            limitations. Consequently, nowhere in [1] is it stated that the van Genuchten–Mualem equa-
Building Materials: FLoW1D. Appl.
                                            tions constitute the conceptual framework containing the complete universal behaviour of
Sci. 2020, 10, 5090”. Appl. Sci. 2022,
12, 1124. https://doi.org/10.3390/
                                            porous building materials. They are simply a tool included in the formulation presented
app12031124
                                            in [1]. Believing that these equations are a panacea for any conceptual characterisation is
                                            contrary to the work presented in [1], which focuses on providing a simple tool (FloW1D)
Received: 16 December 2021                  that can be easily adapted to improve the interpretation of water absorption by capillarity
Accepted: 4 January 2022
                                            (WAC) tests. Additionally, a strategy of simplicity is adopted, as repeatedly stated in [1]:
Published: 21 January 2022
                                            “(allow) the users to modify the code according to their needs” modifying, for example, the
Publisher’s Note: MDPI stays neutral        implemented functions. The adaptivity of FloW1D and its ultimate cause, is contrary to the
with regard to jurisdictional claims in     dogmatism imputed to us.
published maps and institutional affil-
iations.                                    2.2. The FLoW1D Model
                                                  Secondly, the low computational efficiency of FLoW1D is raised by Prof. Janssen. This
                                            is true, and it is to be expected. The computational simplicity, and the use of a spreadsheet
                                            as the interface for implementation, comes at a cost in numerical terms. That is why the
Copyright: © 2022 by the authors.
                                            only scope explicitly given to FloW1D in the conclusions of [1] is the analysis of WAC tests.
Licensee MDPI, Basel, Switzerland.
                                            In no case does it pretend to be a general simulation tool. However, FloW1D does allow
This article is an open access article
                                            for the confident simulation of WAC tests. The tremendous simplicity of FloW1D is the
distributed under the terms and
                                            source of its robustness (only for this question, the expression “robustness” is applied in [1]
conditions of the Creative Commons
Attribution (CC BY) license (https://
                                            to qualify its ability to solve simulations of WAC tests). Logically, in an explicit method,
creativecommons.org/licenses/by/
                                            the robustness is conditioned by the size of the spatial grid and the maximum time step
4.0/).                                      selected. Thus, the case identified as “variant 1” by Prof. Janssen, as an example of the

Appl. Sci. 2022, 12, 1124. https://doi.org/10.3390/app12031124                                                  https://www.mdpi.com/journal/applsci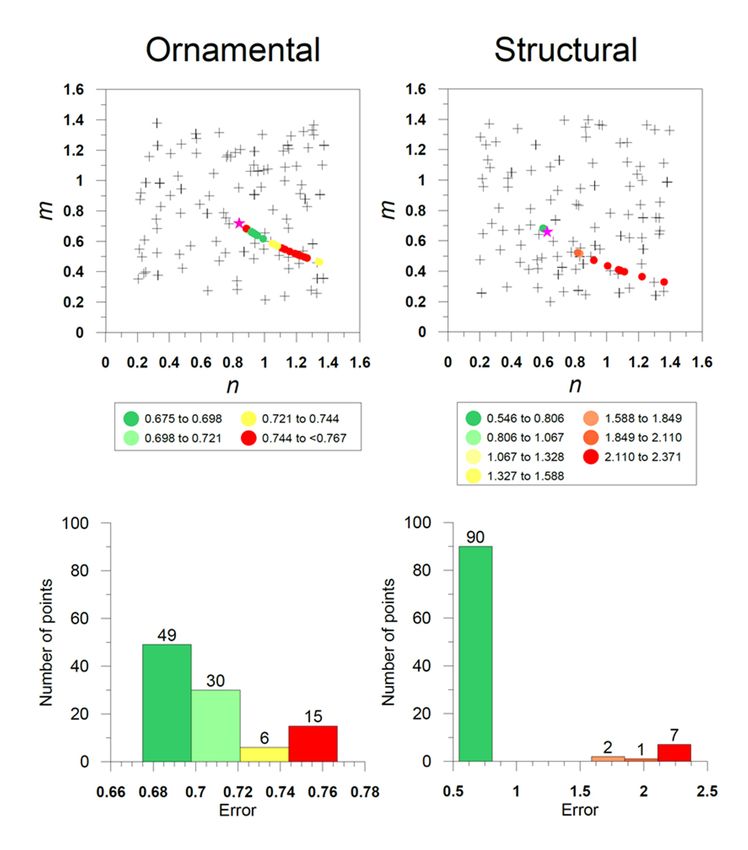
Appl. Sci. 2022, 12, x FOR PEER REVIEW 2 of 5
Appl. Sci. 2022, 12, 1124 2 of 5
time step selected. Thus, the case identified as “variant 1” by prof. Janssen, as an example
of the malfunctioning
malfunctioning of FloW1D,
of FloW1D, prof. Janssen
Prof. Janssen changes
changes from from solution
solution 1 presented
1 presented to so- 2
to solutions
lutions 2 and400
and 3 when 3 when
and 800400nodes
and 800 arenodes
used, are used, respectively,
respectively, instead ofinstead of 100
100 nodes nodes1).(Fig-
(Figure Users,
ure 1). Users,
as stated as stated
in Section 3.2inofSection 3.2 ofadjust
[1], should [1], should adjust
the grid sizethe grid sizetoaccording
according to their
their problem. The
problem.
robustnessThe robustness by
is evidenced is evidenced by the
the fact that, evenfact that,Janssen
Prof. even prof.
usedJanssen
the poorused theFloW1D
grid, poor
grid,able
was FloW1D was able
to provide to provide a solution.
a solution.
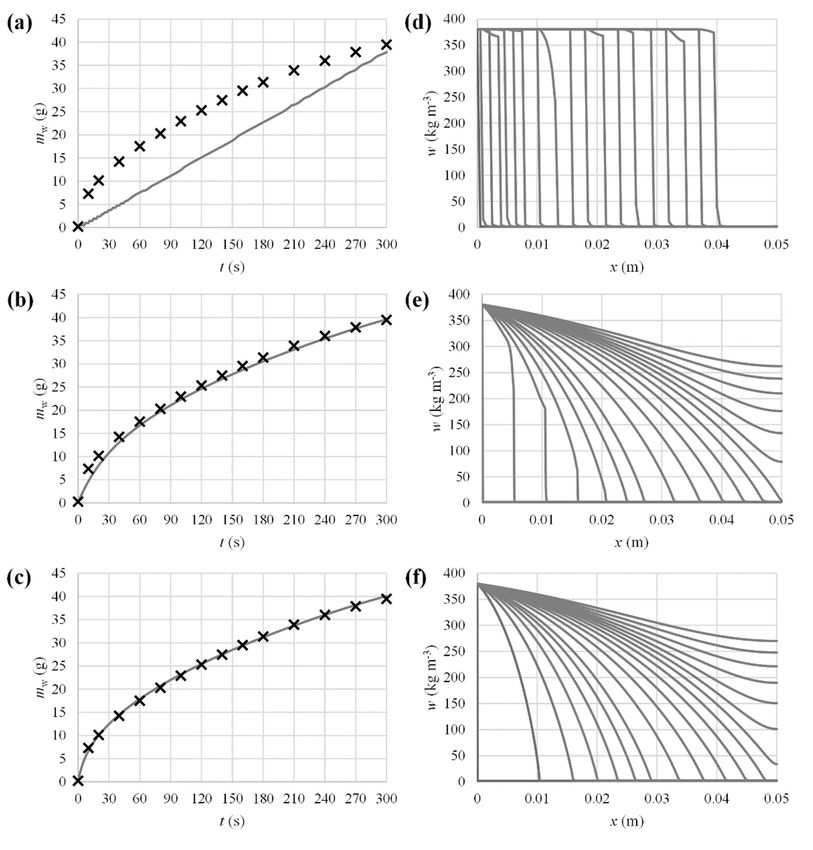
Figure 1. (Left panel) Evolution of the cumulative water mass in for: (a) 100 nodes, (b) 400 nodes and
Figure 1. (Left panel) Evolution of the cumulative water mass in for: (a) 100 nodes, (b) 400 nodes
(c) 800 nodes. Markers, experimental data; solid line, FLoW1D results. (Right panel) Moisture content
and (c) 800 nodes. Markers, experimental data; solid line, FLoW1D results. (Right panel) Moisture
isochrones
content (w) obtained
isochrones with FLoW1D
(w) obtained for: (d)for:
with FLoW1D 100(d)nodes, (e) 400
100 nodes, (e)nodes and (f)
400 nodes and800
(f) nodes. Times:
800 nodes.
10 s for10
Times: thes first minute
for the and 20 sand
first minute for 20
thesnext fournext
for the minutes. Using the
four minutes. parameters
Using of OPS limestone,
the parameters of OPS
limestone,
variant 1 isvariant 1 isTable
given in given1 in Table
from the1critical
from the critical comments
comments by prof. Janssen.
by Prof. Janssen.
Moreover, the
Moreover, thescientific
scientificcommunity
community is is familiar
familiar with
with thethe
Excel Excel © spreadsheet,
© spreadsheet, and
and it
it aware
is is aware of the
of the scope
scope andand limitations
limitations of itsof its Solver
Solver Add-in
Add-in for dealing
for dealing with parameter
with parameter esti-
estimation
mation problems.
problems. BecauseBecause of in
of this, this,
theinfinal
the sentence
final sentence
of [1], of [1],
it is it is stated
stated quite clearly
quite clearly that
that Excel
Excel © + FLoW1D
© + FLoW1D shouldshould
be used befor
used for environments
environments such as such
thoseas those presented
presented in our
in our work.
work.
The aim of [1] is not to take a fundamental step in the “total” characterisation of building of
The aim of [1] is not to take a fundamental step in the “total” characterisation
building materials.
materials. It is onlyto
It is only intended intended
facilitatetothe
facilitate
work inthe work in laboratories
laboratories by helping to byimprove
helping to
improve
the the interpretation
interpretation of WAC tests.of WAC tests.
2.3. Parameter
2.3. ParameterEstimation.
Estimation
Finally, the quality of the parameter estimation made in [1] is questioned by Prof.
Janssen. Potential users of FLoW1D work in laboratories are already used to testing porousAppl. Sci. 2022, 12, x FOR PEER REVIEW 3 of 5
Appl. Sci. 2022, 12, 1124 3 of 5
Finally, the quality of the parameter estimation made in [1] is questioned by prof.
Janssen. Potential users of FLoW1D work in laboratories are already used to testing po-
rous building
buildingmaterials.
materials. Therefore,
Therefore, their their experience
experience (an (an important
important partpart of
ofthethe“soft
“softinformation”
infor-
mation” that is so relevant for solving inverse problems) allows them to distinguish
that is so relevant for solving inverse problems) allows them to distinguish which of the which
of the mathematically
mathematically possible
possiblesolutions
solutionsare arephysically
physicallyplausible
plausible(a(acondition
conditionthatthatisisnotnotmet by
met bythethevalues
valuesproposed
proposedininthe thevariant
variant parametrizations
parametrizations of of Table
Table 11 of the critical com-
of the critical comments
mentsby byProf.
prof.Janssen).
Janssen).However,
However,ititisisnecessary
necessarytotodescribe
describeininmore
moredetail
detail how
how thethe pa-
parameters
rameters presented
presented in Table
in Table 3 of 3[1]ofwere
[1] were estimated.
estimated.
As suggested in , it is
As suggested in,not
it ispossible to obtain
not possible three three
to obtain parameter valuesvalues
parameter from afrom
series of
a series of
water water
mass data which, when plotted against the square root of time, fall
mass data which, when plotted against the square root of time, fall on a straighton a straight line
passing through
line passingthethrough
coordinate origin. Thisorigin.
the coordinate line is univocally
This line isdefined by a single
univocally defined param-
by a single
eter—its slope. For this
parameter—its reason,
slope. Forifthis
we plot the if
reason, error
we surfaces (sum surfaces
plot the error of the squared
(sum of errors of
the squared
the model
errors versus
of thethemodel
experimental
versus the values) when one values)
experimental of the three
when estimated
one of theparameters is
three estimated
fixed and the otheristwo
parameters fixedare varied,
and we obtain
the other two are thevaried,
resultsweshown
obtain in the
Figure 2. Itshown
results can be in seen
Figure 2.
that around
It can the valuethat
be seen of the estimated
around values
the value of in
theour previousvalues
estimated work [1] (marked
in our with work
previous an [1]
asterisk in Figure 2) there are elongated valleys, especially in the intrinsic
(marked with an asterisk in Figure 2) there are elongated valleys, especially in the intrinsicpermeability
direction. This indicates
permeability a strong
direction. Thiscorrelation
indicatesbetween
a strongparameters
correlationand the ill-posed
between parametersnature and the
of the ill-posed
problem, nature
as noted of by
theprof.
problem, as noted
Janssen. Becauseby of
Prof.
thisJanssen. Because
fact, there of thiscombina-
are several fact, there are
several
tions of combinations
parameter values that of parameter values
offer virtually thethat
same offer virtually
level of error.the same level of error.
FigureFigure
2. Error2.surfaces for both
Error surfaces forlithotypes and two-by-two
both lithotypes combinations
and two-by-two of theofparameters
combinations (keep-
the parameters (keeping
ing thethe
other oneone
other constant).
constant).
However,However, the authors,
the authors, as shown
as shown in carried
in [2], [2], carried
out out a forced
a forced infiltration
infiltration test
test to to determine
deter-
the intrinsic
mine the intrinsic permeability
permeabilityofofthethematerials
materialsand and this
this greatly
greatly reduced
reduced thethe uncertainty of
uncertainty
parameter
of parameter identification.
identification. Given
Given thatthe
that therange
rangeofof variation
variation of the parameterKKwas
the parameter wasknown
known for the two lithotypes, the initial points for the minimisation algorithm were close to the
for the two lithotypes, the initial points for the minimisation algorithm were close
to the mean
meanvalue
valueof ofKKdetermined
determinedin inthe
theinfiltration
infiltrationtests.
tests. The
Theconvergence
convergence towards
towardsaasingle
singleminimum
minimum is clear and
is clear and persistent,
persistent,as ascan
canbebeseen
seeninin Figure
Figure 3. 3.
ByBy fixing
fixing K the
K to to the values of
values
−13 and 8.38−15× 10
1.2710×−1310and −15 2 (see Table 3 of [1]) for the ornamental and structural
of 1.27× 8.38× 10 m2 (seemTable 3 of [1]) for the ornamental and structural
lithotype, respectively, the same minimum is attained in most cases, and is always very
close to the values estimated in [1].Appl. Sci. 2022, 12, x FOR PEER REVIEW 4 o
Appl. Sci. 2022, 12, 1124 lithotype, respectively, the same minimum is attained in most cases, and4isof always
5 ve
close to the values estimated in [1].
Figure 3. Results of the minimization algorithm (coloured dots) when starting at 100 different points
(black crosses). Figure 3. Results
The colour scaleofshows
the minimization algorithm
the error value (coloured
associated dots)
with eachwhen starting
point. at 100star
The pink different poin
(black
indicates the vector crosses). The
of estimated colour scale
parameters shows
in [1]. the errorofvalue
Histograms associated
the errors with
of each each point.
minimum The pink st
point.
indicates the vector of estimated parameters in [1]. Histograms of the errors of each minimum poi
As a consequence of this process, the authors of [1] found that the estimated value of
K and the mean value As aofconsequence of this results
the experimental process,ofthe
[2]authors of [1] found
were similar; that the
therefore, estimated
they gave value
K and the mean value of the experimental
reliability to the estimate made (as explained in detail in [2]). results of [2] were similar; therefore, they ga
reliability to the estimate made (as explained in detail in [2]).
2.4. Additional Remarks
2.4. Additional Remarks.
Finally, some remarks made by Prof. Janssen, can be also discussed. It is necessary to
point out that thereFinally,
is a typo some remarks (9)
in Equation made by prof.
of [1], which,Janssen, can be also
unfortunately, discussed.
was propagatedIt isto
necessary
Equation (A9). However, as Prof. Janssen was able to verify (readers can also do so, becausepropagat
point out that there is a typo in Equation (9) of [1], which, unfortunately, was
FLoW1D is freely to Equation
available [A.9].
in theHowever, as prof. Material
Supplementary Janssen was ablethe
of [1]), to verify (readers
typo did can also do s
not affect
because FLoW1D is freely available in the Supplementary
FLoW1D, where the water vapour flow was properly implemented. It is also interesting Material of [1]), the typo d
to note that the inconsistency raised by Prof. Janssen after its Equation (6), disappeared
when, instead of assuming that a good part of the retention capacity of the material was
between 103.5 Pa and 106.5 Pa of suction, it was considered to be between 104 and 106
Pa. However, claiming that the values in Table 3 of [1], associated with an estimation
aiming to stimulate a macroscopic flow, provide parameters that reproduce the topologicalAppl. Sci. 2022, 12, 1124 5 of 5
structure of the material’s microstructure is perhaps too ambitious. Additionally, the greater
representativeness that Prof. Janssen gives to capillary pressure compared to suction is
debatable. Additionally, the extent to which the tortuosity values are incorrect could also
be analysed, given the vapour transport enhancement mechanisms described and analysed
in the literature [3,4].
3. Conclusions
With this reply, the scope of [1] is clarified and the conception of Prof. Janssen is
shown. As discussed in [1], it is again shown that FLoW1D is a useful tool for the analysis
of WAC tests.
Author Contributions: V.C.: writing—original draft, methodology, software; R.L.-V.: writing—original
draft, methodology, software; Á.Y.: writing—review & editing, conceptualization, methodology; M.Á.R.:
data curation, investigation, resources; E.T.: data curation, investigation, resources; V.N.: writing—review
& editing, supervision. All authors have read and agreed to the published version of the manuscript.
Funding: This research received no external funding.
Institutional Review Board Statement: Not applicable.
Informed Consent Statement: Not applicable.
Data Availability Statement: Not applicable.
Conflicts of Interest: The authors declare no conflict of interest.
References
1. Cabrera, V.; López-Vizcaíno, R.; Yustres, Á.; Ruiz, M.Á.; Torrero, E.; Navarro, V. A User-Friendly Tool to Characterize the Moisture
Transfer in Porous Building Materials: FLoW1D. Appl. Sci. 2020, 10, 5090. [CrossRef]
2. Cabrera, V.; Yustres, Á.; López-Vizcaíno, R.; Merlo, Ó.; Ruiz, M.Á.; Torrero, E.; Navarro, V. Determination of the hygric properties
of the heritage stone of the Cathedral of Cuenca through the water absorption by capillarity test. J. Cult. Herit. 2021, 48, 186–195.
[CrossRef]
3. Ho, C.K.; Webb, S.W. Review of porous media enhanced vapor-phase diffusion mechanisms, models, and data—Does enhanced
vapor-phase diffusion exist? J. Porous Media 1998, 1, 71–92. [CrossRef]
4. Shahraeeni, E.; Or, D. Pore scale mechanisms for enhanced vapor transport through partially saturated porous media. Water
Resour. Res. 2012, 48. [CrossRef]You can also read