REVISION 1 Regional Waste ManageMent - North East Waste 2017
←
→
Page content transcription
If your browser does not render page correctly, please read the page content below

N O R T H E A S T WA S T E - 2 0 1 7 - R E G I O N A L WA S T E M A N A G E M E N T S T R AT E G Y | 1

Regional Waste Management                                       REVISION 1
                   Strategy
           North East Waste                                      2013-21

                                                                                                       2017
N O R T H E A S T WA S T E - 2 0 1 7 - R E G I O N A L WA S T E M A N A G E M E N T S T R AT E G Y | 2

Contents
           FOREWORD      3

           INTRODUCTION          4

           Key Documents, Drivers and Policy Context 5

           BACKGROUND            7

           Regional Population and Demographic Trends              8
           Existing Waste Services, Infrastructure and Directions          10
           Overview Of Changes            13
           Infrastructure Needs and Planned Infrastructure         16
           Waste And Resource Recovery Tonnage Data                17
           Non-Domestic Waste 18

           Waste Composition     19
           Performance Assessment         21
           Waste Forecasting and Projections      23
           Review Of Programs, Initiatives And Community Expectations              24
           Summary       28
           STRATEGIC DIRECTION            29

           Vision For The Strategy        29
           Key Result Areas and Objectives        29
           Member Council Strategy        34
           IMPLEMENTATION        36

           Action Plan   37
           MONITORING AND EVALUATION              41

           APPENDIX 1     Supporting Data Tables          42
N O R T H E A S T WA S T E - 2 0 1 7 - R E G I O N A L WA S T E M A N A G E M E N T S T R AT E G Y | 3

                                               FOREWORD
                                                                                                                                             Over the past 4 years, under the State Government’s Waste Less Recycle More
                                                                                                                                             initiative, a number of challenges outlined in our original strategy (2013-2017)
                                                                                                                                             have been met. Significant progress has been made in areas such as organics
                                                                                                                                             collection and processing, managing household problem wastes, waste avoidance
                                               North East Waste is a voluntary regional waste group, formed in 1997 and comprising           and improved engagement of the commercial sector. However, many challenges
                                               Ballina, Byron, Clarence Valley, Kyogle, Lismore, Richmond Valley and Tweed                   remain and this updated strategy will build on first stage successes to continue
                                               Councils. In 2013 a Regional Waste Strategy was developed in collaboration with its           to improve our waste management outcomes. New and remaining challenges
                                               member Councils that aimed to set the strategic direction of waste management                 include:
                                               in the region through a coordinated and collaborative approach that optimises our
                                               skills and resource sharing opportunities. It was driven by political, economic and             ▶▶ The predicted pressure from increasing population growth and its
                                               environmental imperatives including the requirements of the State Government                         implications for waste generation, landfill availability and service provision;
                                               initiatives and strategies, the need to protect the environment and the economic                ▶▶ The significant quantities of potentially recyclable materials, including
                                               benefits of sharing resources. These imperatives continue and this updated Strategy                  organics, still present in the residual waste stream;
                                               continues to guide the region in 2017-2021.
                                                                                                                                               ▶▶ Building effective relationships with aboriginal communities to improve
                                               Through this Strategy NE Waste aims to fulfill our objectives and meet targets by:                   waste management outcomes on their lands;
                                                                                                                                               ▶▶ Gaps in    services required to maximise resource recovery across the region,
                                                                                                                                                    particularly in the commercial sector;
                                                     Our vision remains to achieve more sustainable waste
The North East Waste region covers                                                                                                             ▶▶ A lack of commercial sector data and the difficulty of differentiating
                                                     management and better resource recovery in the                                                 commercial from residential data due to current service provision;
almost 21,000 sq kms of land area and
                                                     NE Waste region through a proactive, collaborative                                        ▶▶ The need to ensure regional cooperation while maintaining equity and
has a population of almost 300,000.
                                                     approach with our regional members Councils, the                                               open communication between councils;
The seven member Councils within this                                                                                                          ▶▶ The poor performance of national product stewardship schemes;
                                                     NSW EPA and our community.
region are Ballina, Byron, Clarence Valley,                                                                                                    ▶▶ The diminishing landfill space available in some LGA’s and the difficulties
Kyogle, Lismore, Richmond Valley and                                                                                                                in achieving a regional solution;

Tweed Shire. There are 9 landfill sites,         ▶▶ Delivering targeted and effective projects that engage and build                           ▶▶ The fast changing regulatory environment.
                                                    capacity in our communities to achieve improved waste minimisation and
two recycling facilities, three organics
                                                    management outcomes.                                                                     In order to address these challenges this Strategy will continue to promote a
processing facilities and eleven transfer        ▶▶ Creating strong Council partnerships that allow collaboration and optimize               uniform waste management system across all Councils, enhanced services and
stations situated throughout the region.            resource sharing and funding opportunities.                                              drop off facilities and improved infrastructure, supported by a comprehensive
                                                                                                                                             education and communication program to maximise business and community
                                                 ▶▶ Involving the community through social enterprises and the development of                engagement. We will continue to work closely with the NSW EPA and Federal
                                                    markets in recovered resources.
                                                                                                                                             government to find regional and national solutions to the challenges that face
                                                 ▶▶ Adhering to the principles of sustainability, equity and continuous                      local governments who manage waste.
                                                    improvement.
                                                 ▶▶ Communicating and share our knowledge while striving for leadership and                  Jeanie McKillop
“This strategy has been supported by the NSW        innovation in waste.                                                                     NE Waste Coordinator
Environment Protection Authority (EPA) with
funding from the waste levy.”
N O R T H E A S T WA S T E - 2 0 1 7 - R E G I O N A L WA S T E M A N A G E M E N T S T R AT E G Y | 4

1
INTRODUCTION
This revised Regional Waste Management Strategy was reviewed and developed in consultation with
North East Waste Member Councils. The Strategy draws on our past performance under two regional waste
strategies and reports commissioned to inform our planning. It is also informed by current Regional, State
and National planning instruments and initiatives. Progress made towards fulfilling the original Strategies
objectives are detailed in Section 2.

This acts as a guideline for Councils and a public facing document for those interested in the direction and
activities of North East Waste. The projects and actions outlined may change over time as the planning
horizon it is situated on fluctuates with shifting funding opportunities and new directions.
N O R T H E A S T WA S T E - 2 0 1 7 - R E G I O N A L WA S T E M A N A G E M E N T S T R AT E G Y | 5

   1.1 Key Documents, Drivers and Policy Context

The key documents and programs underpinning this Strategy are the:
       ▶▶ Premiers Priorities in Action to reduce litter by 40% by 2020
       ▶▶ Waste Less Recycle More, NSW EPA
       ▶▶ The Container Deposit Scheme 2017                                                                 Environmental drivers include:
       ▶▶ Improved Waste Management and Increased Engagement with Aboriginal Communities and                       ▶▶ Improving resource efficiency through collaborative efforts
           People Program NSW EPA 2017                                                                             ▶▶ Improving the environmental performance of infrastructure
       ▶▶ NSW 2021: A Plan to make NSW number one (2012)                                                           ▶▶ Protecting the environment and improving sustainability                  through education and
       ▶▶ NSW Waste Avoidance and Resource Recovery (WARR) Strategy 2014-21                                            behaviour change
                                                                                                                   ▶▶ Improving waste management to help mitigate the impact of human induced climate
Several key drivers and trends have been identified that support regional cooperation and the need for an              change.
effective regional waste strategy that is updated and reviewed.
                                                                                                            Legislative Framework
The key political drivers include:
       ▶▶ The need to fulfil diversion targets set under the Draft WARR Strategy 2013-21                    In NSW, waste activities and strategy are primarily governed by the State under the direction of the
                                                                                                            NSW Environment Protection Authority (EPA). Local governments aim to meet State government
       ▶▶ The recognition at different political levels that there is a need and opportunity for regional
                                                                                                            targets and are usually responsible for the collection and disposal of waste. Regional groups of
           cooperation and WLRM 2 funding.
                                                                                                            councils, such as North East Waste, provide support to Councils and help facilitate collaboration and
                                                                                                            resource sharing. At a Federal level there exists a National Waste Policy but the day to day operations
Socio-Economic drivers include:
                                                                                                            of waste management are generally governed at a State and Local Government level. As NE Waste
       ▶▶ The potential to involve the community, provide employment and develop markets through            borders Queensland, the policy direction for waste in that State is also of interest to the group,
           social enterprises in waste                                                                      as several members, through necessity, currently dispose of waste into Queensland landfills. The
       ▶▶ The imperative of resource sharing due to diminishing landfill space                              introduction of a levy or restrictions on imported waste in Queensland could potentially make this
                                                                                                            practice unviable. Other new legislation that will impact on waste management in NSW and also in
       ▶▶ Population growth and seasonal fluctuations within the region impacting on existing waste
                                                                                                            Queensland is the introduction of the Container Deposit Scheme in December 2017. The legislative,
           systems and infrastructure
                                                                                                            regulatory and planning instruments that guide waste are listed below in Figure 1.
       ▶▶ The potential to increase funding opportunities under a regional cooperation model
       ▶▶ The possibility of reducing costs and increasing economies of scale through cooperation and
           joint ventures
       ▶▶ Building regional capacity through knowledge exchange.
N O R T H E A S T WA S T E - 2 0 1 7 - R E G I O N A L WA S T E M A N A G E M E N T S T R AT E G Y | 6

Legislative, regulatory and planning instruments guiding waste in NSW

       ▶▶ Premiers Priorities in Action
       ▶▶ Protection of the Environment Operations (POEO)Act 1997
       ▶▶ Waste Avoidance and Resource Recovery Act 2001
       ▶▶ Waste Avoidance and Resource Recovery Amendment (Container Deposit Scheme) Act 2016
       ▶▶ Protection of the Environment Operations (Waste) Regulation 2015
       ▶▶ NSW Container Deposit Scheme
       ▶▶ NSW Energy from Waste Policy Statement
       ▶▶ NSW Waste Avoidance and Resource Recovery Strategy 2014-21
       ▶▶ Waste Less Recycle More 2014-17 and 2017-21
       ▶▶ Regional Waste Strategies 2013-21

The structure of this plan follows the guidelines provided by the NSW EPA and uses the Key Results areas
identified in the WARR Strategy to guide our choice of outcomes and develop our targets. Under this
umbrella, consultations and analysis have assisted us in redefining our strategic objectives and consolidating
our previous strategy. A series of workshops have been held with key waste management stakeholders
and additional research has been undertaken to support NE Waste in further refining our objectives and
determining the mechanisms for delivery of this Strategy.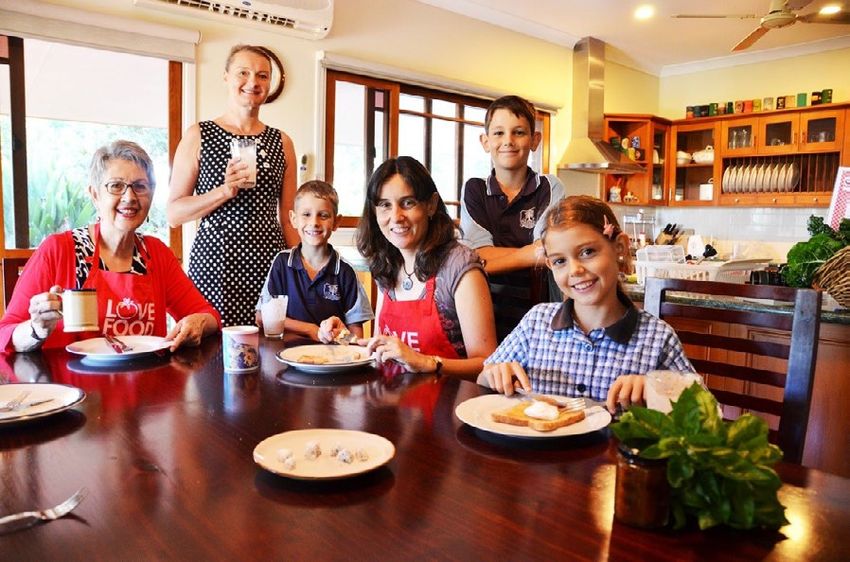
N O R T H E A S T WA S T E - 2 0 1 7 - R E G I O N A L WA S T E M A N A G E M E N T S T R AT E G Y | 7

2
                                                                                     FIGURE 1

                                                                                     Our Region

BACKGROUND
The North East Waste region covers almost 21,000 square kilometres of land area
and has a population of 295,510. The seven member Councils within this region
are Ballina, Byron, Clarence Valley, Kyogle, Lismore, Richmond Valley and Tweed.
Membership of the Voluntary Regional Waste Group, North East Waste, has been
reasonably consistent since its beginnings in 1997, and today all local Councils
are members. NE Waste is governed by a Memorandum of Agreement, with each
Council having a vote and delegate at bi-monthly meetings. It is funded by the NSW
EPA, contributions from Councils and grant funding. A Coordinator manages the
administration of the group, the budget and its projects. Additional coordinators
manage education, business and specialised projects subject to need.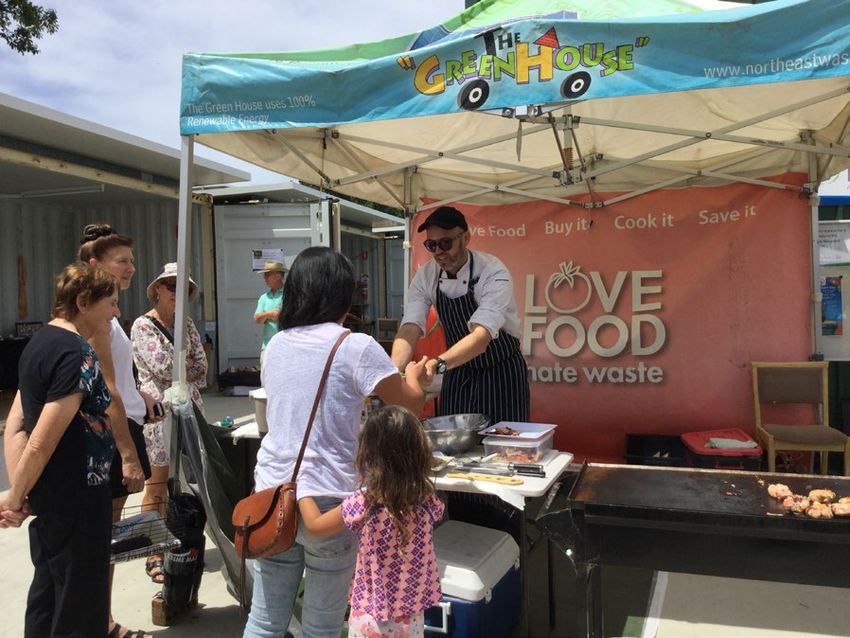
N O R T H E A S T WA S T E - 2 0 1 7 - R E G I O N A L WA S T E M A N A G E M E N T S T R AT E G Y | 8

   2.1 Regional Population and
   Demographic Trends

The North East Waste region has a population density of approximately 14 people per
square kilometre. Compared to many other regional and rural areas of NSW this is relatively
high. It is expected that this will increase with population increase. Figure 2 below provides
the most recent population statistics for our region (2016) by Local Government Area and
the projected populations proposed by the NSW Department of Planning and Environment
www.planning.nsw.gov.au/projections
N O R T H E A S T WA S T E - 2 0 1 7 - R E G I O N A L WA S T E M A N A G E M E N T S T R AT E G Y | 9
Figure 2: Historical (2011 and 2016) and Projected Regional Population Change (2021-2036)
Since 2011 population growth has fluctuated but steadily increased by 6.5% over 5 years. Population projections from the Australian
Bureau of Statistics indicate that further approximate increase of 6% is anticipated by 2021, bringing the regional population to 313,350
Figure 2 Historical (2011 and 2016) and Projected Regional Population Change (2021-2036)
persons. The highest % increase was in the Byron Shire at 12%, the Tweed Shire at 8.6%, followed by Ballina Shire at 6.5%
350,000
300,000
115,350
110,600
105,450
100,000
250,000 92,460
Tweed
85,105
25,350 25,650
RVC
24,300 24,850
200,000
23,181
22,037 51,750
Lismore
49,350 50,700
47,850
44,741
150,000 42,766 9,550
9,650 9,600 Kyogle
9,650
9,537
9,228
55,800 56,800 57,450
54,450
100,000
49,665
51,040 CVC
33,850 35,250 36,650 37,950
Byron
29,209 32,723
50,000
39,274 41,828 43,250 44,300 45,150 45,850
Balina
0
2011 2016 2021 2026 2031 2036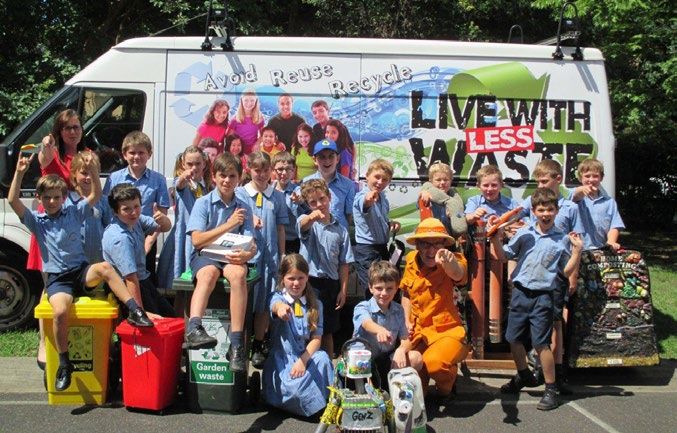
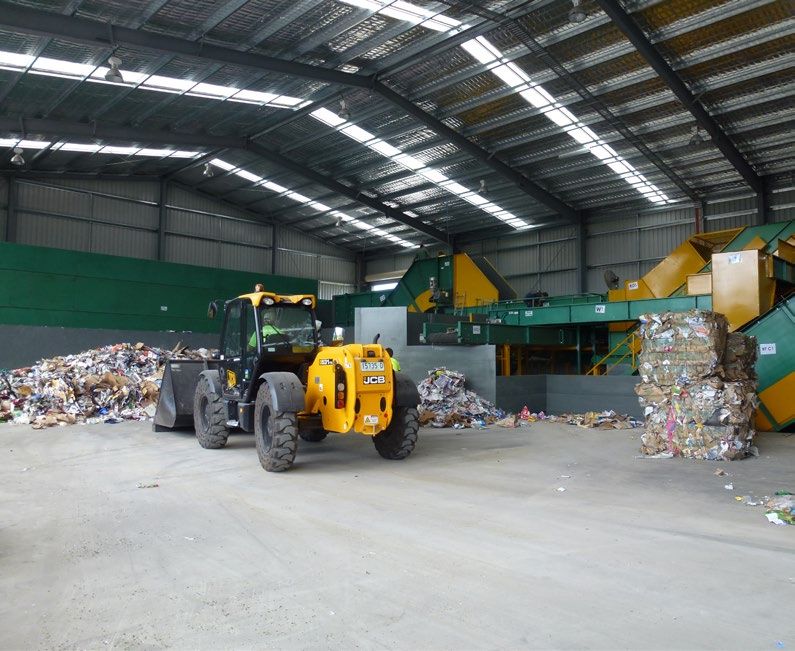
N O R T H E A S T WA S T E - 2 0 1 7 - R E G I O N A L WA S T E M A N A G E M E N T S T R AT E G Y | 1 0

   2.2 Existing Waste Services, Infrastructure and Directions

Table 1 summarises the demographics, services, infrastructure and waste movements for each Council. Arrangements and
infrastructure vary across the region but in recent years a more streamlined approach with improved infrastructure coverage
has emerged. Each Council has its own arrangements in place for waste collection, by contract with a private operator or by
an in-house day labour service.

All Councils operate a fortnightly comingled recycling service for dry recycling, except for Kyogle Council which has a weekly
split bin (waste/recycling) collection. Six Councils offer the larger 360 litre recycling bin to encourage improved diversion,
with this now being the standard recycle bin option for many residents and businesses. Recycling is available to commercial
premises in all seven Council areas and organics collection for business is available in six.

An organics collection is now available across 6 council areas. Ballina, Byron, Clarence Valley, Richmond Valley, Lismore and
Tweed provide a weekly combined food and garden organic (FOGO) service. Those Councils have also implemented a reduced,
fortnightly collection schedule for residual waste, to further encourage the diversion of food and garden waste via the weekly
organics service. Some Councils also provide as standard, a smaller 140 litre bin for the collection of residual waste.

All NE Waste Councils with the exception of Kyogle, which is in negotiation with its waste contractor to move to a 2 or 3 bin
system in the future, have adopted a 3 bin system which complies with the Australian Standard (AS 4123.7-2006) bin lid colour
requirements.

There are three Material Recycling Facilities (MRFs) located in the region. Tweed, and Kyogle have contracts with a private
operator for processing at the Chinderah MRF in Tweed Shire. Clarence Valley’s dry recyclables are processed at the Grafton
MRF, which is situated at the landfill. The Lismore MRF processes dry recycling from Lismore, Richmond Valley, Byron, Ballina
and Tenterfield.

Lismore’s organic recycling facility processes Byron, Ballina and Richmond Valley’s food and garden organic waste, via a new
MAFF open windrow composting system. Clarence Valley processes its organics via the In-Vessel Composting system at the
Grafton MRF site. In July 2017 Tweed also began a FOGO service and is currently seeking organics processing technology for
its product.

Most NE Waste Councils dispose of residual waste at their local licensed landfill facility, with the exception of Ballina, Byron and
Tweed Shire Councils, who currently have contracts with a private operator for disposal of residual waste at landfills in South
East Queensland.
N O R T H E A S T WA S T E - 2 0 1 7 - R E G I O N A L WA S T E M A N A G E M E N T S T R AT E G Y | 1 1

Table           Councils waste services, infrastructure and direction.

1
        Council                         Collection/Service                        Infrastructure                                           Recent changes and Direction

        Ballina                         Council and Contractor Collection of:     Closed Landfill with 3 years emergency life              Compositional Waste Audit 2017
        Population: 42,100              •   240l residual fortnightly             Residual currently transported to Queensland             Focus on improving asbestos management with MicroPHAZIR gun,
                                                                                  Transfer Station/Drop off facility                       testing kits and training
        Single unit dwellings: 10,459   •   240l and 360l recycling fortnightly   Tip Shop
        Multi unit dwellings: 4,373     •   240l FOGO weekly                      CRC                                                      Feasibility study on potential improvements to transfer stations and
                                                                                                                                           loadout areas

        Byron                           Contractor Collection of:                 Closed Landfill with 2 years emergency life              Compositional waste Audit 2016
        Population: 33,280              •   140/240l residual fortnightly         Transfer Station/Drop off facility                       New Waste Management Strategy and Master Plan for Myocum site
                                                                                  Tip Shop                                                 including a new FERRC
        Single unit dwellings: 8,579    •   240l recycling fortnightly            CRC
        Multi unit dwellings: 1,818     •   240l FOGO weekly                      Gas collection and Flare                                 Public place waste audit and installation of new bins

                                        •   Annual bulk drop off                                                                           Pasteurisation of Green waste
                                                                                                                                           FOGO introduced in 2016
                                                                                                                                           New organics processing MAFF system
                                                                                                                                           Improving traffic management

        Clarence Valley                 Contractor Collection of:                 2,417,000 m3 landfill 60 years of life                   A Council waste app was developed
        Population: 52,800              •   240l residual fortnightly             MRF 12,000 tpa                                           Mattress recycling commenced
                                                                                  14,000 tpa organics processor
        Single unit dwellings: 16,802   •   360l recycling fortnightly            6 transfer stations                                      A weighbridge solar system was installed with Tesla battery back up.
        Multi unit dwellings: 2,083     •   240l FOGO weekly                      Tip Shop/Drop-off Facility                               Improved public place recycling
                                        •   Annual kerbside cleanup               Hazardous waste store                                    Upgrade of transfer station
                                                                                  CRC at Maclean and at Grafton
                                                                                                                                           New landfill cell
N O R T H E A S T WA S T E - 2 0 1 7 - R E G I O N A L WA S T E M A N A G E M E N T S T R AT E G Y | 1 2
Table
1
Council Collection/Service Infrastructure Recent changes and Direction
Kyogle Contractor collection of: 190,000 m3 landfill 50 years of life at Kyogle A new cell was completed at Kyogle and one closed at
Population: 9,600 • 120l split bin weekly 4 transfer stations/drop off facility Woodenbong.
Single unit dwellings: 1,944 • 120l split bin weekly Tip shop Working to improve in house waste management and community
event waste management
Multi unit dwellings: 61 CRC
Construction of a new drop-off bay for green waste at the Kyogle
New focus on agricultural waste
Lismore Council Collection of : 88,000 m3 with 2 years life remaining and New Waste Strategy
Population: 46,200 • 140/240l residual fortnightly 600,000 m3 proposed New waste education officer
Single unit dwellings: 14,792 • 240/360l Recycling fortnightly MAFF organics New optical sorter has increased plastics recycling
Multi unit dwellings: 1,220 • 240l FOGO weekly 15000tpa MRF New Aerated MAFF composting system 2016
• 3 annual free tip vouchers 2 transfer stations A Commercial Waste Sorting Facility will be constructed in 2017-18
Hazardous waste store A new landfill cell (600,000 m3) is in the approval phase and
CRC construction is planned for 2018/19
Recycling Drop off facility
Richmond Valley Council Collection of: Near capacity landfill with 250,000 m3 proposed New master plan for Namoona with new cell and capping in
Population: 23,550 • 240l residual fortnightly 4 transfer stations development
Single unit dwellings: 7,410 • 240/360l recycling fortnightly Hazardous waste store New waste Strategy 2017-8 under development
Multi unit dwellings: 260 • 240l FOGO weekly CRC New waste education officer in 2016
Front End Resource Recovery Centre Pasteurisation and production of saleable green waste 2017
Tip shop Concrete crushing on site 2017
New weighbridge for Evans head proposed
Seeking long term regional landfill or AWT options
Tweed Contractor Collection of: Landfill Temporarily closed but 2.5 million m3 New FOGO service 2017
Population: 94,450 • 120l residual fortnightly landfill approved Proposed Organics Treatment Facility
Single unit dwellings: 18,694 • 240l recycling fortnightly Two transfer stations/drop off facilities New landfill under development (2.5 million m3)
Multi unit dwellings: 13,396 • 240l FOGO weekly Tip shop New CRC 2017
• 2 x yearly bulk collections CRC Improvements to communications system with a focus on social
Hazardous Waste store mediaN O R T H E A S T WA S T E - 2 0 1 7 - R E G I O N A L WA S T E M A N A G E M E N T S T R AT E G Y | 1 3
2.3 Overview Of Changes
Since 2013 when the last regional waste strategy was published a number of significant changes
have occurred in the region. The key changes are highlighted below.
Changes to Councils infrastructure, services and direction include:
▶▶ Three more Councils have implemented a FOGO service bringing the total to 6 of the 7
member Councils. This service is for residential and commercial premises.
▶▶ A new Transfer Station was built at Iluka in the Clarence Valley and Bora Ridge (RVC) and
Woodenbong (Kyogle) landfill were closed and replaced by Transfer Stations.
▶▶ 360 litre recycling bins have become more common, with 6 Councils now offering this
as the standard service.
▶▶ Organics processing has increased and been upgraded with Lismore installing a new
aerated composting floor for FOGO, Richmond Valley and Kyogle Councils beginning
green waste pasteurisation and reuse, and Byron Council constructing a new aerated
pad to process self haul green waste on site.
▶▶ Leachate containment and treatment continues to be improved with Ballina Council
planting over 1000 vetiver seedlings to increase leachate diversion, Tweed improving
the irrigation systems of their vetiver fields and Byron investigating new leachate control
methods on site.
▶▶ Waste staffing has increased noticeably with a total of 8 new staff working in waste
education and strategy related roles. A new Environmental Learning Centre was built
at Grafton.
▶▶ Two new tip shops have opened at Casino and Ballina, promoting reuse.
▶▶ A weighbridge was installed at Kyogle, second weighbridges were installed at Lismore
and Grafton and a solar powered weighbridge with Tesla battery was installed at South
Grafton. New software technology was adopted at Byron Council to improve tracking
and management of collection. Data collection has improved with C&D waste and
recovery, Illegal Dumping, Waste Locate and litter.
▶▶ New Strategies and Master plans are in development in Richmond Valley, Tweed, Byron
and Ballina Shires.N O R T H E A S T WA S T E - 2 0 1 7 - R E G I O N A L WA S T E M A N A G E M E N T S T R AT E G Y | 1 4
NSW EPA Waste Less Recycle More (WLRM) grants have also allowed for NE Waste to expand our
program reach into challenging new areas. We have been the recipients of 19 contestable grants
since the original strategy was funded in 2013 and new programs have included:
▶▶ Eight Community Recycling Centres (CRC) have been established across the region
at Casino, Kyogle, Grafton, Maclean, Lismore, Ballina, Byron and Tweed Heads. These
allow for residents to drop off for free a range of problem wastes that traditionally have
been disposed of to landfill. The CRC’s accept household quantities of paint, oil, gas
bottles, fire extinguishers, fluoro tubes and globes, smoke detectors and household
and lead acid batteries.
▶▶ Two programs that assist with the disposal of asbestos have been implemented.
Providing Household Asbestos Disposal Kits for small jobs where less than 10m2 of
asbestos is being removed by residents. 362 kits have been distributed in the past
2 years. Home asbestos test kits are available for residents to establish if their home
contains asbestos prior to renovating. To date 480 test kits have been distributed to
councils and nearly 300 tests completed.
▶▶ Our illegal dumping grants have made it possible to install surveillance cameras,
train staff, develop enforcement and education resources, gather baseline data and
engage a Regional Illegal Dumping (RID) officer. As a result there has been a doubling
in the number of illegal dumping incidents reported across the region - up from 898 in
2015/16 to 1881 in 2016/17 with 725 tonnes of illegal dumping disposed of. Six of the
7 member councils are now registered for RID online reporting.
▶▶ Three litter projects have been targeting high priority littered sites including parks, retail
areas and roadsides. The 14/15 litter program saw new bin and signage infrastructure
installed at hotspots across 6 LGAs and achieved an average 38% reduction in littering
at the sites. The 16/17 Busting Roadside Litter awareness program (stage 1) focused
on reducing littering from vehicles at 6 hotspot locations along the Pacific Highway
from Tweed to Grafton and resulted in an average 53% litter reduction and a 150%
in the number of residents registered to report littering from vehicles. The 2nd stage
of the roadside program extended to highways in the west of the region at Lismore
and Casino and achieved an average 74% litter reduction by volume. A new project
to engage the public in an ongoing litter collection and reduction campaign at 4 high
profile recreational parks will be rolled out in 2017/18.
▶▶ Two rounds of Bin Trim grants have resulted in the assessments of 370 businesses and
engagement with many more. The combined Bin Trim projects resulted in 1,100 tonnes
being diverted from landfill. Four Bin Trim rebates were organised for businesses
including, a bandsaw, baler, a chicken tractor and a hot rot composting machine.N O R T H E A S T WA S T E - 2 0 1 7 - R E G I O N A L WA S T E M A N A G E M E N T S T R AT E G Y | 1 5 New business resources were developed including promotional tools, video showcases, staff engagement signage and factsheets. The data collected from the Bin Trim project has supported NE Waste grant application in other areas and has also been provided to our member councils with personalised reports being developed for them. Momentum from Bin Trim has helped promote the Waste Warriors for Business Project, with the project being contacted by significant numbers of businesses for assistance. The Waste Warriors for Business project continues to engage and promote best practice waste management, the project objectives and participating businesses via its blog and social media accounts. ▶▶ Since 2014, NE Waste has been successful in 2 x Love Food Hate Waste grants and a Food Smart Pilot study. The first of these grants enabled a social research study to be conducted in our region involving parents with children. This enabled a targeted behavioural change program to be developed and implemented successfully in our region over the past 3 years. The program reaches householders through a multifaceted approach including TV, print media, social media and face to face engagement through our mobile education van and a Love Food Hate Waste workshop series, reaching more than 5,000 people. Evaluation has shown that following on from the workshops, 85% of participants report to have adopted 3 food waste avoidance practices and reduced their food waste by at least 2-5L per week. NE Waste have also piloted the Love Food Hate Waste Food Smart program to 98 householders in our region. NE Waste will continue to foster partnership opportunities and implement food waste avoidance behaviour change programs across the region building on its already successful Love Food Hate Waste program. ▶▶ Under the better waste recycling fund NE Waste has purchased Visual Messaging Signs that have been used at landfills, to advertise waste events, and on our litter projects. We have also purchased a new waste education van and resources to extend our reach into schools and the community. This year (2017) the fund will be used to engage the region in the appropriate use of their FOGO collection systems and to reduce organic waste going to landfill. ▶▶ For the first time NE Waste has moved into the area of working with aboriginal communities on waste management issues. A review of the discrete aboriginal communities in the region was conducted in 2015 and assistance was given to communities who wished to apply for funding to tackle illegal dumping issues. Since then funding has been secured to work intensively with 2 communities, Muli Muli in Kyogle and Cabbage Tree Island in Ballina Shire. A clean up of existing waste and asbestos on-site is underway and the program is focusing on finding longer- term solutions to challenges that these communities face around waste management.
N O R T H E A S T WA S T E - 2 0 1 7 - R E G I O N A L WA S T E M A N A G E M E N T S T R AT E G Y | 1 6

                                                                                                              ▶▶ In the report it refers to mixed waste treatment and not an AWT specifically – Lismore
   2.4 Infrastructure Needs and Planned                                                                           is bringing online before June a waste sorting facility that will sort 18,000 tonnes of
   Infrastructure                                                                                                 commercial and self-haul waste. A few years after it will be expanded to take municipal
                                                                                                                  kerbside waste as well. It will be a good demonstration to determine potential diversion
                                                                                                                  quantities.
                                                                                                              ▶▶ Our councils all integrate garden organics into their composting processing and with
In 2011 an infrastructure needs analysis was completed for the NSW EPA. It identified the Northern                Byron and Tweed also beginning this practice the need for increased resource recovery in
Rivers as a high priority for new resource recovery infrastructure. Since that time a number of new               this area is unlikely.
facilities have become operational, addressing some of the infrastructure gaps identified. These
include a new MRF at both Grafton and Lismore, an organic processing facility at Grafton, and a
household hazardous waste shed at both Richmond Valley and Tweed Shire. In addition, eight             National trends indicate that while diversion of recycling and organics has improved, the overall
Community Recycling Centres have been constructed and operate across the region. Recently a            volume of waste generated has increased, making landfill capacity a pressing issue. Total available
new infrastructure needs analysis has been completed by the NSW EPA and has identified the need        landfill capacity across the region is currently at 4 million cubic meters, with similar proposed
for:                                                                                                   additional void space available. Three Council landfills are currently near capacity and either have
                                                                                                       approval or are awaiting approval to develop new landfills. One Council landfill has closed due to
       ▶▶ Additional C&D recycling capacity (around 41,000 tpa by 2021)                                constrained capacity and expansion issues and is currently transferring residual waste to South
       ▶▶ Additional garden organics recovery capacity (around 36,000 tpa by 2021)                     East Queensland. Two of the Councils nearing capacity are also utilising this option while their new
                                                                                                       landfills are in development. There is also the potential to utilise other existing landfills in the region
       ▶▶ 10,000 tpa ‘non-putrescible MRF’ capacity; 31,000 tpa mixed waste treatment       and        if the South East Queensland option ceases to be viable.
           16,000 tpa energy recovery capacity to achieve recovery targets for MSW and C&I waste

       There will be:

       ▶▶ An oversupply of clean MRF capacity
       ▶▶ Adequate FOGO organics processing capacity, assuming Tweed Shire Organics Facility
           is developed as planned

At the time of writing, the final Infrastructure Strategy has not been released but NE Waste Council
feedback on the proposed needs above are:

       ▶▶ We do not consider that a mixed waste treatment facility or an energy recovery facility
           or RDF plant is a priority for Local Government in the Northern Rivers for the 2017-
           21 period of the strategy. If the strategy was out to 2031 it could be relevant. A more
           realistic strategy would be to invest in C&I/C&D resource recovery infrastructure e.g.
           small dirty MRF’s along with market development.
       ▶▶ An AWT of some kind will come online at some stage of the future in the region – it may
           however be for specific waste types.
N O R T H E A S T WA S T E - 2 0 1 7 - R E G I O N A L WA S T E M A N A G E M E N T S T R AT E G Y | 1 7
2.5 Waste And Resource Recovery Tonnage Data Figure 4: Total Domestic Waste Generation and Resource Recovery
Figure 4: Total Domestic Waste Generation and Resource Recovery
200,000
2.5.1 Total Domestic Waste 180,000
160,000
In the NE Waste region there has been a reduction in total domestic waste
140,000
generation (from kerbside, clean up and drop off ) since 2012. During the 85,675
75,738
78,469
79,229
80,324
same period the population has increased, indicating an overall reduction 120,000
88273 102,018
per capita of domestic waste generated.
100,000
In 2012/13 waste recovery in the region exceeded the tonnes of waste 80,000
61%
disposed to landfill for the first time. In 2015/16 recovery reached 102,018
tones, with 63,907 tones disposed of to landfill. This equates to a recycling 60,000
rate of 61% 89,938
85,789
91,197
91,012
40,000
82,073
73950
recycling rate 63,907
This increase in resource recovery is a result of a number of improved 20,000
services across the region, including the introduction of a food and garden
-‐
organics (FOGO) service in both Richmond Valley and Byron Shire. The
2007/08 2008/09 2009/10 2010/11 2011/12 2012/13 2015/16
Tweed FOGO service goes on line in July 2017 bring the total number of
NE Waste Councils recycling organics to six of the seven NE Waste Councils. Tonnes
Disposed Tonnes
Recovered
Most councils have also upgraded their recycling bins to a 360 Litre, encouraging more dry recycling recovery.
Extensive education and communication campaigns have supported the successful implementation of these
new and improved services. Figure 4 presents the total domestic waste generation and resource recovery in Figure 5: Total Kerbside Domestic Waste Generation
Figure 5: Total Kerbside Domestic Waste Generation
tonnes for the region since 2007.
80,000
2.5.2 Total Kerbside Domestic Waste 70,000
60,000
Most domestic waste is collected via Councils kerbside bin services. Overall the total quantity of domestic 50,000
waste and recycling collected in kerbside bins has been steadily decreasing by about 1 kilogram per household Residual
40,000
per week each year since 2007. Throughout this period there has been a steady increase in the diversion of Dry
Recycling
30,000
both dry recycling and organics with a corresponding reduction in the disposal of waste to landfill via the Organics
residual waste bin as shown in Figure 5. 20,000
10,000
-‐
07/08 08/09 09/10 10/11 11/12 12/13 15/16
N O R T H E A S T WA S T E - 2 0 1 7 - R E G I O N A L WA S T E M A N A G E M E N T S T R AT E G Y | 1 8

   2.5.3 Non-Domestic Waste                                                                     Illegal Dumping
                                                                                                The number of Illegal Dumping incidents reported in the region has grown significantly in
                                                                                                recent years. Recent NE Waste projects have improved reporting, worked across sectors of
                                                                                                Council to consolidate data and encouraged the public to report, contributing to this increase.
Solid waste from households including kerbside bins, kerbside clean ups and self haul
to drop off centres, comprises the majority of the Municipal Solid Waste (MSW) stream.          Since the last strategy our Illegal Dumping Clean up and prevention program (2015-18)
However MSW also includes solid waste from local government operations such as waste            has provided training of Council staff, surveillance cameras and training in their use, the
collected from municipal parks and gardens, street sweepings, events, council engineering       development of enforcement and educational resources, and encouraged better data
works and public council bins.                                                                  collection of illegal dumping that is disposed of in Council facilities.

                                                                                                In 2016 , NE Waste was successful in gaining funds for an Illegal Dumping RID officer for the
                                                                                                southern region as a trial. The role was to assist 3 Councils to improve data collection using
Construction and demolition waste (C&D)
                                                                                                the Report Illegal Dumping online tool, continue training and resource development and to
Construction and demolition data varies across the region. The introduction of the waste levy   improve communication across the Council departments involved in Illegal Dumping.
has led to a corresponding reduction in C&D waste throughout the region been landfilled.
                                                                                                In summary:
On-site use and the recovery of concrete for resale are the main activities undertaken to
reduce C&D waste to landfill.
                                                                                                       ▶▶ Six of the regions seven Councils are now registered to use RID online
In 2016/17 over 38,006 ton of C&D materials entered the regional facilities. Of this 16,091            ▶▶ The number of illegal dumping incidents reported and investigated more than
ton was recovered. While this recovery rate of 42.3 % is well below the 2021 WARR Strategy                 doubled in 2016/17, to 1,881 across the region
target of 80% it is an increase on previous years when most C&D waste was landfilled. Some
                                                                                                       ▶▶ The amount of illegal dumping disposed of this year, increased from 219 to 725
individual Councils have recovery rates of up to 77% and several more have commenced
                                                                                                           tonnes
concrete crushing and the sorting of other products for reuse and resale. At the time of
the last strategy data collection did not allow the recycling rate to be calculated at all so          ▶▶ The number of penalty and clean up notices issued across the region this year
improvements have been made in collection and recording of data. The recovery of C&D                       increased by 36% to 56 in total
waste will continue to be a priority for NEW Councils in this strategy.                                ▶▶ Illegaldumping of asbestos continued to rise, with 57 incidents reported in
                                                                                                           2016/17

Commercial & Industrial Waste (C&I)
Reliable data about the commercial sectors waste generation and resource recovery
performance is still not currently available. This is due to the combined residential and
commercial collection services provided by Councils and the existing weighbridge and MRF
systems that do not allow accurate data separation for differing waste streams. However, it
is anticipated that this may improve for self haul and skip loads, as Lismore Council has
received funding to construct a C&I sorting facility to improve recovery and enable accurate
reporting.
N O R T H E A S T WA S T E - 2 0 1 7 - R E G I O N A L WA S T E M A N A G E M E N T S T R AT E G Y | 1 9
2.6 Waste Composition
2.6.1 Kerbside Residual Bin
Figure 5 NE Waste Region – Kerbside Residual Bin Composition
Misc
Data in this section, except for Waste composition in Figure 8% Cardboard
&
P aper
8%
6 below is taken from the most recent 2015-16 WARR data. textiles
Figure 6 shows more recent data from the compositional 5%
audits held in the 2016-17 period.
Other
p utrescibles/animal
waste
4%
Earth
Based
3%
Building
Waste 4% Food
Organics
28%
Hazardous
1%
Non
Recyclable
P lastics
8%
Contaminated
P aper
5%
Garden
organics
2%
Glass 4%
Nappies Ferrous
M etal 3%
10%
Non-‐Ferrous
M etal
Recyclable
Plastics E-‐waste 1%
5% 2%
The kerbside residual bin audits undertaken in 16-17 show the above composition. Food organics remain a significant
portion of the bin and the recent focus of Councils and NEW has been to increase FOGO campaigns and services to address
this issue. The average household residual bin (red lid) in the region contained 7 kg of waste per week, with 1.47 kg of recycling and
2.12 kg of organics. An estimated 63% of the bin contents were potentially recyclable, including 39% percent organics, 24 percent
dry recyclables.N O R T H E A S T WA S T E - 2 0 1 7 - R E G I O N A L WA S T E M A N A G E M E N T S T R AT E G Y | 2 0
2.6.2 Comparison of regional compositions since 2013
Since the last strategy was written from audits conducted in 2013, all Councils have experienced a significant
reduction in the weight of their residual bin and the quantity of organics and dry recycling in that bin. Their combined
efforts are shown in Figure 6 below.
Figure 6
Comparison
from
previous
Strategy
in
kgs
10
9
8
7
6
5
4 8.6
7
3
2 3.52
1 2 .31 1.47 2 .12
0
Total
weight
Recycling Organics
2013 2017N O R T H E A S T WA S T E - 2 0 1 7 - R E G I O N A L WA S T E M A N A G E M E N T S T R AT E G Y | 2 1
2.7 Performance Assessment
Table 2 presents the 2015/16 generation per household (kg/hh/wk) of
kerbside waste and recycling for the 7 NE Waste Councils and their estimated
This section reviews the performance of different waste collection systems and helps us understand
household recycling rate (%) according to recently released WARR data.
how existing schemes are performing and where there is potential for improvement. The region’s
performance is measured against a number of indicators including the amount of household waste
Table
generated, the percentage recycled and the overall diversion from landfill. This analysis enables the NE NE Waste Councils Generation per Household
Waste region’s performance to be compared against other similar councils and regions.
2
Yield (kg/hh/wk)
2015/16
Council Recycling Rate
Residual to Dry
2.7.1 Household Generation landfill Recycling
Organics Total %
Household waste generation has been steadily reducing since 2007 as indicated in Figure 7 below.
Ballina Shire Council 8.6 5.4 8.7 22.73 62%
According to WARR data in 2015/16 households across the region generated 8.46kg of residual waste
per week on average. The dry recycling rate at 6.03 kg has increased marginally continues to remain Byron Shire Council 7.8 7.0 7.9 24.3 65.6%
similar to previous years. The organics yield per household has also remained the same at 6.2 kg per
Clarence Valley Council 6.7 5.6 8.2 20.3 67.3%
household per week but these 15-16 figures do not reflect the introduction of new FOGO services
across the region, in Richmond Valley and Tweed Council areas. Kyogle Council 10 7.1 NA 14.6 41.5%
Lismore City Council 6.8 6.0 8.7 19.4 68.37%
Figure 7 Household Generation Richmond Valley Council 9.2 5.4 4.2 20.2 51.06%
Tweed Shire Council 10.1 5.7 5.7 22.3 53.02%
NE WASTE Region
Residual
Dry
Recycling
Organics Total
Kerbside 8.46 6.03 6.20 20.69 58.44%
2015/16
30.00
NE WASTE Region
9.6 5.8 6.7 22.1 57%
2014/15
25.00
22.0
20.00
RRA 2014/15 9.8 5.3 6.9 55%
15.00
NSW 2014/15 11.9 5 5.2 22.1 46%
10.00
5.00
-‐
07/08 08/09 09/10 10/11 11/12 12/13 13/14 14/15 15/16N O R T H E A S T WA S T E - 2 0 1 7 - R E G I O N A L WA S T E M A N A G E M E N T S T R AT E G Y | 2 2
2.7.2 Domestic Diversion
The total domestic diversion rate for the NE Waste region has been gradually increasing due
mainly to improved diversion rates from kerbside bins. In 2011/12 the diversion rate was 49.5%.
Many more services have been introduced since the publishing of the 2014/15 WARR data used
for this report and a continued increase in this rate is expected during the lifetime of this strategy.
Total Domestic Diversion Rate
Table
Domestic Diversion Rate
3
2015/16
Council Total Domestic
Total Recovered Total Disposed
Generation Recycling rate
TONNES
Ballina Shire 22,408.10 14,037.19 8,370.91 62.6%
Byron Shire 25,085.16 14,058.12 11,027.04 56.04%
Clarence Valley 29,579 19,235 10,344 65.03%
Kyogle 4,836.56 2,561.39 2,275 52.96%
Lismore City 21,791 14,584 7,207 66.93%
Richmond Valley 10,261 5,962 4,299 58.10%
Tweed Shire 57,716 37,107 20,690 64.29%
NE WASTE Region 2015/16 171,676 107,544 64,132 60.86%
NE WASTE Region 2014/15 155,415.00 81,895 73,520 52.7%N O R T H E A S T WA S T E - 2 0 1 7 - R E G I O N A L WA S T E M A N A G E M E N T S T R AT E G Y | 2 3
2.7 Waste Forecasting and Projections
Figure 8 displays a number of waste scenarios based on ABS projected
population data and the historical trends of domestic waste generation in
Figure 8 Total Domestic Waste Generation (tonnes) Forecast to 2021 the NE Waste region. The regions population is forecast to increase from
287,900 in 2011 to 306,000 in 2021. The three scenarios display the possible
change in tonnages of domestic waste over time, in line with the predicted
Scenario 1 Scenario 2 Scenario 3 Domestic Waste 07-12
population increase and changes in the generation of waste per person.
180,000
▶▶ Scenario 1 assumes a continuation of the overall trend of a
reduction in waste generation of 1.5% per capita in the region.
175,000
▶▶ Scenario 2 assumes that domestic waste generation remains at
the 2012 rate of 0.55 tonnes per year per capita.
170,000
▶▶ Scenario 3 assumes further improvement to a 2.25% reduction
in domestic waste generation per capita, reflecting our
165,000 aspirational target.
160,000 After 2013, all scenarios predict a steady increase in total domestic waste
generation until 2021. These predictions could be influenced by a number
155,000 of factors including the economic climate, behavioural change through
education and regulation and natural disaster events.
150,000 The above forecasting is limited by the exclusion of C&I and C&D waste
2007 2008 2009 2010 2011 2012 2013 2014 2015 2016 2017 2018 2019 2020 2021 tonnages. Proposed improvements in data collection and reporting will
enable more accurate prediction of waste generation across all waste
streams.N O R T H E A S T WA S T E - 2 0 1 7 - R E G I O N A L WA S T E M A N A G E M E N T S T R AT E G Y | 2 4
2.8 Review Of Programs, Initiatives And Community Expectations
NE Waste had delivered a broad range of waste education, business and community engagement programs over 20 years. The group has focused on
delivering outcomes in the initiatives tabled below, with their key features and outcomes outlined. Many changes have occurred during the past 3 years
and these are also highlighted.
Table NE Waste Programs & Initiatives
4
Project and Initiatives Features Outcomes
Administration, Regular meetings and networking have 10 meetings with member councils and contractors
Communication and continued with the 7 Councils, other 4 annual E-Newsletters.
Reporting VRWG’s and NE Waste project officers
Website promotion providing information and interaction at www.newaste.org.au in addition to hosting 3 individual project websites
Extensive Media engagement
Editorial and advertising to support projects: In 2017-18 NE Waste developed a new TVC, ran 2 existing from the previous year,
Annual reports, Project Reports, Strategy produced 10 social media clips, an image library, 139 print ads, 64 pieces of editorial, 993 radio ads, 3 conference presentations, 1
Youtube music video and a digital infographic, 4 media interviews
Annual report to Council, annual report to EPA, Strategy review, grant acquittal, project reports to council 1/4ly
Collaboratively identifying regional Regional Waste Strategy 2011-15, Regional Waste Strategy 2013-17
Regional Waste Strategy objectives and planning actions for
implementationN O R T H E A S T WA S T E - 2 0 1 7 - R E G I O N A L WA S T E M A N A G E M E N T S T R AT E G Y | 2 5
Table NE Waste Programs & Initiatives
4
Project and Initiatives Features Outcomes
Community and Schools Education and Community education and schools support program is delivered through our mobile Wipe out Waste (WOW) team and resources.
Engagement Program The Wipe out Waste program actively engages more than 5,000 community members each year at more than 50 events across the
region each year. Our WOW excursion is now integrated into the WOW program - approx. 7 of these are held annually
Trip to Tip Program (WOW excursion)
Phase 1: social research conducted and report produced. Pilot workshop held, Facebook page commenced, TV Commercial
Love Food Hate Waste Program produced and aired
Phase 2: community workshop series - 40 workshops and cooking demos held. Partnerships established with TAFE, NSW Health,
Consortium of Neighbourhood Centres, Schools, Preschools. Resource production, training of contractors
School and Community
Media campaign promoting Council recycling services. Includes a week of community events, editorial in local papers, newspaper
Education programs National recycling week
ads in local press, social media, and newsletter articles.
Second-hand Saturday The biggest garage sale day that involves up to 50,000 people in reuse through holding or visiting garage sales on the day.
From 2007-2010 and 2014-2018 reaching more than 50 preschools/early childhood centres. Holistic and integrated approach for
Early Childhood Waste Education Program centres becoming waste wise.
Get Grubby Program - 7 training sessions held with Early Childhood Centre staff. Access to Get Grubby Program (@dirtgirlworld)
Including Students Using Sustainable Strategies Program (SUSS) run from 2004 – 2012. Waste Audit training with high schools run in
High Schools Program
conjunction with SUSS and now with Dorroughby EE Centre and Northern Rivers Group of Environmental Educators.
Business engagement and audit project Actively engaged over 600 businesses since 2005.
Stage 1 - audited 40 businesses and provided support to facilitate waste reduction practices.
Stage 2 – precinct and sector based approach included 10 business cluster surveys and assessed 490 small businesses over 2 years.
Waste Warriors project Stage 3 – Waste Warriors utilises TV, electronic, social and print media, to engage businesses. A case management approach
Business Waste Reduction
incorporates EPA Bin Trim tool and a detailed action plan to achieve increased diversion through facilitation of recycling
Project
partnerships, improved staff training and promotion of business success. Two rounds of Bin Trim grants have resulted in the
assessments of 370 businesses and engagement with many more. The combined Bintrim projects resulted in 1100 tonnes being
diverted from landfill. Four Bin Trim rebates were organised for businesses including, a bandsaw, baler, a chicken tractor and a hot
rot composting machine. New business resources were developed including promotional tools, video showcases, staff engagement
signage and factsheets.
Regional contracts for specific problem Collections for Ewaste, compact fluorescent lamps, tyres
Problem Wastes and
wastes
Community Recycling Collection of chemicals at surrender events
Centres Community Recycling Centres constructed and operational in the regionN O R T H E A S T WA S T E - 2 0 1 7 - R E G I O N A L WA S T E M A N A G E M E N T S T R AT E G Y | 2 6
Table
NE Waste Programs & Initiatives
4
Project and Initiatives Features Outcomes
Training provided for staff from member Councils for professional development on specific areas each year. In 2017 25 Council
Training Landfill operator ,Asbestos identification, waste workers were trained in a certificate course in asbestos handling and removal
Illegal dumping and Media training Since 2012, NE Waste Council staff and contractors have also participated in EPA sponsored training for cultural awareness,
commmunity-based social marketing, behaviour change, collaborative leadership and project management.
TV, radio, print advertisements and editorial
Posters, stickers, brochures, road signage, enforcement tape.
A Regional Illegal Dumping Program
Training for council staff in Illegal Dumping enforcement
Raising awareness of Illegal across 7 participating Councils since 2012
Dumping and has continued to provide resources, Development of online reporting for Illegal dumping
support and training to our councils. Development of www.illegaldumping.com.au website
Support and development of regional projects that focus and support the needs of the 7 local councils in NE Waste
Supporting a pilot project for a contractor Increase reporting and improved data capture.
to work with 3 Councils to improve their
RID Online Officer The transfer of information to nonparticipating Councils.
data collection and management of
reporting Illegal Dumping on line.
The 14/15 litter program saw new bin and signage infrastructure installed at hotspots across 6 LGAs and achieved an average 38%
reduction in littering at the sites. The 16/17 Busting Roadside Litter awareness program (stage 1) focused on reducing littering from
Providing litter programs that involve vehicles at 6 hotspot locations along the Pacific Highway from Tweed to Grafton and resulted in an average 53% litter reduction and
media, infrastructure and education a 150% in the number of residents registered to report littering from vehicles. The 2nd stage of the roadside program extended to
Litter components. So far, 3 litter projects have highways in the west of the region at Lismore and Casino and achieved an average 74% litter reduction by volume. A new project
been targeting high priority littered sites to engage the public in an ongoing litter collection and reduction campaign at 4 high profile recreational parks will be rolled out in
including parks, retail areas and roadsides. 17/18.
NE Waste also collaborated with Midwaste to extend this program to the south along the Pacific Highway.
This project involved a review of the A clean up of existing waste and asbestos on site is complete.
discrete aboriginal communities in In excess of 1,950 t of waste was removed from the Muli site and 28 t from Cabbage Tree Island. Project cost was in excess of
the region with assistance given to $300,000 provided by the EPA.
communities who wished to apply for
funding to tackle illegal dumping issues. A recycling system and service was introduced to the community
Clean Up Country
Since then funding has been secured to A week-long workshop on recycling resulted in a video film clip shot at Muli Muli by Desert Pea Media.
work intensively with 2 communities, Muli
A planting day and thank you was held to rehabilitate the old tip site.
Muli in Kyogle and Cabbage Tree Island in
Ballina Shire. around waste management.N O R T H E A S T WA S T E - 2 0 1 7 - R E G I O N A L WA S T E M A N A G E M E N T S T R AT E G Y | 2 7
NE Waste Programs & Initiatives
Table
4
Project and Initiatives Features Outcomes
In recent years this has included:
The support of specific initiatives and 7 Visual messaging signs for Councils
Better Waste Recycling Fund
projects approved by the EPA Purchase of asbestos household testing kits
The purchase of a new education van to house the community engagement project – marquees, resources and signage
There have been 3 asbestos initiative – a 480 Asbestos disposal kits provided to councils
Household Disposal Kit for residents, a
Asbestos Programs 420 Asbestos testing kits
household testing kit for residents and a
media campaign. TV Commercial, print and radio media to promote the safe disposal of asbestos.
One 30 second TVC and one 15 second TVC aired for 6 months on both regional stations
A media campaign to encourage residents
FOGO Campaign 6 social media clips for use by NE Waste and our Councils
to use their green bin correctly
An on-line media library to assist promotion
Partnerships Making links to other agencies and Regular meetings with RENEW NSW
funding bodies Grants funded by Environment Trust include Illegal dumping, ecofriendly youth project, love food hate waste
Networks and projects with environmental educators, ROUS Water, NSW Health, Consortium of Neighbourhood Centres, LALCsN O R T H E A S T WA S T E - 2 0 1 7 - R E G I O N A L WA S T E M A N A G E M E N T S T R AT E G Y | 2 8
2.9 Summary
The NE Waste region has reduced total domestic waste generation and improved recycling and resource
recovery through individual council initiatives, ongoing regional collaboration and implementation of
A strategy is required that addresses these challenges and
the Regional Waste Management Strategy 2011-14. However there is still work to be done to continue includes a uniform waste management system, enhanced
improving performance into the future.
services and drop off facilities and improved infrastructure,
At present the NE Waste region faces a number of challenges in waste management that this strategy supported by a comprehensive education and communication
will address. They include:
program to maximise business and community engagement.
▶▶ The regions population is predicted to increase by 6% to 306,000 by 2021 and this has This will contribute to further increasing diversion, alleviating
implications for waste generation, landfill availability and service provision.
the pressure and future expenditure on Council’s facilities and
▶▶ While all Councils currently have a dry recycling service and most have an organics collection,
there is room for further improvement. improving resource recovery across the region.
▶▶ Significant quantities (63%) of potentially recyclable materials are currently present in the
residual waste bin and can be recycled through existing Council services.
▶▶ Improved infrastructure is required to keep pace with future increases in population and
waste generation. Additional landfill capacity is needed to cope with current and future
residual waste disposal requirements. To achieve the WARR target of 75% diversion from
landfill by 2021, the further expansion and sharing of regional resource recovery facilities is
required.
▶▶ The lack of data about the commercial sector’s waste generation and resource recovery
makes planning for the future more difficult. Targets have been set for 70% C&I recovery, yet
existing weighbridge systems and MRFs do not allow accurate separation of the data in the
MSW and C&I streams.
▶▶ Ensuring regional cooperation, maintain equity and open communication, while addressing
the different needs of individual member Councils.You can also read