RULE THE MARKET ISSUE: 079 - 07TH MARCH, 2020 - Karvy stock broking
←
→
Page content transcription
If your browser does not render page correctly, please read the page content below

07TH MARCH, 2020

RULE THE MARKET

          ISSUE: 079
CONTENTS
                                                                                                              From The Desk Of Research Head
   Equity                                                                  1-5

   Commodity                                                              6-7

   Currency                                                              8-10
                                                                                             Yes Bank Crisis – Say No to Yes
                                                                                             Finally the day has come. After much dilly-dally and constant consultations and reviews, RBI has placed
                                                                                             Yes Bank under moratorium. It is the first time that RBI has placed such a large bank under moratorium
                                                                                             with Yes Bank being the fifth largest private sector bank. On March 5th RBI has capped the withdrawal
                                                                                             limit for depositors at Rs. 50000 for a month ending on April 3, 2020. Further RBI announced that it
                                                                                             will supersede Yes Bank’s board. Simultaneously, RBI has also initiated restructuring process of the
                                                                                             troubled bank.
     Team
     Dr. Ravi Singh                                                                          Amid speculations that RBI and government have asked SBI to takeover Yes Bank, SBI notified stock
     Srinivas Krishnan Bobba                                                                 exchanges that it’s board has granted in-principle approval to explore an investment opportunity in the
     Osho Krishan                                                                            bank. Options being considered include SBI leading the consortium of buyers including LIC to explore
     Sharath Kumar Jutur                                                                     investment opportunity and second - amalgamation with another bank. Also, RBI appointed Prashant
     Thomas V Abraham                                                                        Kumar former Deputy Managing Director and CFO, SBI as Administrator to thoroughly investigate the
     Sachin Mittal                                                                           books of Yes Bank to get a clear picture about the asset quality and financial position of the bank. It
     Veeresh Hiremath                                                                        is only after this process RBI will get clarity on the magnitude of the crisis, capital required and right
     Siddhesh Ghare                                                                          plan of action.
     Arpit Chandna
     Bharat Sunnam                                                                           Questions started surfacing about governance issues and asset quality disclosures more than two
     Ramesh Chenchala                                                                        years back. Historically, Yes Bank has always reported GNPAs below 2%. Given its strong growth
     Kushal Asthana                                                                          and rock solid financials, investors never had a whim of doubt about the asset quality of the bank.
                                                                                             Shareholder activists and other investors however expressed concerns over governance practices at
                                                                                             Yes bank after a bitter board room tussle over nomination of directors. Things took a turn for worse
                                                                                             after new CEO took over when Kapoor demanded his appointment to the board and crores of rupees
                                                                                             as compensation for lost remuneration. This triggered resignation of independent board members
                                                                                             one after another and left many key committees without heads. This showed the extent to which Rana
                                                                                             Kapoort had a firm grip on the board. This hindered the bank’s fund raising process and many top
                                                                                             notch private equity investors who earlier expressed interest in investing backed off.

                                                                                             Investors’ concerns over Yes Bank’s asset quality, disclosure practices and financial position came to
                                                                                             be true after new CEO Ravneet Gill took charge in March 2019. Markets started losing confidence in
                                                                                             Yes Bank’s numbers after RBI started disclosing a wide divergence between NPAs according to RBI
     Karvy Head Office
                                                                                             and as per the banks’ policies quarter after quarter. After the new CEO took over, he placed Rs. 10000
     Karvy Stock Broking Limited, Plot No.31/P, Karvy                                        crore additional assets under watchlist, which was a big negative surprise. During Q4FY19, Yes Bank
     Millennium Towers, Nanakramguda, Financial District,
                                                                                             reported a loss of Rs. 1507 crore, first ever by the bank. This completely blocked Yes Bank’s ability to
     Gachibowli, Hyderabad, Telangana-500032, India.
                                                                                             raise funds. After waiting for about a year, RBI had to step in to save the depositors and the financial
     For More updates & Stock Research                                                       system as a whole.
     Visit: www.karvyonline.com
                                                                                             While RBI and government have started acting swiftly to save the interests of the depositors, as usual
     Toll free: 1800 419 8283
                                                                                             it is the investors who are at the risk. If seen historically, in almost all the cases where banks were
     Email: research@karvy.com
                                                                                             placed under moratorium, it was investors who had to bear the brunt. In this case, the impact is going
                                                                                             to be on both equity as well as mutual fund investors who invested in debt schemes.
     Analyst Certification
     The following Karvy Research Desk, who is (are)
     primarily responsible for this report and whose
     name(s) is/ are mentioned therein, certify (ies) that the                                                                                                                                  - DR. RAVI SINGH
     views expressed herein accurately reflect his (their)                                                                                                                   Vice President & Head of Research
     personal view(s) about the subject security (ies) and
     issuer(s) and that no part of his (their) compensation
     was, is or will be directly or indirectly related to the
     specific recommendation(s) or views contained in this
     research report.

Disclaimer: Karvy Stock Broking Limited [KSBL] is registered as a research analyst with SEBI (Registration No INZ000172733). KSBL is also a SEBI registered Stock Broker, Depository Participant, Portfolio Manager and also
distributes financial products. The subsidiaries and group companies including associates of KSBL provide services as Registrars and Share Transfer Agents, Commodity Broker, Currency and forex broker, merchant banker
and underwriter, Investment Advisory services, insurance repository services, financial consultancy and advisory services, realty services, data management, data analytics, market research, solar power, film distribution
and production, profiling and related services. Therefore associates of KSBL are likely to have business relations with most of the companies whose securities are traded on the exchange platform. The information and
views presented in this report are prepared by Karvy Stock Broking Limited and are subject to change without any notice. This report is based on information obtained from public sources, the respective corporate under
coverage and sources believed to be reliable, but no independent verification has been made nor is its accuracy or completeness guaranteed. The report and information contained herein is strictly confidential and meant
solely for the selected recipient and may not be altered in any way, transmitted to, copied or distributed, in part or in whole, to any other person or to the media or reproduced in any form, without prior written consent
of KSBL. While we would endeavor to update the information herein on a reasonable basis, KSBL is under no obligation to update or keep the information current. Also, there may be regulatory, compliance or other
reasons that may prevent KSBL from doing so. The value and return on investment may vary because of changes in interest rates, foreign exchange rates or any other reason. This report and information herein is solely
for informational purpose and shall not be used or considered as an offer document or solicitation of offer to buy or sell or subscribe for securities or other financial instruments. Though disseminated to all the customers
simultaneously, not all customers may receive this report at the same time. KSBL will not treat recipients as customers by virtue of their receiving this report. Nothing in this report constitutes investment, legal, accounting
and tax advice or a representation that any investment or strategy is suitable or appropriate to your specific circumstances. This material is for personal information and we are not responsible for any loss incurred based
upon it. The investments discussed or recommended in this report may not be suitable for all investors. Investors must make their own investment decisions based on their specific investment objectives and financial
position and using such independent advice, as they believe necessary. While acting upon any information or analysis mentioned in this report, investors may please note that neither KSBL nor any associate companies of
KSBL accepts any liability arising from the use of information and views mentioned in this report. Investors are advised to see Risk Disclosure Document to understand the risks associated before investing in the securities
markets. Past performance is not necessarily a guide to future performance. Forward-looking statements are not predictions and may be subject to change without notice. Actual results may differ materially from those
set forth in projections. Associates of KSBL might have managed or co-managed public offering of securities for the subject company or might have been mandated by the subject company for any other assignment in
the past twelve months. Associates of KSBL might have received compensation from the subject company mentioned in the report during the period preceding twelve months from the date of this report for investment
banking or merchant banking or brokerage services from the subject company in the past twelve months or for services rendered as Registrar and Share Transfer Agent, Commodity Broker, Currency and forex broker,
merchant banker and underwriter, Investment Advisory services, insurance repository services, consultancy and advisory services, realty services, data processing, profiling and related services or in any other capacity.
KSBL encourages independence in research report preparation and strives to minimize conflict in preparation of research report. Compensation of KSBL’s Research Analyst(s) is not based on any specific merchant
banking, investment banking or brokerage service transactions. KSBL generally prohibits its analysts, persons reporting to analysts and their relatives from maintaining a financial interest in the securities or derivatives
of any companies that the analysts cover.KSBL or its associates collectively or Research Analysts do not own 1% or more of the equity securities of the Company mentioned in the report as of the last day of the month
preceding the publication of the research report. KSBL or its analysts did not receive any compensation or other benefits from the companies mentioned in the report or third party in connection with preparation of the
research report and have no financial interest in the subject company mentioned in this report. Accordingly, neither KSBL nor Research Analysts have any material conflict of interest at the time of publication of this report.
It is confirmed that KSBL and Research Analysts, primarily responsible for this report and whose name(s) is/ are mentioned therein of this report have not received any compensation from the subject company mentioned
in the report in the preceding twelve months. It is confirmed that Research Analyst did not serve as an officer, director or employee of the companies mentioned in the report. KSBL may have issued other reports that are
inconsistent with and reach different conclusion from the information presented in this report. Neither the Research Analysts nor KSBL have been engaged in market making activity for the companies mentioned in the
report. We submit that no material disciplinary action has been taken on KSBL by any Regulatory Authority impacting Equity Research Analyst activities.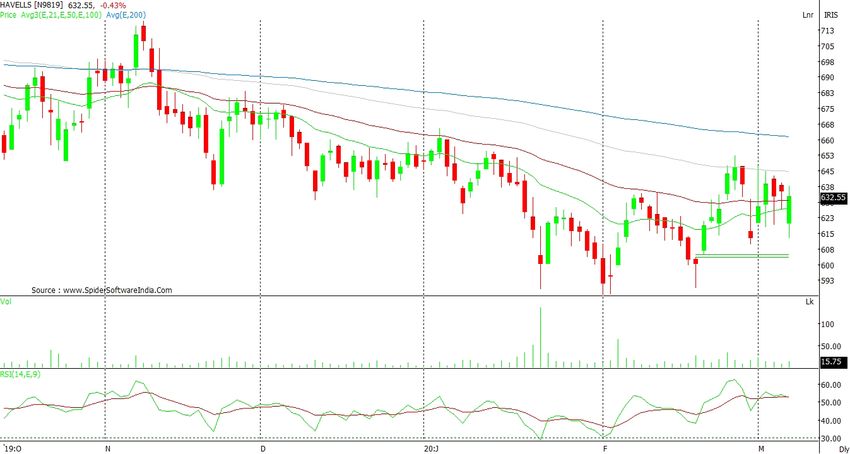
EQUITY

                                           NEWS                                                                                           TRENDSHEET
                                                                                                               SYMBOL           CMP          S2           S1             R1       R2        TREND

Agriculture                                                                                                     SENSEX        37573.56      35817       36695       38767        39961       Down
•   Ten projects worth rupees Rs 301.54 crore with total grant-in-aid of Rs 67.29 crore were sanctioned
    in a meeting of the Inter-Ministerial Approval Committee (IMAC) held under the chairperson ship              NIFTY        10979.55      10474        10727       11333       11686       Down
    of Food Processing Industries minister Harsimrat Kaur Badal in New Delhi.
                                                                                                               NIFTYBANK      27781.15      25616       26699       29327       30874        Down
•   Referring to a recent push to advance negotiations on domestic support with the narrative of
    capping and reducing all forms of trade and production distorting domestic support, India said
                                                                                                                 SBIN          269.70        221          245         303         337        Down
    there was no question of accepting any limit or reduction of such support.
•   Responding to a question by Amit Chavda (Congress) during the Question Hour, Agriculture                   RELIANCE       1269.95       1165         1218        1346        1421        Down
    Minister Faldu said a total of seven companies had collected a premium of Rs 5,862 crore during
    the last two years from state and Central governments, each sharing equal amount of Rs 2,931
                                                                                                               HDFCBANK        1133.85      1045         1090        1190        1245        Down
    crore. For the kharif-2019, claims worth Rs 100.91 crore were already settled.

                                                                                                               YESBANK         16.60         -12           2             34       52         Down
Finance
•   Govt sought authorization for gross additional expenditure of Rs 4.8 lakh crore. Of this, the              ICICIBANK      485.00         451          468            511      538        Down
    proposals involving net cash outgo aggregate to Rs 53,963.58 crore and gross additional
    expenditure, matched by saving of the ministries/departments or by enhanced receipts/
                                                                                                           TATAMOTORS          113.95        99           107         128         141        Down
    recoveries aggregates to Rs 4.26 lakh crore, according to the supplementary demands for grants
    document said.
                                                                                                           BAJFINANCE         4238.00       3716         3977        4558        4879        Down
•   Foreign direct investment into India dipped marginally by 1.4 per cent to USD 10.67 billion (about
    Rs 76,800 crore) during October-December period of 2019-20, according to government data.                    HDFC         2109.45       1995         2052        2208        2306        Down
•   Finance Ministry said that Rs. 16712 Cr of loans were sanctioned to women under ‘Stand Up India’
    scheme. The Stand Up India scheme was launched on April 5, 2016, to facilitate bank loans between      INDUSINDBK         1006.60        796          901        1124        1242        Down
    Rs 10 lakh and Rs 1 crore to at least one Scheduled Caste (SC) or Scheduled Tribe (ST) borrower
    and at least one woman borrower per bank branch of Scheduled Commercial Banks for setting up               AXISBANK        657.70        598          628        700          743        Down
    a green-field enterprise.
•   I-T Department unearths large TDS default in Delhi. The Income Tax Department has detected TDS
    default of more than Rs 3,500 crore after it surveyed a major oil company and a telecom operator
    in the national capital, the CBDT said on Wednesday.                                                                     FORTHCOMING EVENTS
Auto                                                                                                               COMPANY NAME                          EVENT                      EX-DATE
•   Tata Motors asked to pay Rs. 3.5 lakh for misleading advertisement on mileage. The consumer,
    who purchased a Tata Indigo in 2011 after seeing an advertisement which claimed its milegae to
                                                                                                                FINOLEX INDUSTRIES LTD        Interim Dividend – Rs. 10.00         9 Mar 2020
    be 25 kilometres per litre, was disappointed to find out that the car did not provide the promised
    mileage. The advertisement had also claimed that it was India’s most fuel efficient car and that it
    was an offer for a limited period.                                                                     JUBILANT LIFE SCIENCES LTD          Interim Dividend – Rs. 5.00         9 Mar 2020
•   JLR joins hands with Tata Power for electric vehicle charging solutions. According to JLR India
    President and Managing Director Rohit Suri, the partnership with Tata Power will be a tremendous           JUBILANT FOODWORKS LTD          Interim Dividend – Rs. 6.00         9 Mar 2020
    value addition for JLR customers as it provides a one-stop solution to their charging needs and also
    provides easy accessibility to the wide network of public charging infrastructure being set up by
    Tata Power across India said.                                                                              Endurance Technologies Ltd      Interim Dividend – Rs. 5.50         11 Mar 2020
•   China’s factories are beginning to come back to life after an extended lockdown in the country’s
    industrial hubs, and that is good news for several Indian carmakers. According to Mahindra’s                    JK CEMENT LTD              Interim Dividend – Rs. 7.50         11 Mar 2020
    Chief Purchase Officer, situation is improving week after week. Almost all suppliers have started
    production, though at a lower capacity utilization. He further said that if the improvement
    continues at this pace, by early April, supplies from China will be almost normal.                          NIIT TECHNOLOGIES LTD               Buy Back of Shares             11 Mar 2020

Banking                                                                                                        RELAXO FOOTWEARS LTD            Interim Dividend – Rs. 1.25         11 Mar 2020
•   Banks, select financial institutions report frauds worth Rs. 1.43 lak croreduring April – December
    2019. Finance Minister Nirmala Sitharaman said the government in 2015 issued a framework for                  KALPATARU POWER              Interim Dividend – Rs. 3.50         12 Mar 2020
    timely detection, reporting and investigation related to large-value bank frauds to public sector             TRANSMISSION LTD
    banks (PSBs). The framework was issued to deal with bank frauds exceeding Rs 50 crore, if
    classified as non-performing assets.                                                                          POLYCAB INDIA LTD            Interim Dividend – Rs. 7.00         12 Mar 2020
•   The Reserve Bank of India has put an end to the uncertainty on the future of Yes Bank and imposed
    a month-long moratorium by imposing a cap of Rs. 50000 on withdrawals. After restricting               AUTOMOTIVE AXLES INDIA LTD          Interim Dividend – Rs. 6.00         13 Mar 2020
    business transactions, the central bank assured that these actions were taken to protect the
    interests of depositors. Meanwhile assured depositors that their money is safe and will find the
    resolution plan soon.                                                                                       PIDILITE INDUSTRIES LTD        Interim Dividend – Rs. 7.00         13 Mar 2020
•   Bank unions announce strike on March 27 to oppose bank mergers. This comes days after bank
    unions called off a three-day bank strike which was scheduled from March 11. The strike had been             PRAJ INDUSTRIES LTD           Interim Dividend – Rs. 2.70         13 Mar 2020
    called after talks over wage revision failed to initiate with the Indian Banks’ Association (IBA).

FMCG
•   Sanitisers and masks sold put as prices peak due to Coronavirus terror. As Covid-19 patients
    continue to rise in India, some retailers and mask manufacturers are cashing in on the virus terror
    by jacking up prices by 2-3 times. E-commerce platforms have not had stocks of frontline sanitiser                        INTERNATIONAL NEWS
    brands at several locations. Chemist shops in several cities said they are not getting any fresh
    supplies of sanitiser.
•   With consumers across cities and towns increasingly looking to eat right, a flurry of new healthy
                                                                                                           •    The coronavirus could wipe more than $200 billion off Asia Pacific economies this year,
    and organic food products across different segments have hit the shelves. Even online food
    delivery platforms report a spike in demand for healthy, homestyle food.Hence, several new FMCG             S&P Global ratings warned on March 6, sending growth to its lowest level in more than a
    brands, delivery companies such as BigBasket, Swiggy and Zomato are now focusing on healthy                 decade, as governments struggle to combat the disease.
    foods.
                                                                                                           •    Amazon vows to act on price-gouging on coronavirus goods. The US retail giant
•   Coronavirus rumors hit sales of eggand chicken. BS Yadav, managing director of Godrej Agrovet, a            responded to a letter from Senator Ed Markey, who wrote that Amazon appeared to be
    compound animal feed company, told reporters on Thursday that the coronavirus rumour has led
    to a 50% drop in consumption to 35-40 million birds a week, while prices have dropped by 70%.
                                                                                                                profiting from panic buying related to the epidemic. An Amazon spokesperson said in
                                                                                                                an email that the company agrees with Senator Markey -- there is no place for price
Realty/Infra                                                                                                    gouging on Amazon and that’s why the teams are monitoring 24/7 and have already
•   International banking and financial services major BNP Paribas’ India arm has renewed lease of              removed tens of thousands of offers for attempted price gouging.
    over 53,000 sq ft at Maker Maxity in Mumbai’s business district Bandra-Kurla Complex (BKC) at a        •    China’s Belt and Road initiative is getting lashed by coronavirus. The deadly outbreak
    record rental of Rs 540 per sq ft a month
                                                                                                                is prompting delays and disruptions to China’s construction and investment plans
•   NBCC gets NCLT nod to buy Jaypee Infratech. Resolution of Jaypee Infratech’s bankruptcy case                overseas, risking years of planning and hundreds of billions of dollars in economic
    will provide relief to around 20,000 homebuyers in the company’s residential projects in Noida and
    Greater Noida. In its bid, NBCC had proposed to complete these stuck projects.                              diplomacy. Quarantine measures are preventing Chinese workers from making it to
                                                                                                                foreign building sites, domestic firms supplying overseas projects face acute labor
•   Realty developers outsourcing sales to cut recurring costs. The slowdown and demand crunch
    over the last few years have almost forced developers to shift from hiring sales professionals to           shortages and fears are mounting that workers will inadvertently spread the virus to
    handing over sales and marketing responsibility of their projects to strategic consultants such as          new locales.
    Xanadu Realty and The Guardians Real Estate Advisory.
•   Velocity to introduce digital valuation of property in India. The app connects the entire ecosystem
    of lenders and valuers to transform mortgage lending through standardised valuations and
    property analytics, said Carmen Vicelich, founder and CEO of Valocity. The platform is used by
    leading lenders in Australia with over $1 trillion in loan decisions processed via the platform.

KSTREET - 07TH MARCH, 2020                                                                                                                                                                       1
EQUITY
INDIAN INDICES (% CHANGE) SECTORAL INDICES (% CHANGE)
0.0 4.0
Nifty Next 50
Nifty
BSE Midcap
Nifty Midcap 100
Sensex
BSE Smallcap
3.0
-1.0
2.0
-2.0 1.0
0.0
-3.0
Nifty IT
Nifty FMCG
Nifty Metal
Nifty Realty
Nifty Pharma
Nifty Auto
Nifty Bank
Nifty Energy
Nifty Services Sector
Nifty Consumption
-1.0
-4.0
-2.0
-5.0 -3.0
-4.0
-6.0
-5.0
-7.0 -6.0
GLOBAL INDICES (% CHANGE) FII/FPI & DII TRADING (IN RS. CRORES)
6.0 4000.0
5.0 3000.0
4.0 2000.0
3.0 1000.0
2.0 0.0
-1000.0
1.0
-2000.0
0.0
Nikkei
CAC 40
S&P 500
FTSE 100
Shanghai Comp
Dow Jones
Hang Seng
Nasdaq
-3000.0
-1.0
-4000.0
-2.0 02-03-2020 3/3/2020 3/4/2020 3/5/2020 3/6/2020
-3.0 FII/FPI DII
NIFTY MIDCAP100 NSE NIFTY
TOP GAINERS & LOSERS (1W) TOP GAINERS & LOSERS (1W)
40.0 20.0
30.0 10.0
0.0
20.0
CIPLA
HCL TECH
ITC
TATA MOTORS LTD
YES BANK LTD
DR. REDDY'S LAB
SUN PHARMA
STATE BANK OF INDIA
INDUSIND BANK
EICHER MOTORS
-10.0
10.0
-20.0
0.0
CESC
-30.0
PFIZER
HEG
BBTC
FUTURE CONSUMER
JSW ENERGY
PNB HOUSING FINANCE
BATA INDIA
GODREJ PROPERTIES
IPCA LABORATORIES
-10.0
-40.0
-20.0 -50.0
-60.0
Source: Karvy Research
KSTREET - 07TH MARCH, 2020 2EQUITY
BEAT THE STREET - FUNDAMENTAL ANALYSIS
Bata India Ltd. VALUE PARAMETERS
CMP Rs.1548 Face Value (Rs.) 5.0
52 Week High/Low (Rs.) 1897/1251
Target Price Rs.1953
M.Cap (Rs. Bn/US $mn) 198.9/2.7
Upside 26% EPS (Rs.) 25.6
P/E Ratio (times) (FY20E) 47.6
Dividend Yield (%) 0.4
Stock Exchange NSE/BSE
% OF SHAREHOLDING
14.6
Promoters
FII
21.3
Investment Rationale 53.0 DII
• In our view, the long term growth story is intact as branding and
increased distribution has aided in carving our good brand recall Others
and market share.
11.1
• Poor Macros a dampener:
• BATA’s Q3FY20 failed to impress as the impact of slowdown
continues to be visible with inventory pile up the highest in the last
few years on YoY basis, owing to a ‘not so positive’ festive sales. in Rs.Mn ACTUAL ESTIMATE
• While we believe the volumes will continue to be hampered in the Y/E Mar (Rs Mn) FY19 FY20E FY21E
near term (expect he issue to play out into H2FY20), growing ASP
Net Revenues 29284 31503 34227
help sustain value growth.
• Efforts are being made to improve consumption but we remain EBITDA 4773 5450 6092
in a wait and watch mode regarding the execution of the policies EBITDA margin(%) 16% 17% 18%
by GoI. and also the shift in the consumption pattern post the
Net Profit 3297 3752 4184
introduction of the new personal tax structure.
• In the current market, there is a dearth of quality stocks in the EPS(Rs) 25.6 29.2 32.5
consumption space. BATA with strong fundamentals, good brand RoE(%) 20% 19% 17%
recall, efficient management, and a dominant market share in
P/E 54.8 53.0 47.6
the listed space classifies as a quality stock and warrants higher
valuations.
RELATIVE PERFORMANCE
Valuation 125.0
The stock trades at 1 year forward P/E of ~58x. We value the 120.0
stock at 60x, (at 5 year avg + 1sd 1 year fwd P/E valuation) 115.0
and retain our ‘HOLD’ rating. Key risks to our call are further 110.0
105.0
decline in the macros and increase in raw material prices.
100.0
95.0
90.0
85.0
80.0
Jun-19
Jan-20
May-19
Sep-19
Jul-19
Oct-19
Feb-20
Mar-19
Dec-19
Nov-19
Aug-19
Apr-19
Sensex Bata India Ltd.
KSTREET - 07TH MARCH, 2020 3EQUITY
BEAT THE STREET - TECHNICAL ANALYSIS
Ambuja Cements Ltd
STOCK AMBUJACEM
CMP 204.70
ENTRY 200-202
AVERAGE 195
STOP LOSS 190
TARGET 1 220
TARGET 2 235
TIME FRAME 3-4 weeks
AMBUJACEM has been trading in a broad range past several months, which is in between 184 to 225 levels. The recent correction in the stock has brought the stock to its
lower levels of 198, which is a good buying opportunity. The stock is facing stiff resistance at the upper range of the trading range which is pegged around 215 levels. Stock
has seen profit booking around the levels of 200 and bargain hunting around the levels of 205. The stock is currently trading around the major EMAs of 21, 50, 100 and 200
days on daily charts. Stock though around the moving averages is still in the wide trading range, which the stock has witnessed in past many months. On technical setup, the
14 period RSI is taking support of 40 levels indicating that the stock will take support at the lower level of trading range and will bounce. The parabolic SAR is trading below
its price action on weekly charts reflect up trend in the stock will remain intact in medium term. The recent correction in the stock suggests that the stock is well placed to
take it up move. The support is placed around 195 levels and below that are 190 levels. Whereas, minor resistance is placed at placed at 215 levels and above that is 235 levels.
Holding our bullish view in the stock and expecting that up move in the stock will remain intact in near term and stock is well placed to take it up move for upside target of 220
followed by 235 levels with stop loss placed below 190 levels.
Havells India Limited
STOCK HAVELLS
CMP 632.55
ENTRY 620-625
AVERAGE 600
STOP LOSS 580
TARGET 1 680
TARGET 2 695
TIME FRAME 3-4 weeks
HAVELLS has closed the month with positive return of around 2% whereas; Nifty is trading with negative biasness with huge dip. The stock has given the price breakout of
recent swing high of 592 levels and seen supportive volume formation on daily charts. The stock is trading in the broad consolidation range of 586 – 765 levels from couple
of months. The historical price action in the stock reflects that any meaningful dip in the stock attract market participants, which helps stock to resume its up move. The
stock has seen profit taking from all time high of around 808 levels, which has placed the stock near its support of around 590 levels. Thereafter, the stock has bounced well
with supportive volume formation on daily charts, which indicates strength in up move. On technical setup, the 14 period RSI is taking support of the 40 levels and trading
comfortable above signal line on weekly charts. The recent development in the stock suggests that the stock is well placed around support levels to bounce back. The support
is placed around 590-600 levels and below that is 580 levels. Minor resistance is placed at 650 levels and above that is 680 levels. Holding our bullish view in the stock and
expecting that up move in the stock will remain intact in near term and stock is well placed to take it up move for upside target of 680 and above that is 695 levels with stop
loss placed below 580 levels.
KSTREET - 07TH MARCH, 2020 4EQUITY
SECTORAL SNIPPETS
NIFTYAUTO has outperformed the benchmark index Nifty 50 on week to week basis NIFTY IT has outperformed the benchmark index and has witness a relief rally
and ended the week on a negative note with fall of around 0.40%. The index has against the market trend and settled the week in green with positive returns of
witnessed a massive correction from the recent swing high of 8450-8460 levels around 3%, while Nifty 50 index which has lost around 1.90% during the same
from past few consecutive weeks and retraced below to its 38.20% of the Fibonacci period. Index has seen selling pressure from last couple of days which was being
and where it has been hovering from past couple of days, supported by increase in
supported by increase in average traded volumes indicating inherent weakness
average traded volumes indicating weakness at lower technical levels for the time
in the overall counter, until the index is being able to show a closing above its
being. Major heavyweights have witnessed plunged in price post the sales data from
the highs and have contributed in the movement for the index. On weekly chart the 200 DEMA on daily chart. The Index is hovering below all its major EMAs of 21,
index has witnessed resistance from its recent swing high and has plunged from the 50, 100 and 200 days on daily charts as well as on weekly charts, indicating the
same majorly due to the threat possessed because due to the increase in cases of momentum in the index to remain strong in short to medium term. Technically,
corona virus worldwide. On charts, the immediate support for the index is pegged the index is trading below the lower band of keltner channel which is signalling
around 6750-6780 level breaching, below which the next support could be seen continuation in the trend for the index for at least near to short term. As long as
around 6680-6700 levels. While on the contrary, the resistance is pegged around index is trading below the 200 DEMA placed around 15710 levels, it is poised to
7200-7250 level which is the recent swing high, followed by 7400 odd zone which be in bear grip and may test the ATR or the midline of the channel in the weeks
is the next crucial resistance levels for the index. On oscillator front, the index has
to come by, which is around 15300-15400 levels. On Bollinger band (20, 2) index
witnessed resistance at the higher band of the Bollinger band (20, 2) has plunged
is currently hovering just above the lower line on weekly charts, and below
lower to the lower band, at the same time the band has started getting broader
indicating a higher probability of index to burst or to be volatile in near future, this the median line on daily charts. On the indicator front 14 period RSI on weekly
is further being supported by the 14 period RSI which is placed around 31-43 levels charts has taken a huge dip and pointing southwards and has at the same time
and is likely to take support near the same looking at the historical data and trend has witnessed some rally in the last week, situated near 37-40 levels, indicating
suggesting some pullback may be witnessed in the coming trading day. Going the bearishness is intact in the counter, which may take index to the towards the
forward for the coming week, it is advisable to trade cautiously in the counter as swing lows of 15100-15200 levels. For now supports may be assumed at 15100
stock specific action could be seen and it is advised to keep the positions hedge to levels and below at 14800 levels, while resistance may be at assumed at 15800
avoid heavy losses in this market scenario. levels followed by 16000 levels.
NIFTY BANK underperformed the Nifty by losing 4.62% during the week passed NIFTY FMCG outperformed the Nifty with a loss of 1.27% during the week passed
by while the broader index Nifty lost by 1.90%. From December 2019, the index by while the broader index Nifty lost by 1.90%. From January 2020, the index
after witnessing correction from 32600 levels is forming lower lows indicating the after witnessing correction from 31550 levels is forming lower lows indicating the
bears’ firm grip on the index. However, the index may resume its bullish bias if it bears’ firm grip on the index. However, the index may resume its bullish bias if it
crosses and sustains above 28525 levels. In a recent development, The Reserve
crosses and sustains above 29660 levels. FMCG companies are either ramping
Bank of India (RBI) superseded the board of Yes Bank and imposed a month-long
up production or doubling down on distribution efforts to ensure availability of
moratorium, it said in an announcement late on Thursday. It expects to arrive
at a credible restructuring plan in the next few days. The RBI action follows the hygiene products such as hand wash and hand sanitizers on retail shelves to
lender’s inability to raise funds that would have helped it provide against loan meet the massive spike in demand, as India begins reporting an increase in the
losses. Prashant Kumar, former deputy managing director at State Bank of India, number of corona virus cases. Companies have also begun strategic campaigns
will be the administrator of Yes Bank, RBI said. Depositors will be restricted to to raise awareness about hand washing, at a time when the globe is battling with
a maximum withdrawal of Rs 50,000 even if they have multiple accounts, a the virus outbreak. On the stock-specific front, GODREJCP, NESTLEIND and
government gazette notification said. RBI will relax the withdrawal limit in the GODREJIND gained by 14.19%, 4.06% and 4.02% respectively. Among the losers,
event of medical emergencies, higher education fees or marriage expenses up ITC, EMAMILTD and MCDOWELL-N lost by 8.18%, 6.04% and 6% respectively. The
to a cap of Rs 5 lakh. Drafts and pay orders issued so far will be paid in full, it
index may face resistance at 29660 levels followed by 30025 levels. For the week
said. On the other hand, the state-owned Bank of Baroda and HDFC Limited have
ahead, support for the index can be pegged at 28450 levels followed by 28100
lowered interest rates on their home loans marginally. During the week, Finance
Minister Nirmala Sitharaman announced that the Union Cabinet has approved levels.
the plan to merge 10 PSU banks into four larger banks. The merger comes into
effect from April 1 this year. On the stock-specific front, all the stocks in the index
except KOTAKBANK closed in red during the week. The bank marginally gained by
0.85%. Among the losers, YESBANK, SBIN and RBLBANK lost by 52.02%, 10.99%
and 10.76% respectively. As indicated by the derivatives data, Bank Nifty may face
resistance at 29000 levels followed by 29500 levels. For the week ahead, support
for the index can be pegged at 27500 levels followed by 27000 levels.
WEEKLY VIEW OF THE MARKET
NIFTY (10979.55): Indian equity benchmark index Nifty 50 closed lower by 1.90% during the week. During the last two weeks, the index witnessed
correction from 12150 levels towards the low of 10830 levels. Technically, from January 2020, the index after witnessing correction from 12430 levels
is forming lower lows indicating the bears’ firm grip on the index. However, the index may resume its bullish bias if it crosses and sustains above 11090
levels. The global markets dropped on Friday as volatility continued to grip the markets amid investor concerns over the global coronavirus outbreak. In
Asia, equities traded mostly lower, with the main Japanese market down by more than 3%. More than 95,000 people globally have been infected by the
coronavirus so far, while at least 3,200 lives have been taken worldwide, according to the latest figures from the World Health Organization. US Treasury
yields saw sharp declines this week and have continued to touch new record lows after the Federal Reserve announced an unexpected half percentage
point cut from its benchmark interest rate. In the week ahead, markets to remain closed on 10th Mar on the occasion of Holi. Markets participants may
lay their focus on CPI (YoY) (Feb), Industrial Production (YoY) (Jan) and Manufacturing Output (MoM) (Jan) releasing on Mar 12th. On the derivatives
front, open interest data suggests that the index may find its supports around 10900 followed by 10500 levels while on the higher side, 11300 and 11500
levels may act as strong resistance.
KSTREET - 07TH MARCH, 2020 5COMMODITIES
BULLION
The global gold market had witnessed a strong rally in the week ended on 6th March 2020
NEWS DIGEST
engulfing the fall its had witnessed in the last week of February. Attraction of gold as safe-
haven was boosted the prices to touch 7 years high once again as the global equity market
had witnessed a mayhem in the first week of March. The equity market across the global • Russia will not back an OPEC call for extra oil output cuts and will only agree to
nosedived during the week following spreading of corona virus into more countries and
extending existing curbs, a Russian source said on Friday, threatening to derail
increasing the numbers of deaths in all countries other than China. According to Organisation
for Economic Cooperation and Development said that the global economy is set to grow only a call by OPEC ministers for deeper reductions to cope with the coronavirus
2.4% this year, the lowest since 2009. The European Central Bank (ECB) joined the chorus outbreak. OPEC ministers had said on Thursday they backed an additional
of central banks signalling a readiness to deal with the growing threats from the outbreak. 1.5 million barrels per day (bpd) of oil cuts until the end of 2020, a much
U.S. services sector activity jumped to a one-year high in February suggesting strength in
bigger and more extended move than expected, but they made the proposal
the economy before a recent escalation of recession fears ignited by the epidemic that
prompted an emergency interest rate cut. The U.S. House of Representatives overwhelmingly conditional on Russia and other non-OPEC producers backing the curbs.
approved an $8.3 billion funding bill to combat the spread of the virus sending the emergency Iranian Oil Minister Bijan Zanganeh, whose country is a member of OPEC
legislation to the Senate. The U.S. 2-year and 10-year bond yields plunged to all time lows but exempted from any curbs, said on Thursday that OPEC was working with
during the week. The U.S. 2-year bond yield fell by 45% and 10-year yield plunged by 32%
Russia and other non-OPEC states to reach a deal, the SHANA news agency
during the week thereby pushing the gold and silver prices to higher levels. The Bank of Japan
may take steps this month to ensure companies hit by the outbreak do not face a financial reported. The proposed new cuts would be on top of existing curbs of 2.1
squeeze before the March end of the current fiscal year, according to sources familiar with million bpd under an OPEC+ deal due to expire in March. OPEC ministers
the central bank’s thinking. The European Central Bank has asked euro zone banks to review have called for extending that deal as part of a new pact, taking total supply
their business continuity plans and the actions they can take to prepare for and minimize the
reductions to about 3.6 million bpd.
potential adverse effects of the virus. In a surprise move the U.S. Federal Reverse slashed its
interest rate by 50 basis points to fight against Covid-19 much ahead of its schedule monetary • China has granted tariff exemptions for some crushers to import U.S.
policy meeting on 18th March 2020. On domestic front, MCX gold prices rallied to test a fresh
soybeans, five sources told Reuters, in line with a plan it announced in
all time high of Rs. 44924 per 10 as of 5.00 PM IST on Friday, rising by 8.17 week-on-week.
Positive trend in the international market along with weakness in the Indian Rupee against February, aiming to fulfill commitments under its Phase 1 trade deal with the
U.S. Dollar, which weakened by 1.73% added strength to the Indian gold market. USDINR hit its United States. The exemption, which will take effect from the day of issue, will
lowest level since November 2018. be valid for a year. As part of January’s Phase 1 deal, China promised to buy
at least an additional $12.5 billion worth of U.S. farm products in 2020, and at
BASE METALS least $19.5 billion in 2021, over the 2017 level of $24 billion. The government
has asked applicants for monthly purchase plans, said a second source with
The weakness in the base metals market was extended into first week of March as the a major trading house, who has applied for the exemption. Late in February,
number of corona virus cases increased in major countries thereby putting pressure on
Beijing announced it would grant exemptions on retaliatory duties imposed
the global economic growth. China metals producers sought government help as demand
slumps. Base metal prices have fallen but by nowhere near as much as they did in late 2008, against 696 U.S. goods, including soybeans and grains.
suggesting traders are still expecting a fast rebound in activity and metals demand once
• Argentina’s main farm groups will hold a four-day sales strike next week,
the virus is contained in China. Global aluminium producers have increased their offers
to Japanese buyers for the second quarter by as much as 27% from the current quarter. officials with local growers groups said on Thursday, to protest a tax hike that
Smelters have offered primary metal shipments for the April to June period at premium of soy crushing companies warn will cripple investment in the key sector. Adding
between $98 to $105 a tonne. For the January to March quarter, Japanese buyers agreed to to the problems attacking the backbone of Latin America’s third-biggest
pay a premium of $83 per tonne PREM-ALUM-JP, down 14% from the prior quarter. Smelters
economy, farm analysts said dryness was starting to hurt what had until last
have offered primary metal shipments for the April to June period at premium of between
$98 to $105 a tonne. For the January to March quarter, Japanese buyers agreed to pay a week appeared to be promising soybean yields as harvesting was set to get
premium of $83 per tonne PREM-ALUM-JP, down 14% from the prior quarter. The monetary underway. The government on Thursday increased export levies on soybeans,
easing method adopted by various central banks failed to render support to the base metals soymeal and soyoil to 33% from 30%. The move was part of President Alberto
market. Inventories of metal in China piled up this weekunderscoring persistent sluggish
Fernandez’s plan to make the country solvent after announcing it will have to
demand in the world’s top metals consumer amid the coronavirus outbreak. Stocks of five
main steel products held by traders in China, including construction steel rebar and hot- revamp about $100 billion in what it calls unsustainable debt.
rolled coil used in cars and home appliances, hit a new all-time high of 25.27 million tonnes
• Venezuela has swapped millions of barrels of crude for supplies of corn
while ShFE data showed copper inventories near a four-year high. The sky-high inventory
levels show that excess supply is still hanging over the market despite China’s efforts to get and water trucks under an oil-for-food deal struck with a Mexican firm, in
its economy up and running again as the number of new virus infect. Inventories of copper an effort to secure imports amid tightening U.S. sanctions, according to the
in ShFE-approved warehouses rose by a hefty 11.1% from the previous week to 345,126 company and export schedules. The privately owned Mexican firm, Libre
tonnes, the highest since April 2016. LME inventories of nickel climbed to 236,106 tonnes,
Abordo SA, which has no previous experience in the oil sector, has emerged
the highest since September 2018, having more than tripled since early December last year.
as a major lifter of Venezuela’s crude as the state-run oil company PDVSA has
seen its portfolio of customers dwindle due to sanctions aimed at ousting
ENERGY socialist President Nicolas Maduro. Libre Abordo has so far taken 6.2 million
barrels of Venezuelan heavy crude for resale in international markets and has
The global energy market had witnessed a positive trend during initial trading days of the
week on account of short covering and bargain buying at lower price level. Lower cases of
two more cargoes of oil and fuel due to be loaded this month, according to
Covid-19 in China and expectation of deeper production cut by OPEC+ during their meeting PDVSA export programs reviewed by Reuters.
on 5th March supported a positive trend. However, the market failed to sustain the positive
trend in later part of the week and plunged to near to 3-years low as the virus impact
dampened the global oil demand. U.S. crude stocks rose modestly in the latest week, while
U.S. oil exports surged to more than 4 million barrels a day for the first time since December,
just four years after the nation ended a 40-year ban on the practice. Exports of crude oil
rose to 4.2 million barrels per day (bpd), showing terminals were not yet constrained in terms
of meeting overseas demand. The jump occurred even though overall energy consumption
was expected to sag in coming months due to the spread of coronavirus worldwide. Saudi
Arabia and other members OPEC struggled on Wednesday to win support from Russia to
join them in additional oil output cuts to prop up prices that have tumbled by a fifth this year
because of the coronavirus outbreak. Saudi Arabia wants extra cuts of 1 million to 1.5 million
barrels per day (bpd) for the second quarter, and to keep existing cuts of 2.1 million bpd in
place until the end of 2020. Non-OPEC states were expected to contribute 500,000 bpd to
the overall extra cut. But Russia and Kazakhstan, both members of OPEC+, said they had not
yet agreed to the deeper cut, raising the risk of a collapse in cooperation that has propped
up crude prices since 2016.
KSTREET - 07TH MARCH, 2020 6COMMODITIES
TRENDSHEET
% Change from 52 % Change from 52
Commodities 28-Feb 6-Mar % Change 52 Week High 52 Week Low
Week High Week Low
MCX Gold (Rs/10 gms) 41397.0 44648.0 7.9% 44924.00 -0.61% 31232.00 42.96%
MCX Silver (Rs/Kg) 43979.0 47400.0 7.8% 50672.00 -6.46% 35826.00 32.31%
MCX Crude Oil (Rs/bbl) 3263.0 3290.0 0.8% 4692.00 -29.88% 3206.00 2.62%
MCX Natural Gas (Rs/mmBtu) 124.3 130.1 4.7% 205.90 -36.81% 119.60 8.78%
MCX Copper (Rs/kg) 418.7 430.0 2.7% 462.95 -7.13% 399.55 7.61%
MCX Lead (Rs/kg) 145.0 144.5 -0.3% 169.90 -14.95% 123.80 16.72%
MCX Zinc (Rs/kg) 151.9 156.5 3.0% 233.65 -33.04% 149.50 4.65%
MCX Nickel (Rs/kg) 885.2 955.5 7.9% 1314.80 -27.33% 825.60 15.73%
MCX Aluminium (Rs/kg) 135.0 137.7 2.0% 158.25 -12.99% 128.00 7.58%
NCDEX Soybean (Rs/Quintal) 3708.0 3794.0 2.3% 4506.00 -15.80% 3454.00 9.84%
NCDEX Refined Soy Oil (Rs/10 kg) 767.6 794.8 3.5% 955.00 -16.77% 719.55 10.46%
NCDEX RM Seed (Rs/Quintal) 4000.0 4093.0 2.3% 4744.00 -13.72% 3711.00 10.29%
MCX CPO (Rs/10 kg) 692.2 669.5 -3.3% 839.80 -20.28% 491.30 36.27%
NCDEX Castor Seed (Rs/Quintal) 3752.0 3858.0 2.8% 6102.00 -36.77% 3672.00 5.07%
NCDEX Turmeric (Rs/Quintal) 6000.0 5950.0 -0.8% 7360.00 -19.16% 5556.00 7.09%
NCDEX Jeera (Rs/Quintal) 13680.0 13820.0 1.0% 18195.00 -24.05% 13270.00 4.14%
NCDEX Dhaniya (Rs/Quintal) 5922.0 6235.0 5.3% 7688.00 -18.90% 5267.00 18.38%
MCX Cardamom (Rs/kg) 2889.3 2455.0 -15.0% 4265.30 -42.44% 1480.90 65.78%
NCDEX Wheat (Rs/Quintal) 2100.0 2117.0 0.8% 2290.00 -7.55% 1770.00 19.60%
NCDEX Guar Seed (Rs/Quintal) 3660.0 3784.0 3.4% 4508.00 -16.06% 3552.00 6.53%
NCDEX Guar Gum (Rs/Quintal) 6068.0 6240.0 2.8% 9138.00 -31.71% 5886.00 6.01%
MCX Cotton (Rs/Bale) 18190.0 18600.0 2.3% 22540.00 -17.48% 17680.00 5.20%
NCDEX Cocud (Rs/Quintal) 1598.0 1879.0 17.6% 3698.00 -49.19% 1507.00 24.68%
MCX Mentha Oil (Rs/kg) 1215.6 1184.2 -2.6% 1737.70 -31.85% 1130.00 4.80%
FUTURE PRICES (% CHANGE) GLOBAL STOCK POSITION (IN TONS)
Cotton Seed Oil Cake 17.58%
Nickel 7.94%
Gold
COMEX WAREHOUSE STOCKS (IN TONS)
7.85%
Silver 7.78%
Commodity Previous week This week Change % Change
Dhaniya 5.29%
Natural Gas 4.67% Copper 28943 28080 -863 -2.98%
Soy Oil 3.54%
SHANGHAI WAREHOUSE STOCKS (IN TONS)*
Guar Seed 3.39%
Zinc 3.03%
Guar Gum 2.83% Commodity Previous week This week Change % Change
Castor Seed 2.83% Copper 310760 345126 34366 11.06%
Copper 2.69%
Zinc 160011 162402 2391 1.49%
RM Seed 2.33%
Aluminium 439087 479472 40385 9.20%
Soybean 2.32%
Cotton 2.25%
Aluminum 2.04%
Jeera
LME WAREHOUSE STOCKS (IN TONNES)
1.02%
Crude Oil 0.83%
Wheat 0.81% Commodity Previous week This week Change % Change
Barley -0.12%
Copper 161575 219875 58300 36.08%
Lead -0.34%
Turmeric -0.83% Zinc 75375 75425 50 0.07%
Mentha Oil -2.58%
Aluminium 1127400 1092275 -35125 -3.12%
CPO -3.28%
Cardamom -15.03% Lead 66775 67550 775 1.16%
-20.00% -15.00% -10.00% -5.00% 0.00% 5.00% 10.00% 15.00% 20.00%
Nickel 228924 229860 936 0.41%
KSTREET - 07TH MARCH, 2020 7CURRENCY
MARKET STANCE TECHNICAL RECOMMENDATION
USD/INR
Rupee fell 77 paise to hit 74.07 against the US dollar in the morning session
on rising concerns over the financial damage from the coronavirus outbreak.
Pair tested a weekly high of 74.09 and low of 72.04. Rupee hit its lowest level
since October, 2018. The benchmark 10-year Indian bond yield fell to its
lowest of 6.20 per cent since December 7, 2016. Asian equities fell for yet
another session as damage to global business from the coronavirus beyond
China worsened, creating fears of a prolonged global economic slowdown.
Dollar remained under pressure as a new wave of fear about the spread of
the coronavirus and its economic impact troubled investors. Yields on 10-
year US Treasuries fell to a record low as investors increased bets that the
Federal Reserve will follow this week’s surprise 50 basis point rate cut. Sensex
ended 893 points lower at 37,576, while Nifty was down 279 points at 10,989. USDINR traded strong during the week, it made a high of 74.07 and low of 72.04. The
Nifty breached certain crucial supports including the psychological level of RSI is at 81.17. Moving average of 50 is at 71.55. The trend is looking positive for the
week. Hence, recommend Buying at 72.80-72.60 TP 74.50 SL 72.30.
11,000. Sell-off in India was triggered by weak global trend due to coronavirus
outbreak, restricting international travel and trade. Also, moratorium on Yes
Bank led to concern over safety of financial system. Indian Government has
EUR/INR
directed Yes Bank to limit withdrawals of deposits to Rs 50,000, without the
permission in writing of the Reserve Bank of India. U.S. equities benchmark
crashed, Asia trades were lower. Asian equities fell following another Wall
Street rout as disruptions to global business from the coronavirus beyond
China. Dollar suffered losses against the Yen and Euro as U.S. yields plunged
to record lows. Monetary policy easing in the United States, fueled by worries
about the economic impact of the coronavirus, is impacting dollar. Incoming
BoE governor Andrew Bailey lowered expectations of an inter-meeting cut
late telling lawmakers the central bank should wait until it has more clarity.
USD/INR likely to find support at 73.50 and resistance at 74.10 in the near term.
EURINR traded positive during the week, it made a high of 83.68 and low of 79.58.
NEWS FLOWS OF LAST WEEK The RSI is trading at 83.91. Moving average of 50 is at 79.05. The trend is looking
positive for the week. Hence, recommend buying at 82.00 TP 85.20 SL 81.00.
• Rupee fell 77 paise to hit 74.07 against the US dollar in the morning session
on rising concerns over the financial damage from the coronavirus GBP/INR
outbreak.
• Asian equities fell for yet another session as damage to global business
from the coronavirus beyond China worsened.
• Dollar remained under pressure as a new wave of fear about the spread of
the coronavirus and its economic impact troubled investors.
• Yields on 10-year US Treasuries fell to a record low as investors increased
bets that the Federal Reserve will follow this week’s surprise 50 basis point
rate cut.
• Sensex ended 893 points lower at 37,576, while Nifty was down 279
points at 10,989. Nifty breached certain crucial supports including the
psychological level of 11,000. GBPINR traded positive during the week, it made a high of 96.11 and low of 92.04.
The RSI is trading at 70.73. Moving average of 50 is at 93.13. The trend is looking
• Monetary policy easing in the United States, fueled by worries about the positive for the week. Hence, recommend buying at 94.70 TP 98.00 SL 93.50
economic impact of the coronavirus, is impacting dollar. Incoming BoE
governor Andrew Bailey lowered expectations of an inter-meeting cut
late telling lawmakers the central bank should wait until it has more clarity. JPY/INR
• USD/INR likely to find support at 73.50 and resistance at 74.10 in the near
term.
CURRENCY TABLE
Currency Pair Open High Low Close
USDINR 72.09 74.07 72.04 73.79
EURINR 79.73 83.68 79.57 83.58
GBPINR 92.51 96.11 92.04 95.99 JPYINR traded positive during the week, it made a high of 70.3075 and low of
66.5075. The RSI is at 81.73. Moving average of 50 is at 65.49. The trend is looking
JPYINR 66.56 70.30 66.50 70.08 positive for the week. Hence, recommend buying at 68.80 TP 71.50 SL 67.50
KSTREET - 07TH MARCH, 2020 8CURRENCY
ECONOMIC GAUGE FOR THE NEXT WEEK
Date Time Country Indicator Name Period Poll Prefix Unit Prior
10 Mar 18:25 United States Redbook MM W 07 Mar Percent -0.1
10 Mar 18:25 United States Redbook YY W 07 Mar Percent 5.9
11 Mar 16:30 United States MBA Mortgage Applications W 06 Mar Percent 15.1
11 Mar 16:30 United States Mortgage Market Index W 06 Mar Index 754.1
11 Mar 16:30 United States MBA Purchase Index W 06 Mar Index 265.8
11 Mar 16:30 United States Mortgage Refinance Index W 06 Mar Index 3594.4
11 Mar 16:30 United States MBA 30-Yr Mortgage Rate W 06 Mar Percent 3.57
11 Mar 20:00 United States EIA Weekly Crude Stocks W 06 Mar Mln Barrel 0.785
11 Mar 20:00 United States EIA Weekly Dist. Stocks W 06 Mar Mln Barrel -4.008
11 Mar 20:00 United States EIA Weekly Gasoline Stk W 06 Mar Mln Barrel -4.34
11 Mar 20:00 United States EIA Weekly Crude Imports W 06 Mar Mln Barrel -0.476
11 Mar 20:00 United States EIA Weekly Rfg Stocks W 06 Mar Mln Barrel 0.004
11 Mar 20:00 United States EIA Weekly Heatoil Stock W 06 Mar Mln Barrel 0.099
11 Mar 20:00 United States EIA Weekly Prods Imports W 06 Mar Mln Brl/Day 0.284
11 Mar 20:00 United States EIA Weekly Dist Output W 06 Mar Mln Brl/Day -0.198
11 Mar 20:00 United States EIA Weekly Crude Runs W 06 Mar Mln Brl/Day -0.312
11 Mar 20:00 United States EIA Weekly Refining Util W 06 Mar Percent -1
11 Mar 20:00 United States EIA Wkly Crude Cushing W 06 Mar Mln Barrel -1.971
11 Mar 20:00 United States EIA Weekly Gasoline O/P W 06 Mar Mln Brl/Day -0.04
11 Mar 23:00 United States EIA Ethanol Ref Stk W 06 Mar Thou Barrel 24964
11 Mar 23:00 United States EIA Ethanol Fuel Total W 06 Mar Thou Brl/Day 1079
9 Mar 15:00 Euro Zone Sentix Index Mar 2020 -5 Diff.Idx 5.2
9 Mar 19:30 United States Employment Trends Feb 2020 Index 110.2
10 Mar 07:00 China (Mainland) PPI YY Feb 2020 Percent 0.1
10 Mar 07:00 China (Mainland) CPI YY Feb 2020 Percent 5.4
10 Mar 07:00 China (Mainland) CPI MM Feb 2020 Percent 1.4
10 Mar 07:30 China (Mainland) Total Social Financing Feb 2020 Bln CNY 5070
10 Mar 15:30 United States NFIB Business Optimism Idx Feb 2020 Index 104.3
10 Mar 15:30 Euro Zone Employment Overall Final Q4 2019 Thou Person 160584.6
10 Mar 15:30 Euro Zone Employment Final YY Q4 2019 Percent 1
10 Mar 15:30 Euro Zone Employment Final QQ Q4 2019 Percent 0.3
10 Mar 15:30 Euro Zone GDP Revised QQ Q4 2019 0.1 Percent 0.1
10 Mar 15:30 Euro Zone GDP Revised YY Q4 2019 0.9 Percent 0.9
10 Mar : China (Mainland) M2 Money Supply YY Feb 2020 Percent 8.4
10 Mar : China (Mainland) New Yuan Loans Feb 2020 Bln CNY 3340
10 Mar : China (Mainland) Outstanding Loan Growth Feb 2020 Percent 12.1
10 Mar : China (Mainland) FDI (YTD) Feb 2020 Percent 4
10 Mar : India Trade Deficit Govt -USD Feb 2020 Bln USD 15.17
10 Mar : India Imports - USD Feb 2020 Bln USD 41.14
10 Mar : India Exports - USD Feb 2020 Bln USD 25.97
11 Mar 17:00 India M3 Money Supply W 28 Feb Percent 9.6
11 Mar 18:00 United States Core CPI MM, SA Feb 2020 0.2 Percent 0.2
11 Mar 18:00 United States Core CPI YY, NSA Feb 2020 2.3 Percent 2.3
11 Mar 18:00 United States CPI Index, NSA Feb 2020 Index 257.971
11 Mar 18:00 United States Core CPI Index, SA Feb 2020 Index 266.48
11 Mar 18:00 United States CPI MM, SA Feb 2020 0 Percent 0.1
KSTREET - 07TH MARCH, 2020 9CURRENCY 11 Mar 18:00 United States CPI YY, NSA Feb 2020 2.3 Percent 2.5 11 Mar 18:00 United States Real Weekly Earnings MM Feb 2020 Percent 0.1 11 Mar 18:00 United States CPI MM NSA Feb 2020 Percent 0.39 11 Mar 18:00 United States CPI Index SA Feb 2020 Index 258.82 11 Mar 20:30 United States Cleveland Fed CPI Feb 2020 Percent 0.3 11 Mar 21:30 United States TR IPSOS PCSI Mar 2020 Diff.Idx 62.9 11 Mar 23:30 United States Federal Budget,$ Feb 2020 Bln USD -33 12 Mar 15:30 Euro Zone Industrial Production MM Jan 2020 1.2 Percent -2.1 12 Mar 15:30 Euro Zone Industrial Production YY Jan 2020 -3.4 Percent -4.1 12 Mar 17:30 India CPI Inflation YY Feb 2020 Percent 7.59 12 Mar 17:30 India Industrial Output YY Jan 2020 Percent -0.3 12 Mar 17:30 India Cumulative Ind. Output Jan 2020 Percent 0.5 12 Mar 17:30 India Manufacturing Output Jan 2020 Percent -1.2 12 Mar 18:00 United States PPI Final Demand YY Feb 2020 Percent 2.1 12 Mar 18:00 United States PPI Final Demand MM Feb 2020 0 Percent 0.5 12 Mar 18:00 United States PPI exFood/Energy YY Feb 2020 Percent 1.7 12 Mar 18:00 United States PPI exFood/Energy MM Feb 2020 0.2 Percent 0.5 12 Mar 18:00 United States PPI ex Food/Energy/Tr YY Feb 2020 Percent 1.5 12 Mar 18:00 United States PPI ex Food/Energy/Tr MM Feb 2020 Percent 0.4 12 Mar 18:15 Euro Zone ECB Refinancing Rate Mar 2020 0 Percent 0 12 Mar 18:15 Euro Zone ECB Deposit Rate Mar 2020 -0.5 Percent -0.5 13 Mar 07:30 China (Mainland) TR IPSOS PCSI Mar 2020 Diff.Idx 59.86 13 Mar 07:30 India TR IPSOS PCSI Mar 2020 Diff.Idx 58.68 13 Mar 17:00 India Trade Balance-RBI Q4 2019 Bln USD -38.1 13 Mar 17:00 India C/A Bal. $ Q4 2019 Bln USD -6.3 13 Mar 17:00 India Balance Payments $ Q4 2019 Bln USD 5.1 13 Mar 17:00 India Current Account/GDP (Q) Q4 2019 Percent -0.9 13 Mar 18:00 United States Import Prices MM Feb 2020 -0.5 Percent 0 13 Mar 18:00 United States Export Prices MM Feb 2020 -0.2 Percent 0.7 13 Mar 18:00 United States Import Prices YY Feb 2020 Percent 0.3 13 Mar 19:30 United States U Mich Sentiment Prelim Mar 2020 97 Index 101 13 Mar 19:30 United States U Mich Conditions Prelim Mar 2020 Index 114.8 13 Mar 19:30 United States U Mich Expectations Prelim Mar 2020 Index 92.1 13 Mar 19:30 United States U Mich 1Yr Inf Prelim Mar 2020 Percent 2.4 13 Mar 19:30 United States U Mich 5-Yr Inf Prelim Mar 2020 Percent 2.3 KSTREET - 07TH MARCH, 2020 10
You can also read