Run Your Electric Meter Backwards - OTC BB: AKNS
←
→
Page content transcription
If your browser does not render page correctly, please read the page content below

Run Your Electric Meter Backwards
           OTC BB: AKNS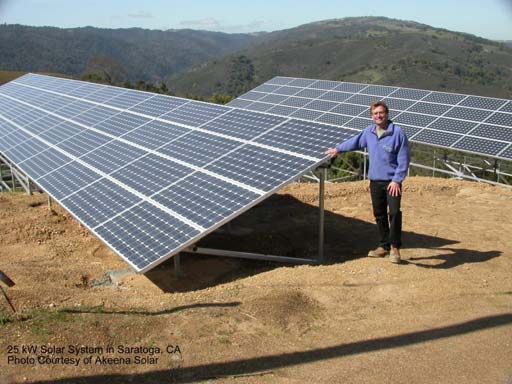
Safe Harbor Statement

Statements made in this presentation that are not historical in nature
constitute forward-looking statements within the meaning of the Safe
Harbor Provisions of the Private Securities Litigation Reform Act of 1995.
Such statements are based on the current expectations and beliefs of
the management of Akeena Solar and are subject to a number of risks
and uncertainties that could cause actual results to differ materially from
those described in the forward-looking statements. For a more detailed
discussion of factors that affect Akeena Solar’s operations, please refer
to the company’s Securities and Exchange Commission filings. The
company undertakes no obligation to update this forward-looking
information.

2

Akeena Solar Investment Highlights
Industry and Market Opportunity
Solar power industry growing 30% a year – $19 billion by 2010,
according to SolarBuzz
Additional upside from new federal and/or state incentives
Highly fragmented industry – classic rollup opportunity
Leading Company
Growing organically 50%+ a year with sales >$10M in 2006
Consistent branding, quality reputation
Experienced management team
Demonstrated ability to open and effectively manage remote
operations
Founded in 2001, public in 2006 via reverse merger
Solid financial foundation
Patent-pending Proprietary Technology
Expected to reduce total installation costs by approximately 10%
3
Photovoltaic (PV) = Solar Energy
Solar power systems convert
energy in sunlight directly into
electrical energy
This conversion (based on PV
effect) occurs within solar cells
which are electrically
interconnected into solar
modules
Akeena designs and integrates
grid-connected solar power
systems
Run your electric meter backwards
4
A Sample Residential Installation

                             Installer Cost        $45,000
                              NJ Rebate            (30,000)
                              Federal Tax Credit    (2,000)
                             Customer Net Cost     $13,000
                             Annual Savings
                              Electricity          $1,000
                              NJ Renewable
                                Energy Credit      $1,000
                             Simple Payback        6.5 years

5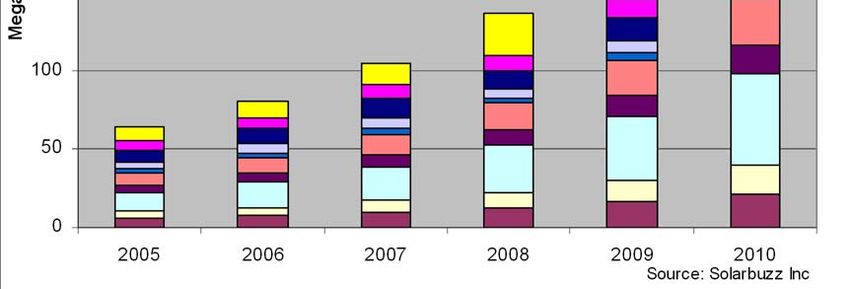
Solar Power Industry Value Chain

                                          Designer/Integrator

                               Module Manufacturers
                               (adds glass and aluminum)

                     Wafer and Cell Manufacturers
                     (semiconductor)

          Silicon Refiners
          (turns sand into silicon)

6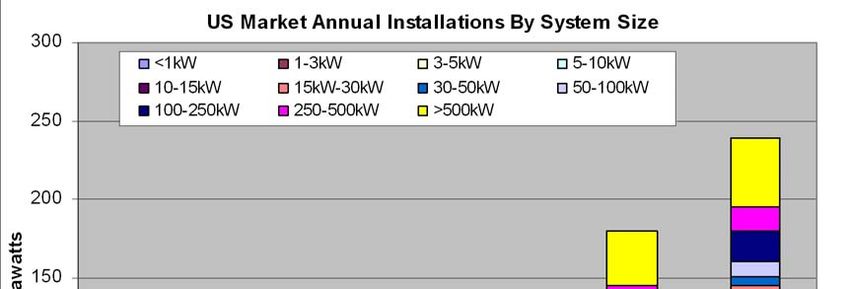
Growing Market Opportunity
Energy and environment fundamentals drive solar power growth
U.S. projected to be largest growth market in world
Residential / small commercial segment projected to be ~65% of U.S.
market now through 2010
7
Incentives Spur Growth
Many states offer substantial incentives to the consumer in
form of direct rebates, state tax credits, system
performance payments, Renewable Energy Credits (REC)
California and New Jersey – two markets where Akeena operates –
currently account for 90% of the U.S. residential market1
California is third leading market for solar in the world
At least 18 other states also have incentive programs in place2
Federal level: 30% tax credit for installation of solar power
systems
Current legislation runs through 2007
Pending legislation expected to extend and increase credits
1 Source: PV News
2 Source: Database of State Incentives for Renewable Energy (DSIRE)
8Established Leadership
Akeena brings six year
track record with consistent
branding, quality reputation 700
598
600
Installed over 500 solar 500
power systems to date 400 350
One of the largest national 300
integrators of solar power 200
systems in U.S. over the past 100
three years1 0
1H05 1H06
Expansion of federal & Kilowatts installed
state incentives
accelerates market growth
1 Source: Data compiled by California Energy Commission and New Jersey Clean Energy Program
9Growing List of Customers
Targeting residential
and small commercial
markets
Strong local presence in
major markets
2 fully equipped
installation offices
service both coasts
West via Los Gatos, CA
headquarters
East via Fairfield, NJ
10Knowledgeable, Experienced Team
Barry Cinnamon, President and CEO
20 years experience in renewable energy and technology
President of California Solar Energy Industries Association (CalSEIA)
Active participant in federal & state government relations
North American Board of Certified Energy Practitioners Certified PV
Installer™, California C-46 contractor
David “Lad” Wallace, CFO
Senior financial management experience (from CFO to Controller)
developing both Sarbanes Oxley and ISO 900X procedures in various
industries
Bill Scott, Executive Vice President
18 years in the renewable energy industry and 10 years in information
systems technology with responsibilities in sales, marketing and
operations
Douglas Sandlaufer, VP, Residential Sales
Joined Akeena full-time in January 2006 with more than 30 years
experience in the heating and cooling industry
11Solid Financial Foundation
Sequential sales growth year-over-year since commencing
operations in 2001
Net sales for the Q206 were $2.8M
105% increase compared to $1.4M in Q205
13% increase compared to net sales of $2.5M in Q106
Net sales for the H106 were $5.3M
106% increase compared to $2.6M in H105
75% of 2005 revenue of $7.1M
$2.7 million in net proceeds from private placement
provides Akeena with sufficient working capital
Targeting organic revenue growth of at least 50% annually
in 2006 and 2007
12Growth Strategy Target Milestones
Continue expanding in current target markets
California and New Jersey
Other states with good solar incentives and higher
electricity prices
Increase inventory supply to meet demand
Target, negotiate and successfully integrate acquisitions
Develop proprietary module technology
13Current Solar Module Installation 14
R&D to Drive Competitive Advantage --
Increase Productivity & Profitability
Developing patent-pending
solar module technology
Plug and play modules
assemble like Legos $46,000
Three-year Goal
Works with all types of $45,000 $40,500
$45,000
framed modules
Faster, cheaper $44,000
installation $43,000
Improves system $42,000
10% savings
aesthetics $41,000
GOAL: To cut net $40,000
installation costs by $39,000
$0.50-$1.00 per installed $38,000
watt, or ~10% of entire cost Total installation Total installation
of system cost cost
Creating higher margins
Flowing directly to the
bottom line
15Akeena Module Technology 16
Akeena Solar Module Technology
Market Potential
Manufacture modules
For Akeena only
For sale to select partners
License technology
Interest from major vendors
Sharp, Kyocera, Sanyo and SunPower
Especially beneficial for use with lower efficiency cells, thin films,
etc. that require more area per installed kilowatt
17Akeena Solar Investment Highlights
Industry and Market Opportunity
Solar power industry growing 30% a year – $19 billion by 2010,
according to SolarBuzz
Additional upside from new federal and/or state incentives
Highly fragmented industry – classic rollup opportunity
Leading Company
Growing organically 50%+ a year with sales >$10M in 2006
Consistent branding, quality reputation
Experienced management team
Demonstrated ability to open and effectively manage remote
operations
Founded in 2001, public in 2006 via reverse merger
Solid financial foundation
Patent-pending Proprietary Technology
Expected to reduce total installation costs by approximately 10%
18Run Your Electric Meter Backwards
OTC BB: AKNSAPPENDIX 20
Condensed Statement of Operations
                                                     Three Months Ended June 30,       Six Months Ended June 30,
                                                        2006           2005                2006         2005

Net sales                                            $   2,812,424    $   1,372,404    $   5,302,597    $   2,573,037
Cost of sales                                            2,097,742        1,173,710        4,019,539        2,135,184
         Gross profit                                      714,682          198,694        1,283,058          437,853
Operating expenses
Selling, general and administrative                       949,315          394,775         1,485,030         689,283
          Total operating expenses                        949,315          394,775         1,485,030         689,283
          Income from operations                         (234,633)        (196,081)         (201,972)       (251,430)
Other income (expense)

Interest income (expense), net                            (13,164)          (4,259)          (26,195)         (4,354)
           Total other income (expense)                   (13,164)          (4,259)          (26,195)         (4,354)
Net loss                                             $   (247,797)    $   (200,340)    $    (228,167)   $   (255,784)

Earnings per common and common equivalent share:
 Basic and diluted                                   $       (0.03)   $       (0.02)   $       (0.03)   $       (0.03)

Weighted average shares used in computing earnings
 per common and common equivalent share:
 Basic and diluted                                       9,000,000        9,000,000        9,000,000        9,000,000

21
Condensed Consolidated Balance Sheet
June 30, 2006 June 30, 2005
Assets (unaudited)
Current assets
Cash and cash equivalents $ 50,332 $ (27,506)
Accounts receivable, net 1,788,946 729,053
Inventory 1,327,580 883,737
Prepaid expenses and other current assets 876,460 363,329
Total current assets 4,043,318 1,948,613
Property and equipment, net 70,759 99,489
Due from related party 21,025 21,025
Other assets 3,927 3,927
Total assets $ 4,139,029 $ 2,073,054
Liabilities and Stockholder's Equity
Current liabilities
Accounts payable $ 2,070,322 $ 1,444,122
Accrued liabilities 502,148 261,190
Accrued warranty 372,171 234,407
Deferred revenue 902,903 311,741
Credit facility 500,000
Current portion of long-term debt 15,957 16,500
Total current liabilities 4,363,501 2,267,960
Long-term debt, less current portion 14,214 35,311
Total liabilities 4,377,715 2,303,271
Stockholder's equity:
Common stock $0.01 par value; 16,000,000 shares authorized;
9,000,000 shares issued and outstanding at June 30, 2006 90,000 90,000
Accumulated deficit (328,686) (320,217)
Total stockholder's equity (238,686) (230,217)
Total liabilities and stockholder's equity $ 4,139,029 $ 2,073,054
22You can also read