SARS-COV-2 VARIANTS AND VACCINATION IN BELGIUM V2021-03-25 - COVID EN ...
←
→
Page content transcription
If your browser does not render page correctly, please read the page content below
- technical note - not peer reviewed -

  SARS-CoV-2 variants and vaccination in Belgium [v2021-03-25]

Modelling results by the SIMID consortium (www.simid.be)

This document contains our latest results on the short-term prediction modelling of hospital
and ICU admissions, and scenario analyses based on dynamic transmission modelling.

Preliminary conclusions
   ● The age-specific vaccination uptake and the higher transmissibility and severity of
       variants of concern (VOC), primarily VOC-202012/1 or lineage B.1.1.7, have caused a
       change in the relation between confirmed COVID-19 cases, daily number of new
       hospitalizations, ICU load and number of COVID-19 related deaths (see e.g. Davies et al.
       2021, Patone et al. 2021).
   ● Model scenarios informed by epidemiological data until March 22nd, 2021 and social
       contact data until March 9th 2021, show an increase up to 330 new hospital admissions
       per day, on average, by the end of April. The projected hospital load corresponds with
       >4000 occupied hospital beds at the peak, on average, by May 2021. However, these
       projections show a large uncertainty interval and should be interpreted with care.
   ● Model scenarios assuming an instant decrease in transmission from the 29th of March
       onwards, show a sharp drop in hospital admissions early April and a reduced hospital
       load. The magnitude of the reduction depends on contact behavior and adherence to the
       measures.

Short-term modelling
Summary: The short-term prediction model for both the number of new hospitalizations and
ICU load that was used previously, had to be adapted for the presence of the VOC in order to
explain the observed trends in the data.

Model assumptions to predict new hospitalizations
  - The short-term prediction model is based on a statistical regression model, called a
      distributed lag non-linear model (Gasparrini et al. 2017).
  - The model compares the trend in the number of new hospital admissions at province
      level with a set of early-warning predictors. They are early-warning in the sense that the
      observed value of the predictors on a given day d, is related to the number of new
      hospitalizations some days later (d+x).
  - The selected predictors for new hospitalizations are the positivity ratio of the COVID-19
      tests and the mobility. There is a small delay (between 4 to 7 days) between the trend of
      the positivity ratio and the number of hospitalizations, such that we can predict the
      number of new hospitalizations ahead in time. This delay is linked to the time between
      symptom onset and hospitalization (Faes et al. 2020). The mobility is based on mobile
      network data, and is highly correlated with the intervention measures taken.
  - To allow for a prediction over a period of 2 weeks, the positivity ratio is further informed
      with the number of patients with respiratory symptoms that visit the GP (COVID-19
      barometer data, https://covid19.healthdata.be/) and data on absenteeism at work,

                                                                                        1/11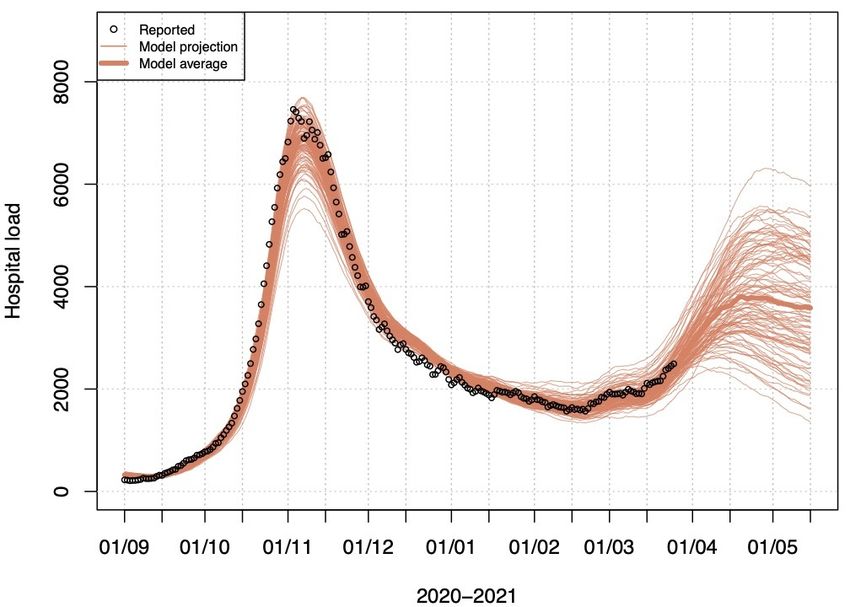
which are both associated with new hospitalizations in 10 to 14 days. This is similar to the
       mean time between symptom onset and hospitalizations for the working ages.
   -   The rate of hospitalization is also allowed to change based on the proportion of VOC in
       the population.
   -   There are strong indications from individual (networks of) hospitals that transfer to
       intensive care, conditional on hospital admission, is changing. More precisely, it seems
       both transfer to ICU and length of stay in ICU have increased since the beginning of March
       2021. However, we have no reliable national data on age distributions of admitted
       patients to hospitals and ICU, after 20 February 2021, due to a delay in reporting of the
       hospital stay (Van Goethem et al. 2020). At the time of analysis, there was no data
       available to us on hospitalized patients regarding the variant that infected them, nor of
       their vaccination status.

              Figure 1: Proportion of VOC B.1.1.7 SARS-CoV infections in Belgium
                               (source: GitHub Tom Wenseleers)

  Figure 2: Short-term prediction model without VOC (left) and with VOC (right) adjustments.
      Dots are the reported number of new hospitalizations; grey bands are predictions.

Model results
The prediction model that does not take into account the VOC is underestimating the observed
number of hospitalizations, while the model that allows for a change in the rate of
hospitalizations due to infections with the VOC captures the observed number of
hospitalizations. The prediction model accounting for the VOC predicts between 222 and 368
new hospital admissions on April 3rd.

                                                                                           2/11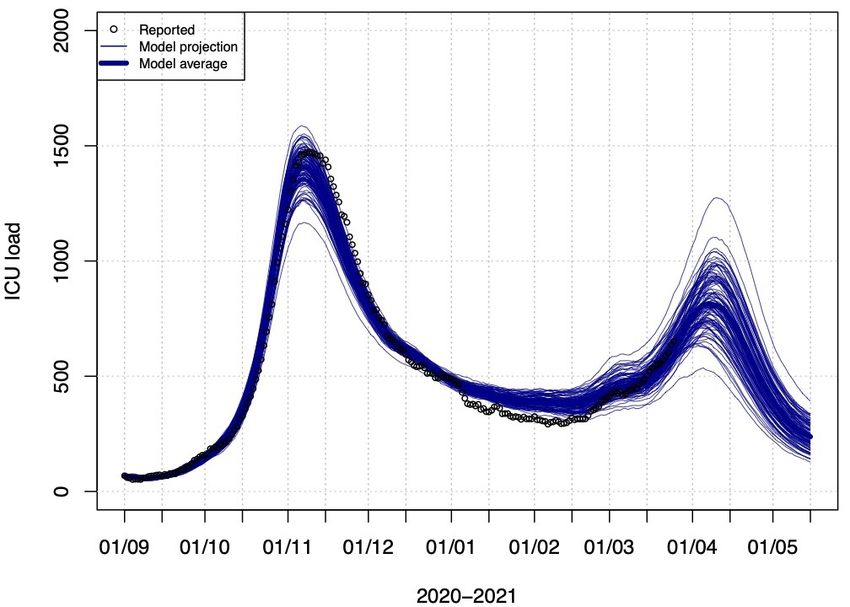
Model assumptions to predict ICU load
  - We use the bi-monthly distribution of hospital and ICU length of stay and proportion of
      hospitalized patients going to ICU.
  - These probabilities are combined with the observed and predicted new hospitalizations
      to calculate the number of patients in ICU.
  - The short-term prediction model of hospital load had to be adapted for ICU load as well,
      allowing for a higher proportion of hospitalized patients that need ICU care (an increase
      of 30% is assumed).

Model results
In case we do not allow for a change in hospitalization rate and changed flow to ICU due to the
VOC, we are unable to capture the steep increase in ICU beds observed since the beginning of
March. The model accounting for VOC predicts between 649 and 811 patients in ICU on April
5th.

    Figure 3: Short term prediction of ICU load (left: no increased proportion of hospitalized
        patients to ICU, right: 30% increase in proportion of hospitalized patients to ICU)

Dynamic Transmission Model
Summary: The stochastic model (https://doi.org/10.1016/j.epidem.2021.100449) has been
adapted to include vaccination and the emergence of the VOC B.1.1.7. The model is calibrated
on early sero-prevalence data, hospital admission data until March 22nd and social contact data
from the 17th wave of the CoMix survey conducted from 3 to 9 March, 2021. Model projections
account for the increasing vaccine uptake and the projected hospital admissions are translated
into hospital and ICU load using the methodology of the short-term prediction model described
above.

Model input and assumptions
  1. Gradually accumulating naturally-acquired immunity in the population is accounted for,
       as well as immunity induced by vaccination. Vaccine-induced immunity after a full
       schedule is assumed to last till the end of the simulations.
  2. The impact of the introduction of VOC B.1.1.7 in the Belgian population is accounted for
       using separate data analyses on the gradual penetration of the VOC (i.e. VOC B.1.1.7,
       Wenseleers 2021) and its additional transmissibility is estimated by the model while
       fitting from January 1, 2021 onward at approximately 40% relative to the old variant.

                                                                                          3/11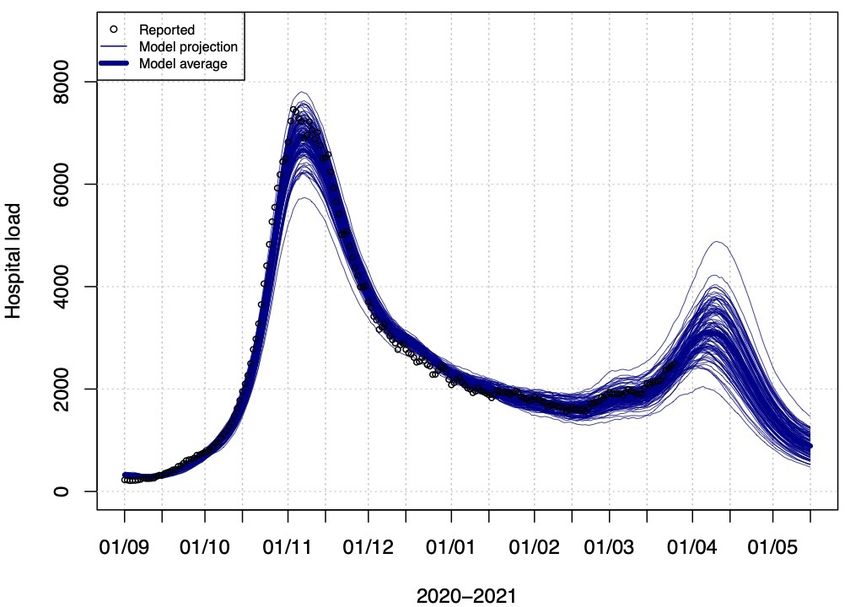
3. The model was calibrated allowing for a differential hospital admission probability with
   respect to the VOC. The increase in the probability of being admitted to hospital was
   estimated at 36.5% (95% Credible Interval: 35.3%-40.1%).
4. This model is fully age-structured but does not simulate the physical interactions of
   subgroups like nursing home residents and nursing home personnel or healthcare
   workers in general, separately from other groups in the population. Vaccine uptake is
   therefore implemented at the level of the ages of the target groups.
5. Social mixing and transmission dynamics:
       a. Scenario A: We assume no changes in social mixing behavior compared to the
           estimated dynamics up to March 22nd and schools are closed from April 5th, 2021
           until April 18th, 2021.
       b. Scenario B: We assume an instant shift in behavior (i.e., transmission dynamics)
           on March 29th in line with the estimated dynamics for the week of October 19-25,
           2020 during the second Belgian lockdown. This behavior is assumed to be
           maintained for 3 weeks, and afterwards social contact behavior of early March
           2021 is resumed. This is a purely illustrative scenario on the impact of behavioral
           changes, which is not intended as a justification for the measures that were in
           place in that period.
       c. Scenario C: assumes the behavior shift as in scenario B with an arbitrary increase
           in the transmission rate of 30%. As such, this scenario is intended to illustrate the
           impact of a less strict lockdown/lower adherence.
6. Vaccine protection
       a. Infection: we use a “leaky” vaccination approach. For example, vaccination with
           75% effectiveness, implies that the likelihood to acquire infection for a vaccinated
           individual is 75% less compared to a non-vaccinated individual of the same age.
           The vaccines are assumed to protect against the VOC to the same extent as to the
           (originally dominant) wild type virus.
       b. Hospital admissions: vaccinated individuals who acquire infection have a lower
           risk for COVID-19 related hospital admission. Pending more evidence, we assume
           an overall reduction of 100% as shown in different vaccine trials (Creech et al
           2021).
       c. Severe non-hospitalized cases are currently not separately modelled, hence the
           impact of vaccination on non-hospitalized severe cases, seen in “primary care” is
           not separately shown.
       d. Vaccine-induced immunity is implemented as a step function with a switch from
           0% to 75% protection against infection 21 days after the first dose. Vaccine-
           induced protection against hospital admission is implemented in the same way.
           For the purpose of this document, we do not consider differences between mRNA
           and adenovirus-based vaccines.
       e. Waning immunity is not included at this stage given the relative short time
           horizon after their deployment in the simulation. As such, the second dose is not
           modelled explicitly in the current analyses.

                                                                                        4/11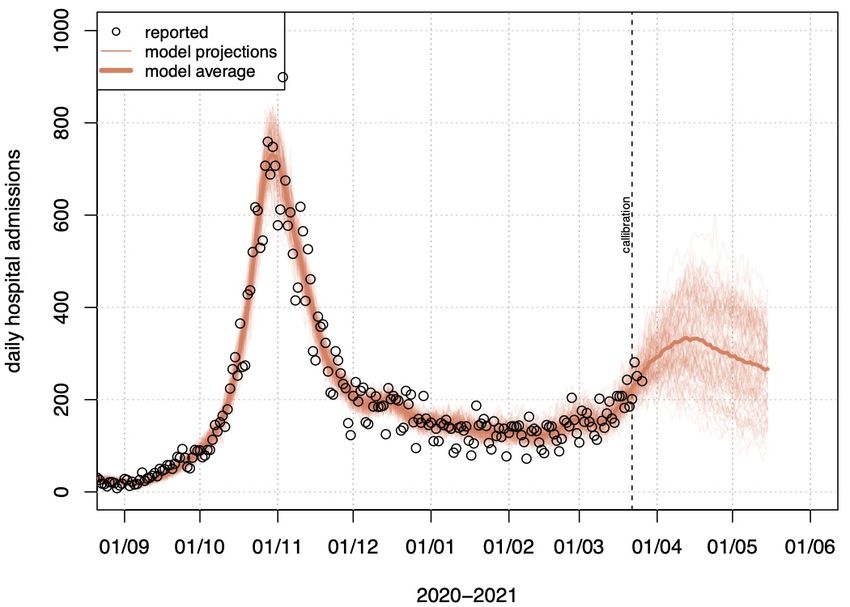
7. Vaccine uptake
         a. Age-specific uptake scheme targeting the most vulnerable population first, based
             on the reported uptake until 16th March and non-confirmed estimates on the
             available doses until May 1st (see Table 1). This is a possible scenario of vaccine
             uptake and could further change depending on the confirmed delivery schemes.
         b. The uptake until 16th of March is based on registrations in VaccinNet via the
             Sciensano dashboard.
         c. Target group vaccination until February is translated into age categories as follows
                i. Health-care-workers: active population of 20-50y
               ii. Nursing home population: 80-89y

Table 1: Cumulative uptake of at least one dose as % of the Belgian population by age group
                 20-49y        50-59y        60-69y        70-79y        80-89y         +90y

  1/2/2021         3%            3%            0%            0%           25%            0%

  1/3/2021         6%            6%            0%            0%           25%            0%

  1/4/2021         9%            9%            0%           39%           74%           91%

  1/5/2021         9%            9%           36%           67%           74%           91%

Major limitations (and future work)
  1. This model is suited for scenario analyses to investigate possible future paths, it is not a
       prediction model.
  2. The model is calibrated on hospitalizations up to 22nd March 2021, and is informed by
       the last available wave of the CoMix social contact data survey dating from the week of 3
       March 2021. These empirical social contact data inform mainly the frequency and age
       structure of physical social interactions, but are less informative with regards to the
       adherence to restrictions. The fact that the model is primarily calibrated on
       hospitalizations, and given the time lag between incurring infection and being admitted
       to hospital makes this model less sensitive for rapidly changing dynamics, especially when
       empirical data on physical contacts to inform the model is lagging.
  3. We are using data on the penetration of VOC B.1.1.7, making the implicit assumption that
       this will remain the dominant strain throughout the simulations. Nonetheless other VOC
       may take over from B.1.1.7, with different probabilities of transmission, disease,
       hospitalization, death, and different vaccine effectiveness characteristics against each of
       these manifestations.
  4. The transmission model does not evaluate the prevented (severe) outpatient cases,
       which affect pressure exerted on primary care. The model does not include parameter
       uncertainty on vaccine uptake and effectiveness yet, and assumes no waning of vaccine-
       induced and naturally acquired immunity. The model is fitted to mortality data by age for
       the first wave, but this has not been done yet for the second wave.
  5. We assume a similar vaccine related protection for VOC and non-VOC.
  6. Vaccine-induced immunity is implemented by a step function. As such, it is assumed that
       there is no gradual build-up of immunity in vaccinated persons.
  7. We show the model projections from 100 stochastic realizations.

                                                                                          5/11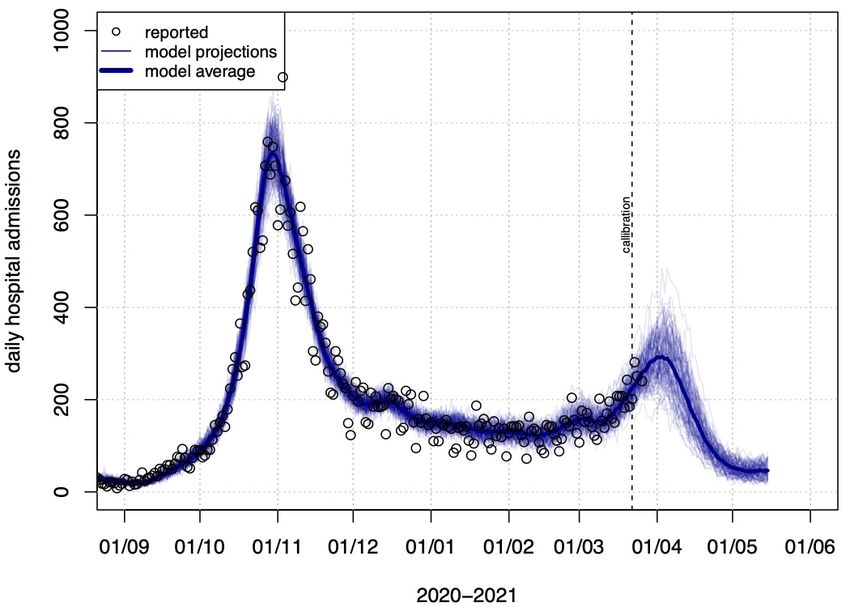
8. The state transitions in the dynamic compartmental model are based on exponential
      rates that correspond with the following average periods:
          a. Latency period: 1.06 day
          b. Infectious period at pre-symptomatic stage: 2.14 days
          c. Time between symptom onset and hospitalization by 10-year age group:
              [11.45; 10.06; 10.01; 9.09; 7.26; 4.65; 4.63; 3.42; 2.99; 3.32] days
          d. The average time between infection and hospital admission for individuals >50
              years of age ranges between 6.19 – 7.85 days.
   9. The age-specific vaccine uptake until March 2021 is not fully in line with the reported
      uptake by Sciensano, and is subject for further research.

Model results

Scenario A: with continued constant social contact behavior (as estimated in early March)

 Figure 4: Model projections on daily hospital admissions if social contact behavior from early
      March 2021 is kept constant and the vaccination campaign continues (Scenario A).

                                                                                         6/11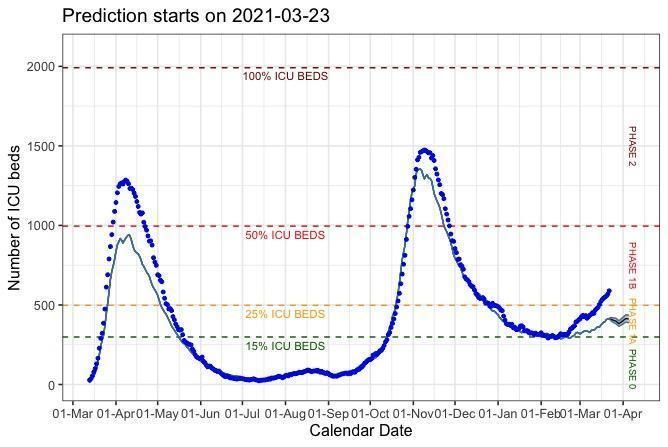
Figure 5: Model projections on hospital load if social contact behavior from early March 2021 is
kept constant and the vaccination campaign continues (Scenario A).
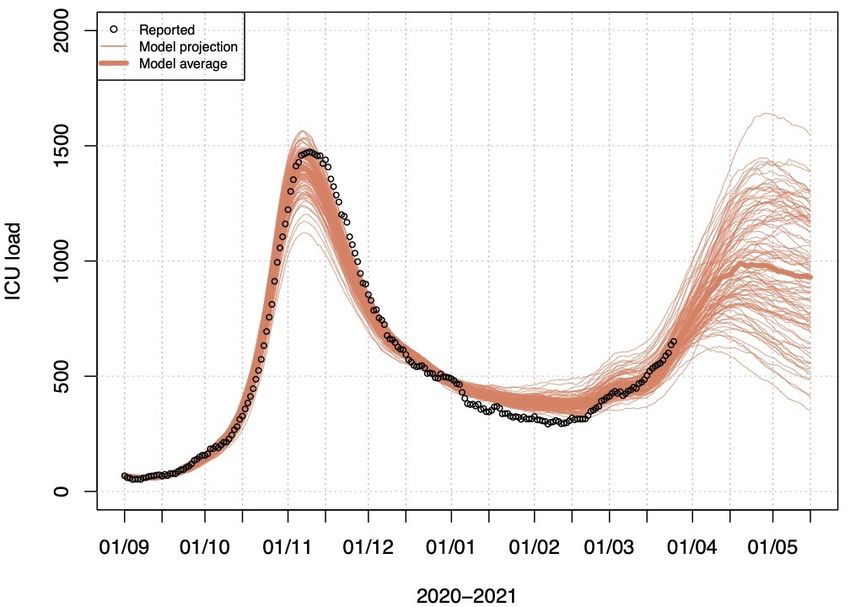
Figure 6: Model projections on ICU load if social contact behavior from early March 2021 is kept
constant and the vaccination campaign continues (Scenario A).
7/11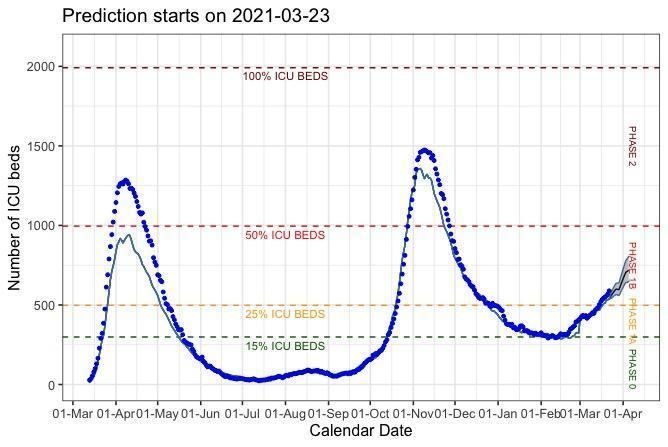
Scenario B: With instant change in behavior on March 29th for 3 weeks

 Figure 7: Model projections on daily hospital admissions if social contact behavior changed on
      March 29th 2021 for 3 weeks and the vaccination campaign continues (Scenario B).

 Figure 8: Model projections on hospital load if social contact behavior changed on March 29th
            2021 for 3 weeks and the vaccination campaign continues (Scenario B).

                                                                                        8/11
Figure 9: Model projections on ICU load if social contact behavior changed on March 29th and
                      the vaccination campaign continues (Scenario B).

Scenario C: With instant change in behavior on March 29th for 3 weeks, but with 30% more
transmission compared to scenario B.

 Figure 10: Model projections on daily hospital admissions if social contact behavior changed
           less on March 29th and the vaccination campaign continues (Scenario C).

                                                                                       9/11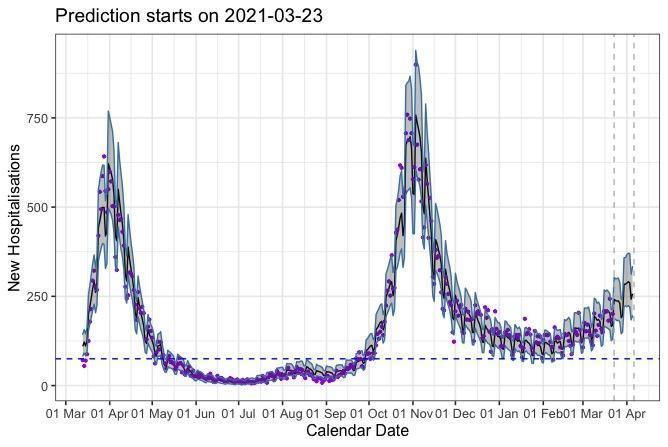
Figure 11: Model projections on hospital load if social contact behavior changed less on March
                 29th and the vaccination campaign continues (Scenario C).

Figure 12: Model projections on ICU load if social contact behavior changed less on March 29th
                    and the vaccination campaign continues (Scenario C).

                                                                                       10/11
Contributors (in alphabetical order)
- Christel Faes (Universiteit Hasselt)
- Lander Willem (Universiteit Antwerpen)
- Niel Hens (Universiteit Hasselt en Universiteit Antwerpen)
- Philippe Beutels (Universiteit Antwerpen)
- Steven Abrams (Universiteit Antwerpen en Universiteit Hasselt)
Selected references:
- Abrams S, et al. (2021) Modeling the early phase of the Belgian COVID-19 epidemic
using a stochastic compartmental model and studying its implied future trajectories.
Epidemics. 100449. https://doi.org/10.1016/j.epidem.2021.100449
- Coletti P, et al. (2020) CoMix: comparing mixing patterns in the Belgian population
during and after lockdown. Scientific reports, 10. https://doi.org/10.1038/s41598-020-
78540-7
- Creech CB, et al. SARS-CoV-2 Vaccines. JAMA. Published online February 26, 2021.
https://doi.org/10.1001/jama.2021.3199
- Davies NG, et al. (2021) Estimated transmissibility and impact of SARS-CoV-2 lineage
B.1.1.7 in England. Science; https://doi.org/10.1126/science.abg3055
- Faes C, et al. (2020) Time between symptom onset, hospitalisation and recovery or
death: Statistical analysis of Belgian COVID-19 patients. International Journal of
Environmental Research and Public Health, 17 (20): 7560.
https://doi.org/10.3390/ijerph17207560.
- Gasparrini A, et al. (2017) A penalized framework for distributed lag non-linear models.
Biometrics, 73 (3): 938-948; 10.1111/biom.12645.
- Patone M, et al. (2021) Analysis of severe outcomes associated with the SARS-CoV-2
Variant of Concern 202012/01 in England using ICNARC Case Mix Programme and
QResearch databases medRxiv 2021.03.11.21253364;
https://doi.org/10.1101/2021.03.11.21253364
- Van Goethem N, et al. Rapid establishment of a national surveillance of COVID-19
hospitalizations in Belgium. Arch. Public Health, 78, 121 (2020)
https://doi.org/10.1186/s13690-020-00505-z
- Wenseleers T (2021) Analysis of VOC for Belgium
https://github.com/tomwenseleers/newcovid_belgium
11/11You can also read