Scenario for a Magnitude 7.0 Earthquake on the Wasatch Fault-Salt Lake City Segment - Hazards and Loss Estimates
←
→
Page content transcription
If your browser does not render page correctly, please read the page content below
Scenario for a Magnitude 7.0
Earthquake on the Wasatch
Fault–Salt Lake City Segment
                              Hazards and Loss Estimates

Developed by the
Earthquake Engineering Research Institute,
Utah Chapter

Prepared for the
Utah Seismic Safety Commission                     June 4, 2015

                                                                  1
“Plans are worthless, but planning is everything.
    There is a very great distinction because when you
    are planning for an emergency you must start with
    this one thing: the very definition of ‘emergency’
    is that it is unexpected, therefore it is not going to
    happen the way you are planning.”
    President Dwight D. Eisenhower, 1957

    as quoted in “Resilience by Design”
    Recommendations of the Mayoral Seismic Safety Task Force
    City of Los Angeles, California - Mayor Eric Garcetti (2014)

2
Earthquake Engineering Research Institute,
Utah Chapter, 2015
Salt Lake City, Utah
This Wasatch Front earthquake scenario was requested
and funded by the Federal Emergency Management
Agency (FEMA).
Contents
For additional copies, contact:
Utah Division of Emergency Management
PO Box 141710 Executive Summary 2
1110 State Office Building
Salt Lake City, UT 84114-1710
(801) 538-3400
Purpose and Objectives 4
Contributors:
EERI Utah Chapter Scenario Committee Members
Kristine Pankow, Committee Chair The Wasatch Fault 9
University of Utah Seismograph Stations
Walter J. Arabasz
University of Utah (Emeritus)
Fault Rupture Scenario 15
Robert Carey
Utah Division of Emergency Management
Earthquake-Generated Ground Failure 17
Gary Christenson
Utah Geological Survey (Retired)
Loss Modeling Using Hazus 24
Josh Groeneveld
Utah Division of Emergency Management
Brent Maxfield Loss Estimations 25
President, EERI Utah Chapter
Peter W. McDonough Summary of Hazus Results 26
Duhallow Consulting P.L.L.C.
Barry Welliver
Structural Engineer Response 31
T. Leslie Youd
Brigham Young University (Emeritus)
Recovery 41
Acknowledgements: The following provided com-
ments and suggestions that improved this report:
Steve Bowman (Utah Geological Survey), Chris DuRoss Conclusion 46
(U.S. Geological Survey), Bill Lund (Utah Geological
Survey)
Writing/editing consultant: Patty Henetz
Recommendations 49
Graphic design and layout: Sheryl Peterson
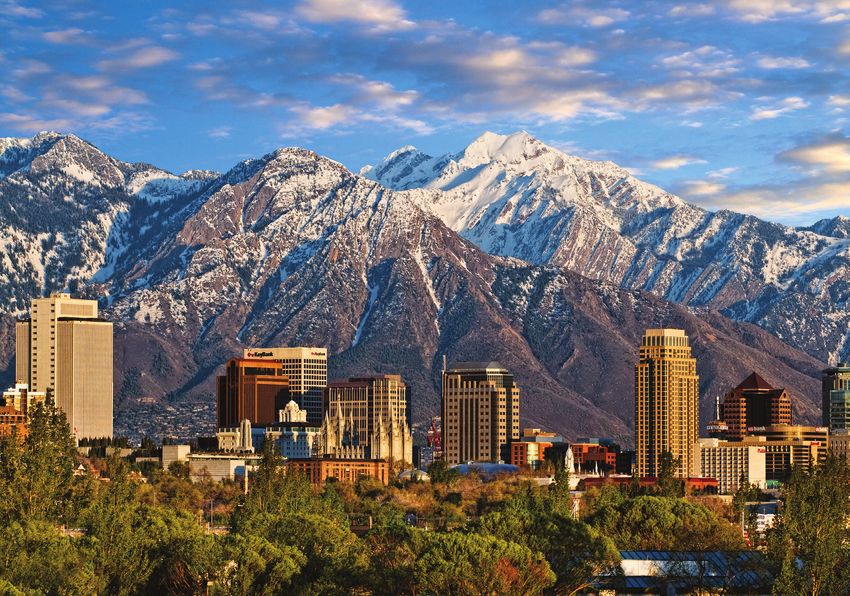
Photos: Front cover by Douglas Pulsipher (courtesy
Notes 51
of the Utah Office of Tourism); Inside front cover and
page 1 (courtesy of the Utah Office of Tourism); Back
cover (courtesy of the University of Utah).
Disclaimer: The views and conclusions contained in
this report are those of the authors and should not be
interpreted as representing the official policies, either
expressed or implied, of the U.S. Government or of any
of the sponsoring agencies and organizations.
3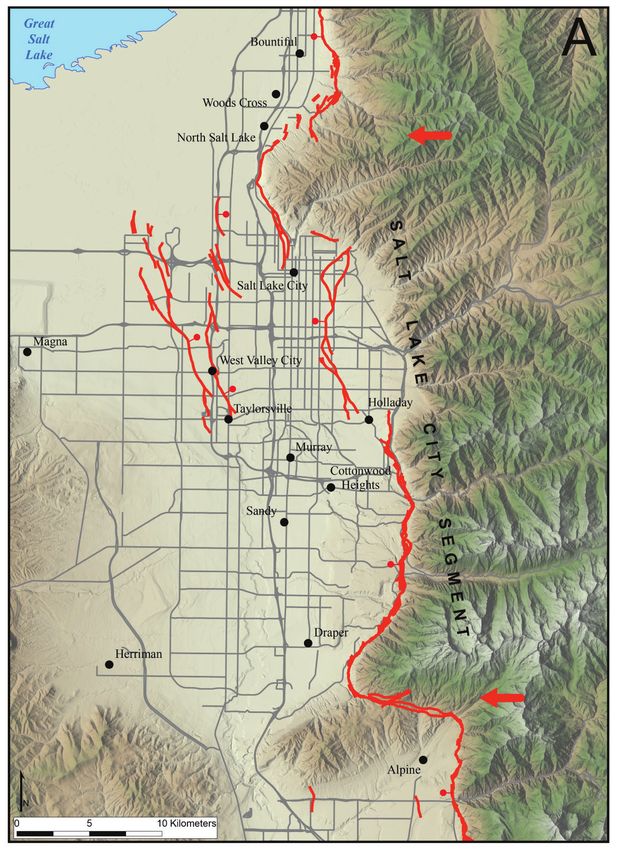
Utah’s People,
      Economy,
      and Infrastructure

   are Increasingly Vulnerable
				     to a Wasatch Fault Earthquake

  4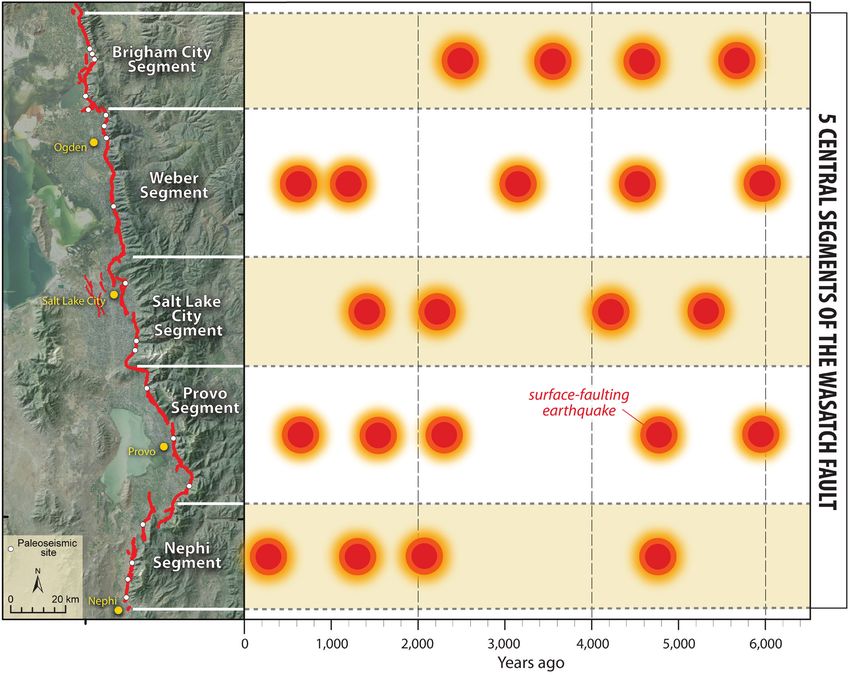
Executive                                                essential services. Prepared to RESPOND requires:
                                                         understanding the scope of disaster-response
Summary                                                  needs; anticipating loss of utilities; exercising re-
                                                         sponse plans; anticipating the need to inspect, in
                                                         a timely way, hundreds of thousands of buildings
Earthquakes pose the greatest natural threat to
                                                         for safe occupancy; and adopting policies that will
Utah’s people, built environment, and economy. For
                                                         facilitate fast and thorough post-earthquake inspec-
planning purposes, a scenario is presented that de-
                                                         tions of buildings that house vital businesses and
scribes the massive physical, economic, and social
                                                         essential services. Prepared to RECOVER requires:
impacts that will result from a future large magnitude
                                                         establishing beforehand laws, rules, and ordinances
7.0 earthquake on the Salt Lake City segment of
                                                         that address issues foreseeable in circumstances of
the Wasatch fault. The concentration of population,
                                                         disaster recovery; planning for resiliency to recover
infrastructure, and economic activity in the Wasatch
                                                         at individual, family, and community levels; devel-
Front urban corridor, literally astride the Wasatch
                                                         oping continuity plans for businesses and schools;
fault, aggravates Utah’s earthquake vulnerability.
                                                         planning to provide essential utilities on a temporary
                                                         basis; and planning for restoring essential utilities on
                                                         a permanent basis.
   Earthquakes pose the greatest
                                                         The scenario earthquake is a real verifiable threat.
   natural threat to Utah’s people,                      At least 22 large surface-faulting earthquakes (“Big
   built environment, and economy                        Ones”) of about magnitude 7 have occurred during
                                                         the past ~6,000 years, about once every 300 years
                                                         on average, along one of the five central segments of
A key aim of this report is to present a realistic       the Wasatch fault between Brigham City and Nephi.
picture of the effects of the Wasatch fault scenario     The average repeat time of Big Ones on the Salt
earthquake―in particular, how long it may take the       Lake City segment is about 1,300–1,500 years. The
state of Utah and its residents to fully recover and     last one occurred around 1,400 years ago―enough
the potential long-term impacts on Utah’s economy.       time for strain energy to build up to unleash another.
This report was developed by the Utah Chapter of
the Earthquake Engineering Research Institute with
assistance from earthquake professionals in the Utah
                                                           The estimated short-term economic
community. Funding was provided by the Federal             loss is over $33 billion
Emergency Management Agency (FEMA). Our pri-
mary audience is the Utah Seismic Safety Commis-
                                                         The expected severity and distribution of strong
sion, whose mission is to identify earthquake-related
                                                         ground shaking during the scenario earthquake is
hazards and risks to the state of Utah and its inhab-
                                                         modeled using the U.S. Geological Survey’s Shake-
itants and to promote actions that will mitigate these
                                                         Map computer program. As a result of rupture of the
hazards and risks to reduce earthquake losses. More
                                                         entire Salt Lake City segment of the Wasatch fault,
broadly, this report is intended to inform policy mak-
                                                         most of the Salt Lake Valley will experience severe
ers, emergency managers, and the general public.
                                                         ground shaking; strong potentially damaging ground
The ultimate goal of this report is to catalyze public   shaking will extend along the Wasatch Front urban
and private actions that will increase pre-disaster      corridor from southern Utah Valley to north of Og-
resiliency through earthquake preparedness―being         den. Besides ground shaking, other physical effects
prepared to WITHSTAND, to RESPOND, and to                associated with the scenario earthquake will include:
RECOVER. Prepared to WITHSTAND requires: the             rupture of the ground surface (up to 8 feet vertically)
strengthening of weak buildings to reduce loss of life   along the trace of the Wasatch fault from Draper to
and injury; addressing the seismic vulnerability of      North Salt Lake; widespread liquefaction of sedi-
schools and government-owned buildings; encour-          ments in lowland areas of the Salt Lake Valley, po-
aging more robust building design; and reducing          tentially damaging structures and facilities; perhaps
potential interruptions to business operations and       hundreds of landslides and rockfalls, especially un-

                                                                                                               2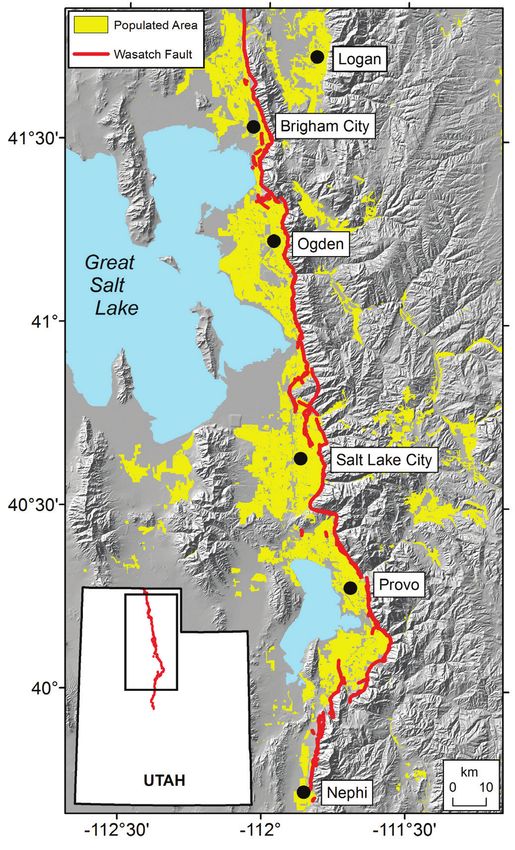
der wet conditions, in areas of steep rock slopes and      to 9,300. Essential lifelines such as water, electricity,
river embankments that experience strong to severe         gas, and sewer will be disrupted for days to months,
ground shaking; and extensive ground subsidence,           and in some locations in the Salt Lake Valley, per-
possibly resulting in flooding by the Great Salt Lake,     haps longer. An example challenge will be the need
depending on lake level.                                   to evaluate for safe occupancy more than 300,000
                                                           structures in 30 days, which will require about 2,400
                                                           building inspectors. Another challenge will be the
                                                           removal of debris generated by the earthquake―re-
    More than 84,000 households
                                                           quiring over 820,000 truckloads at 25 tons per truck.
    are expected to be displaced
    with nearly 53,000 individuals
    seeking shelters                                           Essential lifelines such as water,
                                                               electricity, gas, and sewer will
                                                               be disrupted for days to months,
Hazus is a standardized, nationally applicable
software package developed by FEMA for loss                    and in some locations in the Salt
and risk assessment associated with earthquakes,               Lake Valley, perhaps longer
hurricanes, and floods. A pivotal part of this report
addresses the economic and social impacts of the
scenario earthquake, using Hazus and Geographic            For response planning, an operational picture of the
Information Systems (GIS) technology. Aggregate            scenario earthquake disaster is provided by Hazus
loss estimates are for a region that encompasses           maps variously showing the expected distribution of
Utah’s 12 most northern counties: Box Elder, Cache,        damaged buildings, displaced households, highway
Davis, Juab, Morgan, Rich, Salt Lake, Summit,              infrastructure impacts, impaired hospitals and hos-
Tooele, Utah, Wasatch, and Weber.                          pital bed availability, potential search and rescue
                                                           needs, and the location of care facilities for the elder-
                                                           ly. Similarly, for recovery planning, Hazus maps are
                                                           presented that show the distribution of direct building
    There will be a need to evaluate                       economic losses; likely damaged electrical, natural
    for safe occupancy more than                           gas, and oil facilities; concrete and steel debris and
                                                           associated haulage implications for highways; and
    300,000 structures in 30 days,
                                                           the distribution of non-English speaking populations
    which will require about 2,400                         (for communicating disaster-related information).
    building inspectors
                                                               Nine recommendations to
Loss estimates for the scenario earthquake indicate            improve seismic safety and
disastrous impact. The estimated short-term eco-               resiliency conclude the report
nomic loss is over $33 billion. This includes (1) direct
building-related capital losses (including structural,
non-structural, content, and inventory) of $24.9 bil-      The conclusion of the report is a call to action―to
lion, (2) income losses of $6.9 billion, and (3) life-     make Utah and its communities more resilient to
line-related losses of $1.4 billion. More than 84,000      earthquake disaster. Utah is NOT prepared for a
households are expected to be displaced with nearly        major Wasatch fault earthquake. We end with nine
53,000 individuals seeking shelters. Depending on          recommendations to the Utah Seismic Safety Com-
the time of day, there will be an estimated 2,000 to       mission that are intended to stimulate and guide
2,500 deaths, and the estimated number of people           discussion with public officials and all stakeholders
injured and needing hospital care ranges from 7,400        for effective action and change.

3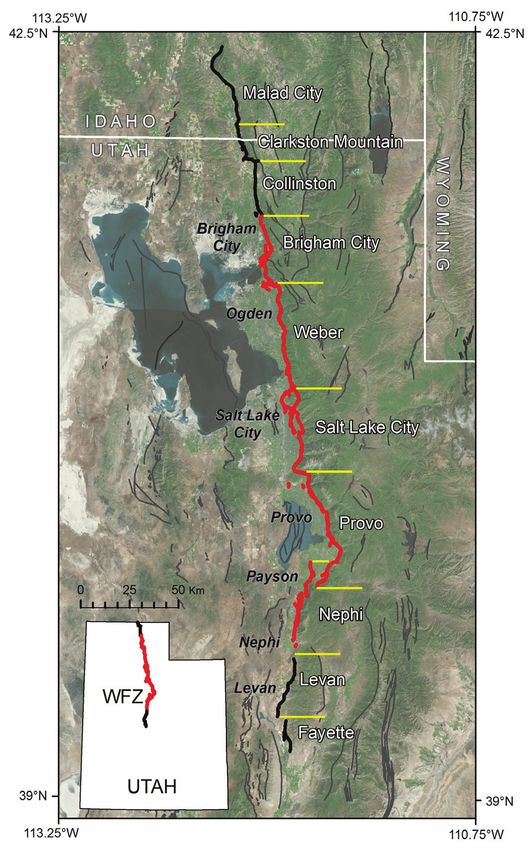
Purpose
and Objectives
Introduction
Earthquakes pose the greatest natural threat to
Utah’s people, built environment, and economy. In the
Wasatch Front region, several hundred earthquakes
per year are recorded, most of them less than mag-
nitude 3 on the Richter scale. The dominant source
of the danger is the Wasatch fault, which periodically
unleashes “Big Ones” (large surface-faulting earth-
quakes of about magnitude 7) about once every 300
years on average along one of the fault’s five central
segments between Brigham City and Nephi—the
most active parts of the fault.

Most of Utah’s population is concentrated in the
Wasatch Front urban corridor, literally astride the
most active segments of the Wasatch fault (Figure
1). This circumstance of “lots of eggs in one basket”1
underscores Utah’s vulnerability to a large Wasatch
fault earthquake.

It is difficult to imagine the massive impact an inevita-
ble Big One in the Wasatch Front urban corridor will
have—threatening life safety, causing major damage
to the built environment, disrupting critical services,
and jeopardizing Utah’s economy. The purpose of
this report is to ensure that stakeholders compre-             Figure 1. Map of Utah’s Wasatch Front urban corridor
                                                               showing populated areas (in yellow) along the Wasatch fault
hend the enormity of such an event.                            (in red). Population data from 2010 (figure courtesy of the
                                                               University of Utah Seismograph Stations).
For planning purposes, we examine the consequenc-
es of a magnitude 7.0 earthquake on the Salt Lake           Scenarios also identify areas and infrastructure that
City segment of the Wasatch fault in the Salt Lake          are most likely to sustain little or no damage and
Valley and adjacent areas. Projections based on             remain functional following an earthquake, thereby
computer modeling provide a basis for anticipating          minimizing the placement of valuable response
the physical, economic, and social impacts that will        assets in areas where they may not be needed. A
result from such a future earthquake.                       scenario is not a prediction of what will happen. It is
                                                            an estimation of a possible outcome.
What is an Earthquake Scenario?
                                                            The cost to prepare planning scenarios, and to up-
Earthquake planning scenarios provide policy                date them regularly, is insignificant compared to the
makers, emergency preparedness personnel, and               future savings from reduced losses to infrastructure,
the public with realistic assessments of the areas          the economy, and human life when the information
of greatest impact. They also identify the types of         is used to develop effective seismic-safety policies
structures and lifelines – the critical infrastructure      and to increase community resiliency. Minimizing
that provides the utilities and essential services that     future earthquake impact through prior planning,
our modern society relies on – that are most at risk        loss-reduction measures, and providing information
of damage. Scenarios estimate building damage,              to help speed the recovery is critical for maintaining
building collapse, and estimate deaths and injuries.        earthquake-resilient communities.

                                                                                                                         4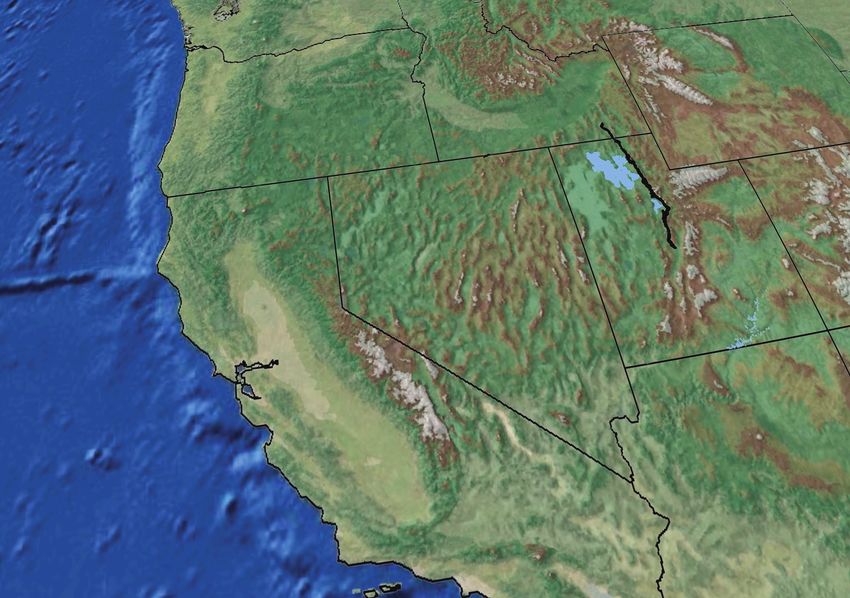
Purpose of this Scenario                                    This report is written for the Utah Seismic Safety
                                                            Commission to assist with their mission of earth-
Will a magnitude 7 earthquake cripple our economy           quake risk reduction, but the information contained
or will we be able to adequately recover from it? The       in this scenario report can also be used by the state
answer depends on what we do now, before it oc-             legislature, local governments, emergency manag-
curs. We need to think of this as a “when it occurs”        ers, business owners, and home owners along the
and not as a “what if it occurs” event. All Utahns need     Wasatch Front to assist with their specific risk reduc-
to understand that an earthquake of this magnitude          tion planning.
is not a 72-hour event, after which everything will go
                                                            Resiliency is a term that is used to help individu-
back to normal.
                                                            als, businesses, and communities understand how
The immediate cost of a magnitude 7 earthquake will         quickly they can return back to a pre-disaster state.
be measured in lives lost, people injured, buildings        The more resilient a community is, the faster it can
damaged or destroyed, infrastructure damaged or             recover from a disaster. Becoming more resilient
destroyed, and use of land lost due to liquefaction,        does not just happen. It takes effort and planning
landslides, and surface fault rupture. However great        before disaster strikes.
this initial cost, there will be an even greater loss to    This report is a call to action. Everything that is done
the economy due to the loss of business function and        now, prior to the earthquake, will help to reduce deaths
income, loss of jobs, and the massive cost to rebuild.      and injuries, reduce the cost of damage, streamline
The social disruption is difficult to overstate. Though     emergency response, improve individual response,
this report focuses on Utah’s 12 most urban coun-           and speed-up the recovery—all of which will better
ties, the disaster’s effects will not be confined to just   protect the vital state economy. A critical part of this
the Wasatch Front. It will have impacts throughout          effort is being able to get businesses up and running
the state, region, and nation.                              as soon as possible allowing people to get back to

       The Wasatch fault dips downward beneath the urbanized Wasatch Front
       Valleys. Consider the following:2

       •    Nearly 80 percent of Utah's population lives within 15 miles of the Wasatch fault in
            the Wasatch Front area (see Figure 1).
       •    More than 75 percent of Utah’s economy is concentrated in Salt Lake, Utah, Davis,
            and Weber counties above the Wasatch fault.
       •    Most of Utah’s state government facilities are located within 15 miles of the Wasatch
            fault.
       •    Major interstate transportation corridors and the Salt Lake City International Airport
            lie above or within 15 miles of the Wasatch fault.
       •    By 2050 the population in the four largest Wasatch Front counties (Salt Lake, Utah,
            Davis, and Weber) is projected to grow to 3.7 million, an 80% increase over 2010.3
       •    To meet the needs of rapid population growth along the Wasatch Front, $14.4 billion
            of new transit and highway infrastructure is planned over the next three decades.

5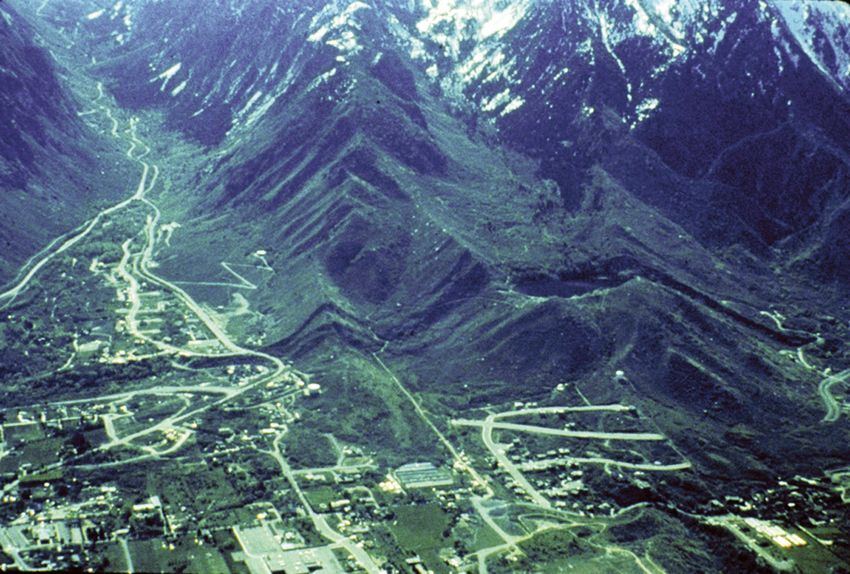
work and jump starting the economy. Another critical      constructed of brick or block that does not contain any
effort will be to get government services and schools     or very minimal amounts of reinforcing steel. Many
back into operation.                                      older homes are constructed of URM. The second
                                                          type of building is referred to as non-ductile concrete.
This scenario report will paint a realistic picture of
                                                          This type of concrete building has reinforcing, but is
what will likely happen following a magnitude 7 earth-
                                                          at risk of collapse because the reinforcing steel can
quake on the Wasatch fault that can be used to im-
                                                          buckle causing the building to rapidly loose strength
prove the resilience of government, businesses, and
                                                          and then collapse. Newer seismic codes do not allow
residents. This will be accomplished in three areas of
                                                          these types of buildings. These buildings should be
preparedness:
                                                          strengthened to significantly reduce the loss of life
Prepared to WITHSTAND                                     forecast in this scenario. Public education regarding
                                                          these building types must be provided to allow citi-
Prepared to RESPOND
                                                          zens to make informed decisions about where they
Prepared to RECOVER                                       live or work. Strengthening weak buildings should be
                                                          a high priority.
Pre-disaster mitigation is the best thing that we can
do to reduce the impacts and increase the speed           •   Strengthen Public Buildings to Protect Schools
of recovery from this disaster. In preparing for this     and Government: The State of Utah must exercise
earthquake, an ounce of prevention is worth a pound       its responsibility to serve and protect the citizens of
of cure, meaning that a small amount of preparation       Utah by developing strengthening or replacement
will greatly benefit the response and recovery efforts.   policies which address the seismic vulnerability of
In conjunction with the purposes listed above, it is      schools and government-owned buildings, and any
our hope that this scenario report will encourage the     other state infrastructure deemed to be vulnerable to
accomplishment of the following objectives:               earthquakes.

Prepared to WITHSTAND                                     •   Reduce Economic Loss and Speed-up Recov-
                                                          ery by Encouraging More Robust Building Design:
These efforts are intended to strengthen buildings        This scenario forecasts a huge economic loss from
and infrastructure so that they will reduce the pos-      damage to code-designed buildings. These buildings
sibility of collapse or failure and to decrease the       are designed to prevent building collapse, but do
amount of damage. These efforts will help reduce the      not prevent expensive damage or displacement of
damage losses estimated in this scenario.                 occupants, and the associated economic loss. If new
                                                          buildings are designed with a focus of minimizing
                                                          damage rather than just preventing building collapse,
  Prepared to WITHSTAND                                   they will sustain less damage, can be more easily
  •   Reduce Loss of Life by Strengthening Weak           repaired, and can be reoccupied more quickly. Those
      Buildings                                           interested in maintaining occupancy following a mag-
                                                          nitude 7 earthquake should consider designing their
  •   Strengthen Public Buildings to Protect
                                                          buildings (homes, businesses, or public facilities) to a
      Students and Government
                                                          higher standard. The state should develop education
  •   Reduce Economic Loss and Speed-up Recovery          materials to inform owners, especially business own-
      by Encouraging More Robust Building Design
                                                          ers, of the benefits of more robust building design.
  •   Reduce Economic Impact by Getting
      Businesses Back to Business                         •  Reduce Economic Impact by Getting Businesses
                                                          Back to Business: Business operations will jump start
                                                          the economy after a major earthquake. The forecast
• Reduce Loss of Life by Strengthening Weak               economic loss to the economy due to business inter-
Buildings: One of the most significant sources of         ruption is massive. If businesses are not operating,
deaths, injuries, and damage resulting from a mag-        essential services will be missing, people will be out
nitude 7 earthquake is from the likely collapse of two    of work, and tax revenue will be significantly lower
types of buildings. The first is unreinforced masonry     at a time when all of these things are needed. To
buildings. These are referred to as URMs. They are        stay in business, business owners must strengthen

                                                                                                                6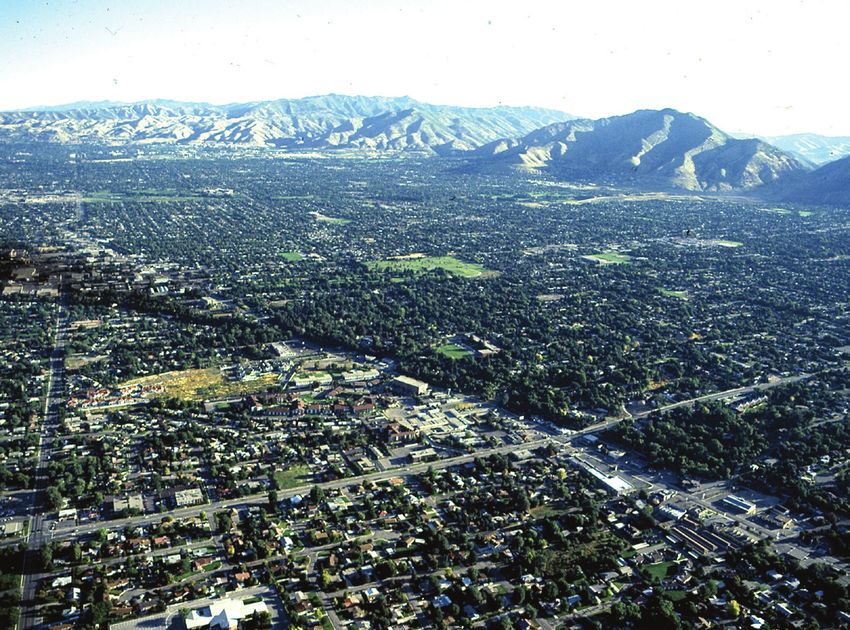
buildings, strengthen nonstructural items that could        you meet and present scenarios and then discuss
fall or fail, and protect their product or services so      how you would respond, or they can be action based
that their business is not shut down by earthquake          where you actually involve people and equipment
damage.                                                     from simple to full-scale operations.
Prepared to RESPOND                                         •   Prepare for Building Inspection: There will be a
                                                            need to inspect about 300,000 buildings following
One type of needed response following a magnitude
                                                            a magnitude 7 earthquake. This will overwhelm the
7 earthquake will be from first responders. These
                                                            inspection resources of every jurisdiction. Cities,
people will respond to fires, search for survivors in
                                                            counties, and the state must plan for how to how to
downed buildings, keep the peace, and restore vital
                                                            allocate scarce inspection resources and know how
utilities. Another type of response is individual. For
                                                            to request additional resources.
example: We just had a magnitude 7 earthquake.
You are at work, your spouse is at home, and your           •   Adopt Policies to Get Businesses, Schools, and
children are at school. How would you respond? Sim-         Essential Services Back Into Their Buildings: One path
ilar scenario questions could be asked of you as a          to facilitate getting businesses, government, and
member of a family, a leader, a school administrator,       schools back into operation, is the Building Occu-
a business owner, or as a government official. Being        pancy Resumption Program (BORP). This program
able to answer the question is what Prepared to RE-         allows building owners to pre-certify private building
SPOND means.                                                inspectors for post-earthquake evaluation of their
•  Understand the Scope of Needed Response:                 buildings. Salt Lake City and Murray City have adopt-
Using this scenario report to understand the scope          ed BORP (as of April 2015). It or similar policy should
of disaster-response needs will assist in meaningful        be adopted by all cities along the Wasatch Front.
planning to speed up needed response.                       Prepared to RECOVER
                                                            Community resilience is the ability for a community to
                                                            respond to and recover from a devastating event. The
    Prepared to RESPOND
                                                            ability to effectively recover will be largely dependent
    •   Understand the Scope of Needed Response             on how well we plan for recovery. It will be a long and
                                                            difficult process, but it becomes significantly easier
    •   Prepare to be Without Utilities
                                                            if planned for now. Recovery follows quickly on the
    •   Exercise for Response                               heels of response, but it will last for years. One of
    •   Prepare for Building Inspection                     the best ways to speed-up recovery is by getting the
                                                            state’s economic engine going again by getting busi-
    •   Adopt Policies to Get Businesses, Schools and
        Essential Services Back Into Their Buildings        nesses back into operation. Another is to have laws,
                                                            rules, and ordinances in place prior to the event.

                                                            •  Establish Laws, Rules, and Ordinances that Ad-
•  Prepare to be Without Utilities: What would you or       dress Issues Related to Recovery: The aftermath
your business do without electricity, gas, or water for     of an earthquake will be a very chaotic time. If the
an extended period of time? Residents, businesses,          state and city government have considered essential
schools, churches, and communities should plan              issues and have passed the necessary laws, rules,
how they will respond to this important question.           and ordinances prior to the event, the entire recovery
                                                            process will go better than if these are attempted to
•   Exercise for Response: This scenario report
                                                            be passed after the fact. Consider the various issues
paints a dire picture of the immediate aftermath of
                                                            addressed in this scenario report and in other areas
a major earthquake. The first week or two following
                                                            that have faced rebuilding from earthquakes, like
this event is critical. Individuals, families, neighbors,
                                                            Christchurch, New Zealand.
churches, schools, communities, cities, counties, and
the state must discuss their needs and plan how they        • Plan for Recovery at the Lowest Levels: Individuals
will respond. This report can be used to assist in their    and families should look at their circumstances and
planning. Exercises can be discussion-based where           understand the realities of the aftermath. They should

7
then plan accordingly trying as much as possible to more robust buildings, and preparing a BORP plan
recover using their own resources. Communities to get back into their buildings faster, businesses and
should do likewise and decide what they need to do schools must create continuity plans which include
now to make the recovery process better for those in contingency plans. Owners who are prepared will be
their communities. able to resume operations much more quickly than
those who are not.
Prepared to RECOVER • Plan for Providing Temporary Essential Utilities:
Once the dust settles and response operations are
• Establish Laws, Rules, and Ordinances that
winding down, there will be an immediate need for
Address Issues Related to Recovery
water, power, gas, and sewage disposal. Individuals
• Plan for Recovery at the Lowest Levels and communities who plan for and provide for these
• Develop Business Continuity Plans essential needs will be much better off than those
who do not plan.
• Plan for Providing Temporary Essential Utilities
• Plan for Restoring Essential Utilities • Plan for Restoring Essential Utilities: Local and
county government should work with private utility
companies to discuss coordination and cooperation
• Develop Business and School Continuity Plans: In needed to restore services to Utahns in a methodical
addition to strengthening weak buildings, designing manner.
Quick Facts
• Utah's Economic Activity: In 2013, Utah's Real Gross Domestic Product (Real GDP,
the value of the production of goods and services, adjusted for price changes) was
$131 billion. The Ogden-Salt Lake City-Provo urban corridor accounted for 85% of
this Real GDP. The Salt Lake City metro area accounted for 54%.4
• Relative Earthquake Risk: In a 2008 FEMA study, Utah ranked 6th in the Nation in
relative earthquake risk in terms of probabilistic Annual[ized] Earthquake Loss (AEL).
The AEL for Utah (in 2008 dollars) was $89.5 million. The AEL for the Salt Lake City
metro area was $52.3 million, ranking it 11th among 43 metro areas in the U.S. with
an AEL greater than $10 million.5
8The
Wasatch Fault
More than 130 years ago, the renowned geologist
G. K. Gilbert wrote a classic letter to the Salt Lake The most active parts of the
Daily Tribune 6 warning local residents that fault scarps Wasatch fault are its five central
along the western base of the Wasatch Range (along segments between Brigham
what we now call the Wasatch fault) were evidence City and Nephi. The Scenario in
that large surface-faulting earthquakes had occurred this report is for a Big One on
before Mormon settlement in 1847 and more would
the Salt Lake City segment
occur in the future.
The Wasatch fault is Utah’s longest and most geo-
logically active fault, extending 220 miles (350 km)
straight-line distance from Fayette in central Utah to
near Malad City, Idaho (Figure 2).7 The fault plane is
inclined (“dips”) to the west and the rock mass above
the fault slips downward in a “normal” direction (see
Figure 3). Over millions of years, incremental move-
ment on the Wasatch fault in large surface-faulting
earthquakes has produced valleys on the western
(down-dropped) side of the fault and a prominent
west-facing topographic escarpment on the east-
ern (uplifted) side, which early explorers called “the
Wasatch Front.”
The Wasatch fault is the most studied active normal
fault in the world. Based on decades of detailed
field studies and trenching excavations across the
fault since the late 1970s, geologists have compiled
abundant data on the timing and size of prehistoric
(“paleo”) earthquakes large enough to rupture the
ground surface during the past 18,000 years or so.
The depth of surficial deposits exposed in most of the
trenching excavations limits the completeness of the
paleo-earthquake record along the Wasatch fault to
about the past 6,000 years.
Paleo-earthquake studies of the Wasatch fault have
WF
yielded key information about the fault’s behavior.
Rather than generating a broad range of earthquake
sizes, the Wasatch fault episodically releases accu-
mulated strain energy in similar-size or “characteris-
tic” surface-faulting earthquakes of about magnitude
7 (for shorthand, “Big Ones”).
Figure 2. The Wasatch fault, divided into its ten recognized seg-
The Wasatch fault consists of ten distinct segments ments (separated by yellow lines and labeled to the right). The
five central segments of the fault, shown in red, are the most ac-
(Figure 2), each of which is thought to rupture inde- tive. The less active end segments of the fault are shown in black
pendently as a separate source of Big Ones. (figure courtesy of the Utah Geological Survey).
9WA MT
1959 WY
te
M7.5 ND
la
Intermountain
P
1983
ca
Fu M7.3 Ro Seismic Belt
ck
y
de
Snake River Plain
an
Ju
ID
Mo
OR un
Wa
1934
tai
sat
M6.6 Ogden
ns
ch
No
NV Salt Lake City
R
CA
ang
WASATCH
r th
Provo
Basin
e
1915
FAULT
M7.6
Am 1954
UTAH
Moab
M7.2
and
eri
can
1932 o
Colorad
CO
M7.2
NM
e AZ
Rang
St. George
u
Platea
Pla
S ie
rra
te
SAN
Ne
nce
AN
vad Provi
a
Relative movement of DRE
plate boundary fault AS
FAU
General direction of Basin LT
and Range extension
Area of Intermountain
Seismic Belt (ISB)
Location, year, and magnitude
1934 of large Basin and Range/ISB
M6.6 surface-faulting earthquakes
Utah and the Intermountain West
are Seismically Active
Figure 3. Schematic map (above) and cross-section (below) of the western United States showing the tectonic setting of the Wasatch
fault.8 Stretching, or horizontal extension, of the crust produces a type of dipping (or inclined) fault called a “normal” fault in which the
block above the fault moves downward.9 The Wasatch fault is the dominant active normal fault along the eastern margin of the Basin and
Range Province. Note: Some of the magnitudes indicated on the map above are surface-wave magnitudes which are typically higher
than moment magnitudes (Mw) cited elsewhere in this report.
10Large Prehistoric (pre-1847) about Holladay; (2) the East Bench fault, trending
Earthquakes on the Wasatch Fault away from the range front northwest of Holladay; and
(3) the Warm Springs fault, at the northern end of Salt
At least 22 large surface-faulting earthquakes have Lake City. The West Valley fault zone is secondary
occurred on the central segments of the Wasatch to and dips eastward towards the master Wasatch
fault during the past ~6,000 years (Figure 4). On fault. Based on available data, the West Valley fault
average, one of these Big Ones has occurred about zone ruptures at the same time as, or shortly after,
once every 300 years somewhere on one of the Big Ones on the SLC segment. Separate rupture of
central segments of the fault. The pattern of large the West Valley fault zone would generate an earth-
earthquakes shown on Figure 4 is not simple or quake of about magnitude 6.
regular. The inter-event times on the individual seg-
Other key facts about the SLC segment:
ments range from 700 to 2,700 years. The average
inter-event time for individual segments ranges from • The various strands of the SLC segment dip to
900 to 1,500 years. The Brigham City and Salt Lake the west about 30°–70° (measured from the horizon-
City segments have the longest elapsed times since tal), which means that the Wasatch fault at depth lies
their most recent earthquakes (Figure 4), which leads directly beneath the urbanized Salt Lake Valley.
to higher earthquake hazard on these two segments • At least nine large surface-faulting earthquakes
compared to the rest of the fault.10 The most recent have ruptured all or part of the SLC segment since
Big One on the Wasatch fault occurred on the Nephi about 18,000 years ago, at least eight since 14,000
segment about two to three hundred years ago (ap- years ago, and at least four since about 6,000 years
proximately 1740 AD). ago.
The Salt Lake City Segment11 • For the past 6,000 years, the average repeat time
of Big Ones on the SLC segment is about 1,300
The Salt Lake City (SLC) segment of the Wasatch
years; for the past 14,000 years, it is about 1,500
fault is 25 miles (40 km) long, extending along the
years. The most recent large earthquake on the SLC
eastern side of the Salt Lake Valley from southeast
segment occurred about 1,400 years ago.12
of Draper to North Salt Lake, as shown on Figure
5(a). Active fault traces shown on the figure indicate • Vertical offsets of the ground surface during
a complex fault system in the Salt Lake Valley, in- past Big Ones on the SLC segment, as measured
cluding subsections of the SLC segment along the in various trench excavations, have reached a little
eastern side of the valley and faults of the West Val- more than 8 feet (2.5 meters) and generally are in the
ley fault zone, which extends 10 miles (16 km) north range of 3–7 feet (1–2 meters).
of Taylorsville in the north-central part of Salt Lake • The characteristic magnitude estimated for Big
Valley. The SLC segment has three subsections, all Ones on the SLC segment is moment magnitude 7.1
inclined or dipping to the west: (1) the range-bound- ± 0.2.13 The magnitude 7.0 earthquake used in this
ing Cottonwood fault, running from east of Draper to scenario is not the worst-case size.
The average repeat time of Big Ones on the SLC segment is about
1,300-1,500 years. The last one occurred around 1,400 years ago—
enough time for strain energy to build up to unleash another (the
time interval between some past Big Ones on the SLC segment
has been in the range of 800 to 1,200 years).
11Large Prehistoric Earthquakes on the Wasatch Fault
Figure 4. Schematic plot showing the timing of large prehistoric earthquakes on the Wasatch fault (elements of the figure provided by the
Utah Geological Survey).
At least 22 large earthquakes have ruptured the central
segments of the Wasatch fault since about 6,000 years ago.
121
2
3
Figure 5(a). Map of the Salt Lake City segment of the Wasatch fault and the West Valley fault zone (courtesy
of the Utah Geological Survey). Bold red arrows mark the segment boundaries and red lines show the surface
traces of active faults forming a complex fault system in the Salt Lake Valley. Locations of features illustrated in
Figure 5(b) are shown by the numbered circles.
131
2
►
►
►
►
3
►
►
►
►
Figure 5(b). Illustrated features, keyed to Figure 5(a), of the Salt Lake City (SLC) segment of the Wasatch fault: (1) Example trench
excavation and fault exposure (inset) at Penrose Drive (courtesy of Chris DuRoss, U.S. Geological Survey). (2) Aerial photo view to
the northeast along Highland Drive near 3900 South showing a subsection of the SLC segment in a densely populated area away
from the mountain front (photo credit: Rod Millar). (3) Aerial photo view to the east at the mouth of Little Cottonwood Canyon (courtesy
of the Utah Geological Survey). White arrows in (2) and (3) mark the surface trace of the fault.
14Fault Rupture predicted, this scenario provides a reasonable ap-
proximation of the overall scale of expected ground
Scenario motions from a magnitude 7.0 earthquake on the Salt
Lake City segment. The entire Salt Lake Valley and
surrounding areas will experience strong to severe
The U.S. Geological Survey’s ShakeMap computer
shaking as the result of a Salt Lake City segment rup-
program is used to predict ground motions from a
ture. The geographical distribution of these ground
magnitude (Mw) 7.0 earthquake along the Salt
motions may vary from this scenario as a result of
Lake City segment of the Wasatch fault (Figure 6).
un-modeled fault rupture dynamics and unaccounted
The magnitude is consistent with rupture of the en-
for site amplification effects due to both the local soil
tire segment length from Draper to southern Davis structure and basin reflected seismic waves,15 but
County. In predicting the ground motions, we use these details will not change the degree of shaking
a fault dipping 60 degrees from the current surface expected from this earthquake.
trace to a depth of about 9 miles (15 km). The ground
motions are calculated using a recently determined This scenario only models ground motions for the
ground motion prediction equation for normal faulting main shock. In the 30 days following a magnitude
earthquakes,14 which combines magnitude, distance 7.0 earthquake, based on a reasonable aftershock
from the fault plane, and local soils to determine es- model, we can expect up to three aftershocks greater
timates of ground shaking. This ShakeMap scenario than magnitude 6, 13 greater than magnitude 5, and
was originally developed for the 2012 Utah Shake- 77 greater than magnitude 4. These earthquakes
Out and has been used extensively by the State of may not be as strong as the main event, but the
Utah and FEMA for earthquake exercises and as the larger aftershocks are capable of significant damage
on their own, and all aftershocks may further weaken
foundation for other planning reports such as the
damaged structures. The aftershocks will also slow
Wasatch Range Catastrophic Earthquake Response
rescue and recovery efforts and likely heighten
Plan (FEMA).
public panic. While this is a known consequence, the
While the exact ground motions at any specific structural, economic, and life-safety effects have not
location for any particular earthquake cannot be been calculated in this scenario.
Magnitude or Intensity? The intensity of shaking that a building or
structure will experience during an earth-
Magnitude is a measure of the energy re- quake is highly variable, but generally de-
leased in an earthquake—a single value pends on three main factors:
that depends on the area of fault rupture
and amount of slip. For example, the 1934 • The magnitude of the earthquake—in
Hansel Valley, Utah earthquake had a mag- general, the larger the earthquake, the
nitude of 6.6. The largest expected earth- stronger the shaking and the larger the area
quakes in Utah are magnitude 7.0-7.5. affected.
Intensity is a measure of the strength of • The distance from the earthquake—the
ground shaking at a particular place, and closer to the source of the earthquake, the
varies by location, proximity to the source greater the shaking.
of the earthquake, and type of material un-
• The type of ground material beneath the
derlying the site. The intensity scale ranges
structure—soils may amplify or deamplify
from low (I) to high (XII). Near the epicenter
the shaking relative to bedrock.
of the Hansel Valley earthquake, the inten-
sity reached VIII; however, in Salt Lake City,
intensity levels were about VI.
15Figure 6. SkakeMap Scenario for a magnitude 7.0 earthquake on the SLC segment. Severe shaking corresponds to peak ground
velocities greater than 80 cm/sec. Most of the Salt Lake Valley will experience peak ground velocities greater than 40 cm/sec. The
maximum intensity from this earthquake is IX, which corresponds to violent shaking and the potential for heavy damage.
All loss estimates presented later in this
report are based on shaking from the
scenario earthquake only.
16Earthquake-Generated
Ground Failure
Most earthquake damage comes from ground shak-
ing, but other effects can be just as devastating.
Ground failure poses a significant hazard following
earthquakes along the Wasatch Front. In the 1992
M 5.8 St. George, Utah earthquake, a massive
landslide in Springdale caused the most damage to
houses.
Four types of ground failure will occur during the Figure 7. View of part of fault rupture generated by the October
28, 1983 Borah Peak, Idaho earthquake. Photo by T.L. Youd.
scenario earthquake:
1. Surface fault rupture
2. Liquefaction
3. Landslides
4. Ground subsidence
Surface Fault Rupture
Fault rupture of the Salt Lake City segment of the
Wasatch fault will cause the ground to rupture as
much as eight feet vertically and up to three feet of
horizontal extension. This much movement is likely
to tear apart buildings, pavement, pipelines and any-
thing built across the fault.
Figure 8. View of Borah Peak Idaho surface faulting where it
crosses Doublespring Pass Road. Photo by T.L. Youd.
The rupture will be similar to that observed following
the 1983 Mw 6.9 Borah Peak, Idaho earthquake.16
That faulting occurred primarily on the Lost River
fault between Mackay and Challis. Figure 7 shows a
section of the 1983 surface rupture where it traversed
a hillside with a disconnected upward step; a faint
trace of an antithetic fault rupture is visible to the left
of the main fault. Figure 8 is a view of the fault rup-
ture where it crossed Doublespring Pass Road. The
Borah Peak fault rupture at Doublespring Pass Road
disrupted a zone of ground that was 115 feet (35 m)
wide with observed net down dip displacement of
about nine feet. Based on this similarity, surface fault
Figure 9. Diagram of typical ground displacements associated
ruptures for the scenario earthquake would occur with normal faulting such as occurred during the 1983 Borah
within zones about 100 feet or wider that would ir- Peak, Idaho earthquake and is expected during the Salt Lake
scenario earthquake. Diagram by T.L. Youd.
regularly follow mapped traces of the Wasatch fault.
Earthquake damage would be intense within these
zones. A diagram of ground displacements such as
occurred in Idaho and is likely along the Wasatch
fault, is reproduced in Figure 9.
17Liquefaction
Liquefaction occurs as seismic waves propagate
through loose granular sediment—silts, sands and
gravels—that lie below the water table. Earthquakes
tend to compact loose materials. If water within the
sediment cannot easily escape, pressure builds up in
the water causing the sediment to soften and weak-
en. When the pressure reaches a critical level, the
sediment temporarily looses strength and behaves
as a viscous liquid, hence the term “liquefaction,” the
transformation of a solid into a liquid.17 The soil may
freely deform, leading to ground displacements that
can tear apart structures and pipelines similar to fault
displacement. With time, usually minutes to days,
the excess groundwater pressure dissipates and the
material re-solidifies.
Liquefiable sediments are not randomly distributed
in natural landscapes, but occur only in locations
where loose granular sediment has been deposited
in recent geologic time. Geologic and hydrologic
factors used by geologists and engineers to identi-
fy locations where liquefiable deposits are likely to
lie underground include: (1) Age of deposition—the
younger the sediment, the more liquefiable; (2)
Depth of water table—the shallower the water table,
the more liquefiable the sediment; (3) Density of sed-
iment—the looser the sediment, the more liquefiable;
(4) Soil type—the more clayey the soil, the more re-
sistant to liquefaction.18
Figure 10. Liquefaction-potential map for a part of Salt Lake
Based on the above four factors, liquefaction poten- County, Utah.19
tial maps have been compiled for several counties
in Utah. A map for Salt Lake County is reproduced
in Figure 10. This map shows that areas with high
liquefaction potential are confined to lowlands along
the Jordan River and its tributaries and to low-lying
areas between 4500 South and the Great Salt Lake.
Most liquefaction effects generated by the scenario
earthquake will occur in these lowland areas.
Areas of moderate to low liquefaction potential occur
on the map as bands up to five miles wide border-
ing the high-potential zone. Not all the areas char-
acterized by high liquefaction potential will develop
liquefaction effects. Many areas of high liquefaction
potential are likely underlain by non-liquefiable clay-
rich soils; drilling and testing is necessary to identify
areas that are actually underlain by significant layers
of liquefiable sediment. Four ground-failure types
commonly develop as a consequence of liquefaction: Figure 11. Before and after diagrams of liquefac-
lateral spread; ground oscillation; loss of bearing ca- tion-induced lateral spread.21
pacity; and sand boils and ground settlement.20
18Lateral Spread
Lateral spread is the most damaging effect of lique-
faction (Figure 11). For example, liquefaction during
the 1964 Alaska earthquake affected more than 250
highway and railway bridges at river crossings, dam-
aging most beyond repair, with many collapsing (Fig-
ure 12). The bridge damage disrupted transportation
facilities for months while repairs were made. This
disruption wreaked havoc on emergency response
and short-term business activity. Lateral spreading
also pulled apart many buildings in Anchorage and
Valdez, Alaska, in Niigata, Japan, and in many other
earthquakes, causing severe to irreparable damage
to many structures (Figure 13). This in turn led to
drastic economic losses and disruptions to local
economies. Damage to pipelines from lateral spread-
ing has severely disrupted water, gas, and sewage
systems during many earthquakes (Figure 14).
Ground Oscillation
Ground oscillation occurs on flat ground where there Figure 12. View of railroad bridge compressed
is too little gravitational pull to cause lateral spread, by liquefaction-induced lateral spread during the
March 23, 1964 Alaska earthquake. Photo courtesy
but where earthquake-generated inertial forces can of the U.S. Geological Survey.
cause upper layers of the ground to oscillate back
and forth in waves over a subsurface weakened lay-
er (Figure 15). Most ground oscillation damage has
been to pavement and pipelines.
Loss of Bearing Capacity
Liquefaction beneath heavy buildings and other
heavy structures often allows them to sink into what
used to be solid ground, and tip or settle at an angle
when the ground re-solidifies (Figure 16). Such foun-
dation failures (Figure 17) usually damage a build-
ing’s functionality, leading to expensive repairs or the
demolition of the building entirely. Liquefaction may
also cause buried structures, such as tanks, pipes,
and manholes, to float upward (Figure 18).
Sand Boils and Ground Settlement
Liquefaction often leads to ejection of ground water
laden with sediment creating miniature sand volca-
noes or sand boils (Figure 19). Sand boils by them-
selves are usually not destructive, but the ejected
water and sediment may cause local flooding and
bothersome deposition of sediment on the ground
Figure 13. View of interior of building pulled apart
surface adding to other debris. Such effects are prime by liquefaction-induced lateral spread at San Fer-
indicators that liquefaction has occurred at depth. nando Juvenile Hall during the 1971 San Fernando,
The eruption of sand boils is usually accompanied by California earthquake. Photo by T.L. Youd.
19Figure 14. View of water pipeline rupture due to liquefaction-in-
duced lateral spread near the San Fernando Juvenile Hall during Figure 17. Building in Adapazari, Turkey that tipped over
the 1971 San Fernando, California earthquake. Photo by T.L. due loss of bearing capacity during the 1999 Kocaeli, Turkey
Youd. earthquake. Photo by T.L. Youd.
Figure 18. Buried oil storage tank at an industrial facility that
floated to ground surface due to liquefaction of subsurface soils
during the 1993 Hokkaido-nansei-oki, Japan earthquake.24
Figure 15. Before and after diagrams of liquefac-
tion-induced ground oscillation.22
Figure 19. View of sand boil generated by lique-
faction during the 2010 Mw 4.6 Randolph, Utah
Figure 16. Before and after diagrams of liq- earthquake. Photo courtesy of Chris DuRoss,
uefaction-induced bearing capacity failure.23 Utah Geological Survey.
20ground settlement to compensate for compaction of Landslide hazards are not randomly distributed
the liquefiable layer and the volume of sediment and throughout the region, but vary as a function of
water ejected. Ground settlements have been dam- slope steepness, rock material, and groundwater
aging to building foundations that may fracture or tilt conditions. Landslides are much more likely during
unevenly and to pipelines that may rupture due to the wet periods such as spring snowmelt or following
increased strain on the pipe. Uneven settlement may prolonged rainfall. Landslide maps for the Wasatch
cause sewer lines to lose gradient, which impedes Front scenario earthquake for both wet (Figure 20)
flow and may cause local flooding with contaminated and dry conditions (Figure 21) have been compiled.
water. The maps clearly show the difference in hazard be-
tween wet and dry conditions. The maps also show
Landslides that the hazard is greatest in areas with steep topog-
raphy.
Earthquakes are a major cause of landslides, and
a magnitude 7 earthquake may cause hundreds of A simplified diagram of the more common types of
landslides over a large area around the epicenter. landslides is shown in Figure 22. Rock falls and soil
Many types of landslides may occur, varying greatly and rock slides are most common.28 The scenario
in size, amount of displacement, and damage poten- earthquake would likely cause all types of land-
tial. Earthquake-induced landslides will occur in both slides near the epicenter, but the size, number, and
soil and rock. amounts of displacement drop off quickly away from
Figure 20. Landslide probability under wet conditions.25 Figure 21. Landslide probability under dry conditions.26
21the epicenter. Landslide and landslide-hazard maps
exist for parts of Utah and the Wasatch Front. These
maps indicate where unstable slopes exist and where
future landslides are most likely.
Rock Falls
Rock falls consist of individual boulders or shallow Figure 22. Three main landslide types in soil and rock.27
disrupted rock masses that bounce, roll, or free-fall
down slopes.29 They are the most common type of
landslide caused by earthquakes, and may occur in
both the mainshock and aftershocks greater than
magnitude 4.30 Damages are rare in the steep hill-
side source areas of rock falls, where few structures
exist, but typically structures have been built at the
base of these slopes in the rock-fall runout zone.
In a mountainous area such as the Wasatch Front,
hundreds of rock falls can be expected from hillsides
along the upper east benches and throughout the
Wasatch Range. In the 1983 Mw 6.9 Borah Peak,
Idaho earthquake, large dust clouds from rock falls
were reported throughout the Lost River Range. Sim-
ilar dust clouds were seen in the 1988 ML 5.2 San
Rafael Swell earthquake in central Utah (Figure 23). Figure 23. Dust clouds from rock falls in the 1988 ML 5.2 San
Rafael Swell earthquake.
Soil and Rock Slides
Soil and rock slides are typically shallow disrupted
translational movements of fragments or blocks on
a basal slide surface, often a bedding plane or weak
layer that lacks lateral support and is exposed in a
hillside. Shallow, more coherent rotational slides oc-
cur but are less common. Soil and rock slides may
cause moderate to severe damage to structures de-
pending on the amount of displacement. Prehistoric
slides exist throughout the Wasatch Front that have
variable vulnerability to reactivation by earthquake
ground shaking. Earthquake-induced slides may
occur in the mountains, as well as in more populat-
ed areas of the basin, particularly in soil slopes in
steep bluffs bordering rivers (for example, the Jordan
River, Little and Big Cottonwood Creeks, Parleys Figure 24. Damage to a home caused by the Springdale land-
slide in the 1992 M 5.8 St. George earthquake.
Creek, Weber River). Historically, one of the largest
earthquake-induced rock slides in Utah was the
Springdale landslide in the 1992 M 5.8 St. George
earthquake. It was a large, coherent, deep-seated
slide with both translational and rotational compo-
nents that moved about 33 feet (10 m).31 The only
three homes that had been built on the surface of the
landslide were destroyed (Figure 24), and damages
would have been far greater if the subdivision had
been completed.
22Rock Avalanches subsidence in the area west of the Salt Lake City
segment of the Wasatch fault. Incursion of surface
Rock avalanches are rapid, large disrupted slides
water along the east shore of Great Salt Lake and
that typically involve flow mechanisms in the runout up the Jordan River could cause local flooding and a
zone and generally occur only as a result of strong rise in the ground-water table.
ground shaking in large earthquakes.32 They may be
spectacular failures that obliterate anything in their Possible flooding by Great Salt Lake depends on the
paths and are often accompanied by damaging air amount of displacement on the fault, but also the level
blasts around their peripheries. Although generally of the lake at the time of the earthquake. At higher
uncommon even in large earthquakes, an important lake levels, waters will inundate the Jordan River flood
historical rock avalanche in the Intermountain region plain upstream from where the river enters Farming-
was the Madison landslide (Figure 25) accompany- ton Bay. At the maximum historical lake elevation of
ing the 1959 Mw 7.3 Hebgen Lake earthquake in 4,212 feet (1,284 m), water could flood approximately
Montana. Several similar large prehistoric rock-av- 3 miles (4.8 km) southward along the flood plain.
alanche deposits have been mapped along the Although flood-control dikes protect much of the
Wasatch Front at the base of the Wasatch Range, area, dike failure or ground-water underflow beneath
although we do not know if they were caused by them or infiltration through them may result in flood-
large, prehistoric earthquakes. ing of oil refineries, a sewage disposal facility, and
residential and commercial development in rapidly
Ground Subsidence
growing areas northwest of Salt Lake City.33 At high
Ground subsidence is the permanent lowering of lake levels, floodwaters would reach the northern
the ground surface as a result of surface faulting. part of Salt Lake City International Airport and could
The scenario indicates possible permanent ground approach Interstate Highway 15.
Figure 25. Damming of the Madison River by the Madison landslide
in the 1959 Mw 7.3 Hebgen Lake earthquake formed Quake Lake.
Photo courtesy of the U.S. Geological Survey.
23Loss Modeling facilities. The program also contains default data-
bases for fault structures and ways to predict ground
Using Hazus motion.
While the default information is useful for gauging the
Hazus is a natural hazards loss estimation software potential impact, user-supplied regional specific in-
package developed by the Federal Emergency formation is necessary to improve the accuracy of the
Management Agency and the National Institute of
loss estimation. The more complete and accurate the
Building Sciences. It is used to model economic, life,
regional specific information used in the calculations,
building, and lifeline losses and to model shelter, de-
the more accurate the resulting loss estimations.
bris removal, and essential service needs following:
earthquakes, flooding, hurricanes, and coastal surg- Unfortunately, gaining access to regional specific
es. Its primary purpose is to provide a methodology information from businesses, as well as government
and needed software to predict losses at a regional sources is not straightforward. The table below
scale. These loss estimates are used by local, state, shows the input for the Hazus run used in this sce-
and regional offices to plan and stimulate efforts to nario. Importantly, losses for several critical facilities
reduce risks and to prepare for emergency response and structures, such as schools, electric and natural
and recovery. Loss estimates are also generated gas facilities, and water facilities are based on the
post-disaster to evaluate the severity of loss and to Hazus defaults. Because of this, the scenario is most
identify needed resources. likely under-estimating the severity of overall losses,
Developed at a national level, the program includes especially those related to schools. As additional
many default databases for general building stock— information for the Wasatch Front and the State of
construction type and occupancy classes—and Utah becomes available, the estimated losses will
facility information for select lifeline and essential change, likely making the losses greater.
Hazus Data Inputs
Local/Regional Specific Information Default/National Based Information
• Salt Lake County Assessor database (2009) • Homeland Security infrastructure data
(2011/2012)
• Residential building counts and building area
(2010) - Fire stations
• Updated unreinforced masonry building distribu- - Police stations
tion for all of Utah - Emergency Operation Centers
• Utah Division of Emergency Management (DEM) - Natural gas pipelines
Federal Emergency Management Agency (FEMA)
- Oil pipelines
custom updates
• Hazus default database
- Hospitals (2012)
- Schools - Rail segments
- Highway bridges from UDOT (2012)
- Dams - Airport runways
- Light rail stations and segments (2012)
- Airports - Communication facilities
• Geologic data
- Oil facilities - Electric power facilities
- Liquefaction and landslide susceptibility
- Bus facilities - Natural gas facilities
- Soil type and water depth - Rail facilities - Hazardous material facilities
• Input ground motions (see pages 15-16) - Rail bridges - Waste water facilities
• RSMeans ® construction estimations (2012) - Rail segments
24You can also read