Scientific Perspectives after Copenhagen - Information Reference Document 1 - Climat.be
←
→
Page content transcription
If your browser does not render page correctly, please read the page content below
Scientific
Perspectives
after Copenhagen
Information Reference Document

                                 1
Disclaimer
This Information Reference Document was commissioned by the EU’s Climate Change Science Experts on
behalf of EU member states. The paper was prepared by scientists throughout Europe and is based on an
ongoing project, conducting a more detailed analysis and review of literature in which external experts have
also been consulted.

It is an advisory document, which has been written to inform climate change negotiators and policymakers of
the most relevant up-to-date scientific knowledge on climate change.

Authors
Writing Team: Eric Fee (Ed.)*, Daniel J.A. Johansson**, Jason Lowe†, Philippe Marbaix‡, Ben Matthews‡, Malte
Meinshausen&
Project Manager: Sue Postle Hammond
Steering Group: Ernesto Rodriguez Camino, Jolene Cook, Katrine Krogh Andersen, Jose Ramon Picatoste,
Markku Rummukainen, Christiane Textor, Martine Vanderstraeten, David Warrilow

*Federal Environment Agency, Germany; **Chalmers University of Technology, Sweden; †Met Office Hadley Centre,
                                                           &
United Kingdom; ‡Université catholique de Louvain, Belgium; Potsdam Institute for Climate Impact Research, Germany

Acknowledgments
The Spanish and Belgian Presidency thank the Writing Team, the members of the Steering Group and the
members of the EGSci for their valuable comments and guidance and the UK Department of Energy and
Climate Change (DECC) for providing financial support for project management.

2
Scientific
                                                             Perspectives
                                                       after Copenhagen
                                              Information Reference Document, October 2010

Contents
Disclaimer................................................................................................................................................ 2
Preface - Scientific perspectives after Copenhagen ............................................................................... 3
Summary ................................................................................................................................................. 6
1. Introduction ........................................................................................................................................ 8
2. Stabilisation targets .......................................................................................................................... 10
3. Setting the milestone for 2020 emissions ........................................................................................ 12
4. Analysis of the Copenhagen Accord pledges .................................................................................... 14
5. Prospects for effective action ........................................................................................................... 16
6. Avoiding dangerous climate change ................................................................................................. 19
Appendix ............................................................................................................................................... 22
   Abbreviations .................................................................................................................................... 22
   Endnotes ........................................................................................................................................... 22
   References ........................................................................................................................................ 23

                                                                                                                                                        3
Preface

Climate change presents a growing social, economic and political threat for all countries and one
which requires urgent international concerted action. The challenge facing governments is to
develop the international mechanisms required to tackle this common problem whilst at the same
time recognising the diverse capabilities and responsibilities of each country.

The Copenhagen Conference did not reflect the EU's expectations and ambitions, but did raise
climate change to the highest level of government policy and mobilised public opinion in an
unprecedented manner. The outcome established our common long-term goal of limiting warming
to below 2°C. However, a number of questions remain to be answered. For example, what is needed
for a reasonable chance of achieving a 2°C limit to global temperature rise? Where would different
reduction options lead us? What if we do not attain an emissions peak within the next decade? How
do the pledges relate to the 2°C limit?

It is important that policymaking is advised by the best relevant and up-to-date scientific information
available. The IPCC continues to be the most authoritative body to provide us with policy-relevant
information from the scientific literature. Since 2007, new studies have confirmed and
complemented IPCC AR4 findings. This paper is an EU contribution to the scientific understanding of
the nature of the problems we face and aims to guide us in the development of an effective solution.
It is to a large extent an update of the previous Information Reference Document - The 2°C target
(2008). The work was commissioned from a number of scientists across Europe following the
Copenhagen Conference of the Parties and addresses a number of key scientific and technical issues
relevant to the international efforts to combat climate change, including the Copenhagen Accord.

4
The paper indicates that the reduction pledges that Parties have offered in association with the
Copenhagen Accord are indeed a step in the right direction. However, they are likely to be
insufficient to achieve the 2020 milestone required to keep open the possibility of limiting global
temperature rise to 2°C, the goal of the Copenhagen Accord. Thus, for aligning actions with the long-
term goals, and for designing a viable future climate change regime, the first step has been taken.
Yet more needs to quickly follow, in order to achieve an emissions peak soon enough so that 2020
emissions become reduced to a level which allows for feasible and sufficient reduction rates
thereafter. The longer the delay in action, the more difficult it will become to limit global warming to
less than 2°C.

We commend this paper to you as a contribution to the ongoing negotiations and to their successful
conclusion.

Paul Magnette                                                                          Sabine Laruelle
Belgian Minister for Environment and Climate                   Belgian Minister for Scientific Research

                                                                                                     5
Summary
The Copenhagen Accord sets a goal of limiting average global surface warming to 2°C to achieve the
ultimate objective of the United Nations Framework Convention on Climate Change. It further calls
for Parties to submit their 2020 emission reduction pledges in order to begin achieving this goal.
Additionally, it allows for the review of a limit of 1.5°C in 2015.
To ensure a likely (>66%1) chance of achieving the common goal of limiting global warming to less
than 2°C above pre-industrial temperatures:
• A peak in emissions is required by approximately 2015. The later the peak occurs, the steeper
the decline in emissions would need to be in the subsequent decades. Delaying the emissions
peak past this window will result in annual reduction rates that potentially exceed feasibility
while substantially raising the costs of mitigation.
• A decrease in emissions of 50-70% relative to 1990 levels is necessary by 2050. This assumes
further emission reductions after 2050.
• Reductions of long-lived greenhouse gases, such as carbon dioxide are essential. In addition
reductions of the short-lived greenhouse gases, black carbon aerosol, tropospheric ozone, and
aviation-induced cloudiness could also make an important contribution by lowering the rates of
temperature increase in the near term. It would also counteract the warming resulting from
reductions in sulphate aerosol concentrations due to reduced fossil-fuel use and air quality
policies. Thus, reducing all constituents contributing to global warming may be necessary.
• Technologies that achieve negative CO2 emissions may be necessary in the long term (post
2030). Many studies suggest biomass energy with carbon capture and storage may be crucial for
maintaining a 2°C limit.
1
In this document “likely“ means that with the given emission path (of which we do not judge the probability that it will
occur), there is at least a 66% chance that the warming will be below the stated level, considering uncertainties in the
response of the climate system.
6The current emissions reduction pledges associated with the Copenhagen Accord fall short of a
2020 milestone that maintains a likely chance of achieving a 2°C limit without requiring potentially
infeasible post-2020 reduction rates. Even the most optimistic interpretation of the current pledges
leaves a gap of 2-6 Gigatonnes of CO2 equivalents. Excluding the conditional pledges and other
optimistic hypotheses, the gap in 2020 is approximately 10 Gigatonnes of CO2 equivalents.
The main conclusions in this report are based on a probability of at least 66% that temperature
increase is limited to below 2°C. If a higher probability of staying below 2°C is required then greater
emission reductions would be needed. If a lower probability is considered acceptable (for instance
50%) then emission reductions could be lower. However, our analysis of the current Copenhagen
Accord pledges shows that, even allowing a 50% probability of limiting warming to below 2°C, the
required post-2020 emission reduction rate may not be feasible.
The achievement of the large reductions in anthropogenic greenhouse gases required to maintain
the 2°C limit highly depends upon the implementation of effective policy instruments. This includes
targeting as many emissions sources as possible with cost effective policies which are perceived as
fair. Cost effectiveness can only be achieved by giving long-term signals that enhance necessary
investments and by making emitting of greenhouse gases costly. Well-attuned development can
also contribute to mitigation and improve adaptive capacity by shifting to more sustainable
development pathways. Sustainable development paths may also reduce the potential negative side
effects of mitigation efforts, such as negative impacts of increased biomass production on food
security, biodiversity and deforestation.
Recent literature reinforces the evidence provided by the IPCC AR4 that limiting warming to less
than 2°C above pre-industrial temperatures considerably reduces the risk of triggering accelerated
or irreversible changes in the climate system as well as large-scale adverse impacts. Nevertheless,
significant risks do still remain. Impacts of climate change will, in addition, not be the same
everywhere and some regions or sectors might experience a disproportionate amount of adverse
impacts.
The Copenhagen Accord also calls for a review, in 2015, of a potential 1.5°C limit. Research in
relation to this is expected to be synthesised in the upcoming IPCC 5th assessment report. The few
limited assessments currently available give preliminary evidence that such a goal might only be
possible by allowing temperatures to initially exceed 1.5°C, followed by temperature reductions
towards the end of the century or later (overshooting).
71. Introduction This paper presents a scientific assessment of the implications of the 2020 emission reduction pledges associated with the Copenhagen Accord and provides an update of the recent scientific evidence of direct relevance to these. It is intended to provide Parties with information on the implications of these pledges with relevance to a post-2012 agreement. The Copenhagen Accord (CA) established a goal to limit global average surface warming to less than 2°C (hereafter referred to as the 2°C limit). A review is also envisaged for 2015 to consider a lower temperature limit of 1.5°C. In support of the 2°C limit, national pledges to reduce emissions by 2020 are given in the appendices of the Copenhagen Accord. There are, however, many open questions as to how a 2°C limit is to be achieved in light of the current pledges. This paper aims to improve the understanding of the ramifications these mitigation pledges have in respect to the 2°C limit. The 2008 EU 2°C Target Paper (EG Science 2008), based largely upon the IPCC Fourth Assessment Report (AR4), catalogued a range of evidence as to why an increase of more than 2°C in global average near-surface temperature compared to pre-industrial temperatures is expected to be undesirable on a global scale. Since the AR4, the understanding of climate system components and processes has continued to improve, although considerable uncertainties remain. Recent evidence reinforces the importance of maintaining 2°C as an upper limit to temperature increases. In this paper we present an assessment of a range of different emission pathways and an evaluation of the technical and economic feasibility of achieving large emission reductions. We then discuss the implications of emission reduction pledges associated with the Copenhagen Accord and present actions required for achieving stringent targets. We finish with an update of recent findings regarding changes in the climate system and their impacts in relation to a goal of limiting warming to below 2°C. 8
How certain are we about limiting warming to an acceptable level?

Projections of future climate have some uncertainty associated with them. This means that when
we talk about limiting warming below a particular temperature, such as 2°C, we are really specifying
the probability of keeping the temperature below the chosen limit. Clearly, there remains some
chance that the limit will still be exceeded.

The probability with which we should aim to keep warming below 2°C is not specified in the
Copenhagen Accord, which simply states that the global temperature increase shall remain below
2°C. It remains an open question for negotiators and policy makers to decide what level of certainty
they are willing to work with.

In this document, for much of our analysis and when forming our main conclusions, we have chosen
to use a probability level of at least 66% (defined by the IPCC as “likely”). Requiring at least a 66%
chance of limiting global temperature rise to below 2°C implies there is up to a 34% chance of
exceeding this temperature limit.

A lower probability level (of at least 50%) for limiting warming to below a given temperature is also
commonly used in the published literature. When comparing results from a range of different
studies it is vital to establish what probability level has been used in each case.

                                                                                                     9
2. Stabilisation targets
How do choices in emission pathways affect future temperature?
The total emissions over the entire time span in question are important due to the strong
correlation between cumulative emissions and temperature outcomes (e.g. Allen et al. 2009,
Meinshausen et al. 2009). Setting global emission milestones in specific years, namely in 2020 and
2050, does constrain cumulative emissions to a certain degree and can therefore help indicate
whether a 2°C limit can be maintained. This is because there are a limited number of feasible
pathways that can occur between these milestones.
A later peaking date requires a higher rate of emissions reduction after the peak, or lower (or even
negative) emissions in the long term to achieve the same probability of limiting warming to below
a particular level. As a consequence, later and/or higher peaks increase the required speed at which
a transition to a low carbon economy must occur after peaking. The interplay between emissions
peak year and post-peak reduction rate from one particular study is illustrated in Figure 2.1.
Figure 2.1: Illustrative example: Projected
maximum global average surface temperature
reached with a 50% probability for a range of
emissions pathways. Results are presented for
emission peak years ranging from 2016 to 2030
and post peak emission reduction rates of from
1% per year to 6% per year compounded (Gohar
and Lowe 2009). Uncertainty in the climate
projections was determined following Lowe et al.
(2009) (see endnote 1).
10For a given warming target, early peaking reduces the subsequent rate of emission reductions that
are needed for a given temperature target. As expected, it can also be seen from these results that,
given the same long-term emission reduction rates, early peaking gives a higher chance of limiting
warming to lower temperature levels. For post-peak emission reduction rates of 2% per annum or
greater (see endnote 2), each decade of delay in the peaking date increases the peak warming level
by between 0.2 and 0.5°C given the same rate of decline in post peak emissions, as displayed by the
sloping red lines in Figure 2.1.
Significant reductions in temperature will require net removal of emissions from the
atmosphere.
Recent literature (Matthews and Caldeira 2008; Solomon 2009; Lowe et al. 2009) suggests that if
emissions are reduced to very low levels (or zero) in the long term, the decline in atmospheric CO2
concentrations are likely to occur slowly and temperatures would not decline, but would stabilize.
A decline in temperatures could be achieved, albeit the extent is uncertain, by globally net negative
CO2 emissions (e.g. Biomass Energy with Carbon Capture and Storage – BECCS), supported by a
vigorous abatement of non-CO2 greenhouse gases (see section 5).
This has two major implications: Firstly, if global warming progressed to a level that is found to
produce unacceptable consequences it remains uncertain how quickly, or even if, it can be brought
back to a safer, lower level. Secondly, even for a 2°C limit, net emissions of greenhouse gases,
particularly CO2, have to be at least close to zero towards the end of the 21st century. It is also
important to note that, a stabilisation of temperature will not lead to an immediate stabilisation of
other aspects of the climate system - particularly sea level rise and possibly large-scale components
of the system, such as the Amazon forest (Jones et al. 2009).
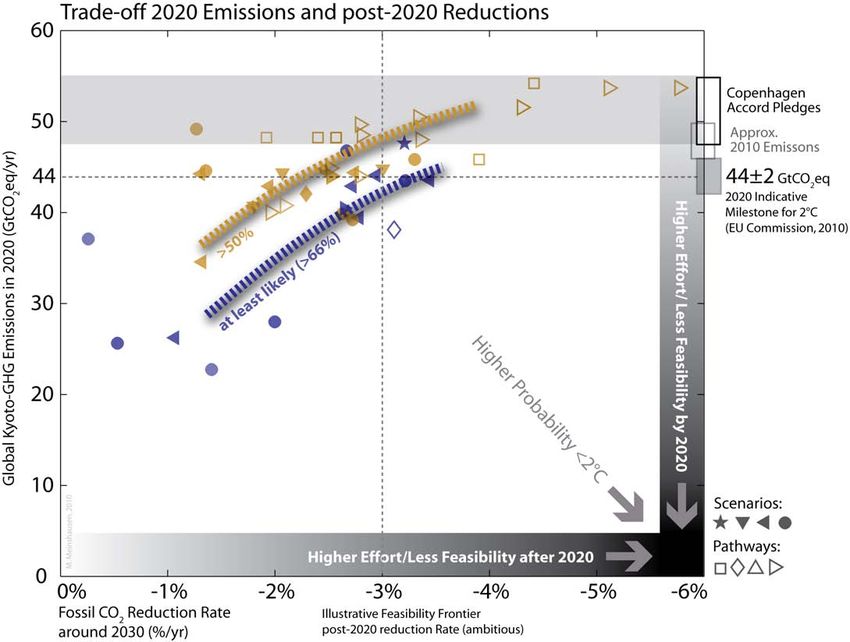
113. Setting the milestone for 2020 emissions This section focuses on how to set the emission target milestones in 2020 (and 2050) in order to effectively plan a journey towards a low or zero-carbon economy with a sufficiently small probability of exceeding the 2°C limit. Higher emission levels in 2020 imply steeper subsequent reduction rates, as discussed in Section 2. Furthermore, increased mitigation effort between now and 2020 avoids locking into carbon intensive infrastructure, making it easier to manoeuvre in the future. We have collected more than 100 emission pathways available from a range of climate mitigation studies (specifically EMF-22, ADAM and RECIPE inter-comparisons) and, using established techniques (Meinshausen et al. 2009), estimated their probability of exceeding a warming limit of less than 2°C in a consistent way (see endnote 3). Many of the pathways peaking between 2010 and 2020 display a likely (>66%) probability of achieving the 2°C limit whereas those peaking later have a more limited chance of this. This is consistent with recent estimates of a global emission level of 44 GtCO2eq/yr by 2020 ( ± 2 GtCO2eq) being used as an indicator of whether global emissions are on the right track for avoiding warming of more than 2°C (Tirpak et al. 2009; Stern 2009; EU Commission 2010). Current levels of total anthropogenic emissions are estimated at 48 GtCO2eq/yr (van Vuuren and O'Neill 2006; Manning et al. 2010). Thus, today’s emission levels exceed those envisaged as being desirable in 2020 by roughly 4 GtCO2eq/yr (±2 GtCO2eq), requiring the peaking of global emissions by approximately 2015 in order to achieve at least a likely chance of limiting warming to below 2°C. Our analysis quantifies the implications of 2020 emission levels with regards to the stringency of post-2020 mitigation efforts (see Figure 3.1) and the achievement of the 2°C limit with a specific probability. In practice, there will be limitations in the socially-acceptable and politically-feasible future reduction rates, even if they are technically feasible. In addition to raising issues of intergenerational equity and economic optimality, a delay of decisive mitigation actions would also result in a high 2020 global emission level which might also lead to higher temperature levels. In other words, delayed mitigation in the near-term might practically foreclose the option for mid- course corrections after 2020 to achieve the 2°C limit, if it turns out that more pessimistic estimates about climate system behaviour and/or diffusion rates of carbon neutral technologies were to come true. 12
Figure 3.1 Relationship between 2020 emission levels and post-2020 reduction rates. Each marker represents
one scenario, with 2020 GHG emission levels on the vertical and 10-year average fossil CO2 reduction rates in
2030 on the horizontal bottom axis. The yellow markers are associated with a >50% probability of staying
below 2°C warming, whilst the blue markers are associated with a likely or >66% probability. Dashed bold lines
illustrate the trade-off between higher efforts to reduce emissions up to 2020 and thereafter in the two
different likelihood classes of scenarios. Reduction rates are given in % of year-2000 global emission levels per
year (see endnote 1).

For a 44 GtCO2eq (± 2 GtCO2eq) emission level in 2020, our analysis finds that annual reduction rates
of around 3% are required for a pathway with at least a likely chance (66% or greater) of limiting
global warming to below 2°C. Although consideration of 2050 emissions is absent from the
Copenhagen Accord it is discussed further in negotiating texts on the “Shared Vision”. We find that
most scenarios suggest a 50 to 70% reduction in emissions relative to 1990 to maintain at least a
likely chance of limiting warming to below 2°C.

                                                                                                             13
4. Analysis of the Copenhagen Accord pledges The Copenhagen Accord invited parties to submit their pledges for 2020 emissions by 1 February 2010. Over 76 countries, accounting for approximately 80% of global emissions, provided their pledges as of 30 June 2010. Various studies have now quantified the potential implications for global emissions by 2020, ten of them being summarized in Figure 4.1. More recent pledges have little effect on these results (the sum of additional pledges amount to
Figure 4.1 Assessments of the
Copenhagen       Accord      Pledges
following the low unconditional
(medium grey arrows) and high
conditional pledges (bright grey
arrows) inscribed in the Copenhagen
Accord, with some taking into
account extra accounting provisions
allowing higher emissions due to
surplus AAUs or LULUCF (black
arrows).

Some of the assessment studies
might generally underestimate
effective 2020 emissions, since
underlying officially reported
country-by-country      emission
data tends to be lower than
globally-aggregated    top-down
emission estimates. A correction
for that discrepancy could
increase some of the studies’
2020 emission level estimates by
as much as 5% (Rogelj et al.
2010).

The emission levels of unconditional/lower pledges (54-55 GtCO2eq/yr) far exceed any pathways
which have at least a likely chance of limiting warming to below 2°C. Our analysis suggests that even
a 50% chance or greater is only possible by embarking on potentially infeasible reduction rates of 4%
or higher, see Figure 3.1. Even under the most optimistic interpretation of the Copenhagen Accord
Pledges, and the assumption that all Parties would aim for their conditional higher-end pledges, very
few, if any literature scenarios would suggest a likely (66%) chance of limiting warming to 2°C.

Net negative emissions in the second half of the century might be able to compensate for a reduced
emission reduction rate between 2020 and 2050, but this carries the sizeable risk of relying on
experimental technology that has not yet been tested on a large scale.

                                                                                                 15
5. Prospects for effective action The transition to a society with near-zero emissions of greenhouse gases before the end of the century is an enormous challenge. To facilitate this radical transformation of the global energy and food systems both public support and credible and effective policies stimulating the transition are necessary. This essentially includes a mix of different policy tools, including the use of a carbon price mechanism, stimulation of RD&D, and additional policies that ensure that new technologies are widely available and deployed. Options to reduce CO2 emissions A massive investment in carbon-free energy technologies and supporting infrastructure is needed in order to achieve an emissions peak within the next 3 to 5 years and to be on a pathway consistent with a 2°C limit. Such transition would bring about important co-benefits in terms of reduced air pollution (Haines 2009) and increased energy security (IEA 2010). Recent studies suggest that more than 50%, and up to 90%, of the global primary energy supply must be provided by low carbon technologies by 2050 (compared to about 20% in 2005) if the CO2eq concentration is to be below 400-450 ppm (which implies at least a 50% chance of a 2ºC limit) by 2100 (Edenhofer 2010; Clarke, et al. 2009). In addition, the global primary energy demand is expected to grow in the coming decades. How much it expands depends on the efforts to reduce emissions of greenhouse gases and the potential for energy efficiency and conservation measures (see below). However, in baseline scenarios the global primary energy demand is expected, in round numbers, to double by 2050 (Clarke et al. 2009; Edenhofer 2010; IEA 2010). The difficulty of reducing emissions also depends on development pathways, including such issues as equity, poverty, attention to sustainability and the environment as well as resource availability and extraction cost of fossil fuels. Taking this into account, there are three principle ways of reducing CO2 emissions from the energy system. 1) Reduction of energy use through efficiency and conservation measures. Improving energy efficiency is considered to be one of the most important mitigation options for the first half of this century and has a great potential for being low cost, and to a limited extent have negative costs (e.g. van Vuuren et al. 2009, McKinsey 2009, IEA 2010, Kitous et al. 2010). Harnessing this potential will require, in addition to price-based policy instruments, directed policies such as building codes and efficiency standards as well as long-term planning of urban structures and transport infrastructure. 2) Transition of fuels to less CO2-emitting fossil fuels and to renewable and nuclear energy. In the coming decades renewable energy technologies must expand profoundly if low emission limits are to be met (Edenhofer et al. 2010; IEA 2010). Biomass energy (or biofuels) is found to be especially important for making low concentration limits (400-450 ppm CO2eq) feasible and for the costs of achieving such limits (Edenhofer et al. 2010). However, there may be risks of land use conflicts and increased N2O emissions related to a biomass expansion. Nuclear is found to increase above its present level in many mitigation studies (Edenhofer et al. 2010; IEA 2010; Kitous et al. 2010). 16
However, nuclear is found to be less important than renewable energy or carbon capture and
storage (CCS) for the feasibility and cost of reaching low stabilization targets (Edenhofer et al. 2010).
Problems with nuclear weapons proliferation and safety as well as storage of spent fuel may put
additional constraints for a large-scale expansion of the energy source (Socolow and Glaser 2009).

3) Capture and storage of carbon dioxide from fossil fuels and biomass. Though not yet commercially
available, this technology is considered to be very important for meeting stringent stabilization limits
(Azar et al. 2010; Edenhofer et al. 2010; van Vuuren et al. 2009; Calvin 2009). Capturing and storing
CO2 from biomass would imply negative emissions if the biomass is constantly re-cultivated,
reaching, in some IAMs, as much as -10 GtCO2 or less by the end of the century (Edenhofer et al.
2010; Azar et al. 2010; Calvin et al. 2009). A large-scale expansion of BECCS is believed to be
necessary to achieve annual emission reduction rates of more than 3-4% (den Elzen et al. 2010). In
addition, the geological CO2 storage needs to be safe and permanent so as to achieve the full climate
benefit of the technology and to avoid risks with leakage of CO2.

Furthermore, management of soil and forest carbon can, to a limited extent, lessen the required
pace of the transformation of the energy system.

Options to reduce non-CO2 GHG emissions and other contributors
Although CO2 is the most important anthropogenic greenhouse gas, reducing non-CO2 greenhouse
gas emissions can also contribute to lowering near-term temperature increases (Ramanathan and
Xu 2010). Most importantly, there is a significant potential to decrease emissions of greenhouse
substances such as methane (CH4), nitrous oxide (N2O), hydrofluorocarbons (HFCs), black carbon
(BC) and tropospheric ozone (O3) pre-cursors such as carbon monoxide (CO). Addressing aviation-
induced cirrus clouds may also provide some contribution.

CH4 emissions from waste and sewage treatment plants and the energy industry as well as N2O
emissions from industrial sources can be reduced to small levels at low costs (Delhotal et al. 2006,
Lucas et al. 2007). Emissions of CH4 and N2O from the agricultural sector are inherent parts of the
biological processes in food production, although some abatement options are available and more
could become available given successful RD&D (Lucas et al. 2007; Smith et al. 2008).

The mitigation of BC and O3 are required in addition to reductions in CO2, to increase the chances
of achieving the 2°C limit. Short-lived greenhouse gases (such as O3) and some aerosols (such as BC),
also tend to warm the climate (Forster et al. 2007; Ramanathan and Carmichael 2008). Given their
short atmospheric lifetimes, temperatures in the longer term will be little affected by BC and O3
mitigation action in this decade, although mitigation would slow the current rate of warming.

                                                                                                     17
Mitigation cost and timing of emissions reductions Recent studies, such as those undertaken within the ADAM project (Edenhofer et al. 2010) and EMF 22 (Clarke et al. 2009), provide evidence that the cost of stabilizing at 450 ppm CO2eq in 2100 would be in the order of a few percent of Net Present Value Global GDP over the 21st century in a cost- effective climate regime, given global participation and the availability of the technologies described above. A delay in the transition to a low emission society reduces the economic and technical feasibility of reducing emissions enough to maintain a 2°C limit (den Elzen et al. 2010). For a likely chance of maintaining a 2°C limit, the turnover time in the energy system and other sectors of society is expected to be too long to support the rapid transition that would be necessary after a postponement of emissions peaking beyond 2015. Earlier peaking allows for gradual replacement of old inefficient fossil-based technologies and earlier development and diffusion of new technologies. Immediate participation by both developing and developed nations would provide the most cost- effective pathway to limit warming to below 2°C. Delayed participation of major emitters among developed and developing countries under a stringent emissions reduction target appears to be more costly for all parties. If emission reductions were initially undertaken only in Annex B countries that are party to the Kyoto Protocol, other countries’ emissions would later need to be reduced from a higher level and more rapidly (Krey and Riahi 2009). Implications of the current economic downturn Recent analysis shows that 2009 was the first year since 1992 in which the global emissions of CO2 did not increase (Olivier and Peters 2010). The economic downturn will most likely result in meeting Kyoto targets more easily, increasing the surplus emission allowances from the first commitment period, and that the reference emissions in the coming decades will be lower than what was believed prior to the crisis (den Elzen et al. 2009; IEA 2009). How much lower the reference emissions may be depends on how rapidly the world recovers from the crisis. Although, as economies start to grow again, emissions are expected to increase if stringent climate policies are not in place (e.g. Blanford et al. 2009, den Elzen et al. 2009). 18
6. Avoiding dangerous climate change

As has been found in the IPCC AR4 and reinforced in the EU 2°C Target Paper (EG Science 2008), if an
increase in the global average temperature exceeds 2°C, it becomes less likely that the majority of
human systems can adapt to climate change at globally-acceptable economic, social and
environmental costs. In fact, by the time the global average temperature has reached 2°C, some
regions are likely to have already experienced sizeable impacts on human activities and ecosystems.

A key area where advances have occurred since the IPCC AR4 and the EU 2°C Target Paper, is in the
understanding of large-scale accelerated or irreversible changes in the climate if a certain threshold
or tipping point is passed. These include disruptions in the El Niño Southern Oscillation phenomenon
in the Pacific, dieback of the Amazon Rainforest and disappearance of summer Arctic sea-ice.
Melting of the Greenland and West-Antarctica ice sheets could also occur, contributing to an
eventual sea level rise of several metres within a few centuries. A number of studies (including
Rahmstorf 2010, Lowe and Gregory 2010, Pfeffer et al. 2008) have indicated an accelerated sea level
rise in the order of 1 to 2m within this century.

The outcome of several recent studies, which used expert interpretation of the literature and other
available evidence, reinforces the AR4 conclusions – that the probability of triggering at least one
major climate system change, such as those mentioned above, increases greatly as warming exceeds
approximately 2°C (Zickfeld et al. 2010; Lenton et al. 2008; Kriegler et al. 2009; Smith et al. 2009).

The evidence base for site and sector specific impacts caused by future climate change has also
grown rapidly since the IPCC AR4. A brief selection of evidence since the AR4 is provided in Table 6.1.
In general, the recent literature reinforces observations and predictions reported in the IPCC AR4. A
key aspect is that the impacts are likely to vary regionally, but with large-scale negative impacts
outweighing any positive benefits of climate change. Some regions are likely to experience a
disproportionate share of negative climate impacts, e.g. parts of Africa and the Small Island States.

Despite large uncertainty on the “tipping points” and impacts, it is a robust conclusion that
temperature targets below 2°C further decrease the risks of causing accelerated or irreversible
changes or unacceptable levels of impacts.

                                                                                                   19
Table 6.1 Impacts of climate change in IPCC AR4 and more recent studies1.
Impact IPCC AR4 Examples of key studies since AR4 WG2
Coastal Progressive; Agreement with IPCC AR4 that south-east Asia will be the most
systems > 2-3°C: millions or tens of affected region. Global estimates of the number of impacted
millions of additional people people remain at similar levels (e.g. [1]). It is increasingly
affected by flooding recognised that adaptation, socio-economic and other non-climatic
depending on adaptation and factors will likely play an important role [2], and the current
other factors uncertainty in the magnitude of sea-level rise adds further
complexity to estimating impacts.
Ecosystems Ongoing: contribution to Increasing evidence to support the IPCC AR4 statement that 20-
& extinction of species such as 30% of plant and animal species are at increasingly high risk of
Biodiversity some amphibians, increased extinction as global mean temperature rise exceeds 2 – 3°C.
coral bleaching, increasing risk Recent observations from the Amazon provide further
of wildfire. understanding of forest susceptibility to drought [3]. Increasing
2°C: 20-30% of species at recognition that effects other than greenhouse gas warming are
increased risk of extinction. critical for the forest [4, 5]. Further evidence that ocean
> 2.5°C: terrestrial biosphere acidification could result in a mass extinction of worldwide coral
becomes a net carbon source. species [6, 7, 8] More research into the impact of ocean
> 4°C: major extinctions (40- acidification on fish and shell fish, with the impacts generally being
70% species) shown as detrimental [9, 10, 11].
Water Progressive; Recent studies do not suggest a major change in the risk since AR4,
resources 1 – 1.5°C: additional 0.4 to 1.7 but they do represent a move towards a better representation of
billion people at increased uncertainty in water resources modelling [12, 13, 14].
water stress Results show that that mitigation could lower, but not eliminate,
the impact of climate change on water resources [15, 16].
Agriculture >1.5°C: negative impacts on More research has examined the potentially positive effect of CO2
& food some regions (low latitudes) enrichment on crop productivity [17, 18, 19, 20, 21, 22, 23].
security and crops, positive in others Generally, the results of these studies suggest a less optimistic
>4 °C: low latitude yields response of crops to CO2 enrichment and highlight the reduced
decrease for all cereals yield associated with increased temperature, ozone, and
occurrence of pests and weeds.
Human Ongoing and progressive: [13] shows that in a 4°C warmer world annual summertime heat-
health mortality and morbidity from related mortality could increase by more than threefold from
heat waves, flood and present-day levels for cities including Boston, Budapest, Dallas,
droughts; changed Lisbon, London and Sydney without adaptation. Conversely, milder
distribution of some disease winters will contribute to reduce the number of temperature-
vectors related deaths [13, 24, 25], with important regional differences.
> 1°C: increased burden from Recent research confirms AR4 findings and elaborates upon the
malnutrition, diarrhoea influence of climate on the distribution of vector-borne diseases;
> 3°C: substantial burden on for dengue and malaria, non-climatic factors are expected to
health services dominate [26, 27]. 1
1 All temperature increases are relative to preindustrial. References: [1]Dasgupta et al. 2009; [2] Nicholls et al.
2008;[3] Philips et al. 2009; [4] Golding and Betts 2009; [5] Malhi et al. 2009; [6] Cao and Caldeira 2008; [7]
Veron 2008; [8] Veron et al. 2009; [9] Checkley et al. 2009; [10] Munday et al. 2009; [11] Legge and Tyrell
2009; [12] Preston and Jones 2008; [13] Gosling et al. 2009; [14] Hayashi et al. 2010; [15] Fischer et al. 2007;
[16] Arnell et al. 2010a,b; [17] Tubiello et al. 2007; [18] Lobell et al. 2008; [19] Ainsworth and McGrath 2010;
[20] Aggarwal 2008; [21] Reilly et al. 2007; [22] Van Dingenen et al. 2009; [23] Booker et al. 2009; [24] Bosello
et al. 2006; [25] Hayashi et al. 2010; [26] Jansen and Beebe 2010; [27] Wandiga et al. 2010.
20Are lower limits feasible?
The Copenhagen Accord provides for a review of a potential 1.5°C limit in 2015. Greater insight on
this is expected to be provided in the IPCC 5th Assessment Report. Currently, there are only a few
studies that have examined emission pathways and scenarios that provide a reasonable chance of
limiting warming to 1.5°C. These have provided preliminary evidence that to have a reasonable
chance of limiting warming to below 1.5°C, GHG emissions reduction rates in excess of 3 or 4% per
year would be required following an emissions peak within the next few years. There are currently
insufficient mitigation measures available in many Integrated Assessment Models to achieve such
reduction rates (Bosetti et al. 2009; Clarke et al. 2009). Even under a very stringent level of
mitigation action, temperatures will probably exceed 1.5°C for some time, so that such a goal may
only be achievable by aiming to return temperatures to 1.5°C by the end of the century or later
which would require large-scale negative CO2 emissions. Further research on this would be useful for
the review in 2015.
21Appendix
Abbreviations
AAUs Assigned Amount Units
AOSIS Alliance of Small Island States
BECCS Biomass Energy and Carbon Capture and Storage
BC Black Carbon
CA Copenhagen Accord
CH4 Methane
CO Carbon monoxide
CO2 Carbon dioxide
GtCO2 Gigatonnes of Carbon Dioxide
GtCO2 eq Gigatonnes of Carbon Dioxide equivalent
HFCs Hydrofluorocarbons
IPCC AR4 Intergovernmental Panel on Climate Change Fourth Assessment Report
LDCs Least Developed Countries
LULUCF Land use, land use change and forestry
N2 O Nitrous oxide
O3 Ozone
RD&D Research Development and Demonstration
UNFCCC United Nations Framework convention on Climate Change
Endnotes
1. The likelihood assessment underlying Figure 3.1 is based on a climate sensitivity uncertainty in line with the IPCC AR4
estimate (see ‘illustrative default’ in Meinshausen et al., 2009). This is slightly different to Figure 2.1, in which the
somewhat higher warming in part results from a climate sensitivity uncertainty distribution based on Murphy et al. (2004),
as detailed in Lowe et al. (2009).
2. There is no particular reason why emissions should fall at a specific and constant rate beyond the peak. However, this has
been assumed in the analysis underlying the graph so as to make it transparent and simple.
3. For providing the overview of the current mitigation literature we took into account the following emission scenarios and
pathways: (1) We use 91 emission scenarios from various modelling groups that took part in EMF-22 (Clarke et al. 2009),
namely ETSAP-TIAM (Loulou et al. 2009), FUND (Tol 2009), GTEM (Gurney et al. 2009) , IMAGE (van Vliet et al. 2009),
MERGE (Blanford et al. 2009), MESSAGE (Krey and Riahi 2009), MiniCAM (Calvin et al. 2009), POLES (Russ and van Ierland
2009), SGM (Calvin et al. 2009), and WITCH (Bosetti et al. 2009). (2) We use 15 fossil CO2 scenarios from five modelling
groups participating in the EU ADAM project (Edenhofer et al. 2010), namely E3MG (Barker and Scrieciu 2010),
POLES(Kitous et al. 2010), MERGE (Magne et al. 2010), REMIND-R (Leimbach et al. 2010) and TIMER (van Vuuren et al.
2010). (3) We use six fossil CO2 scenarios from the RECIPE project, as described in Edenhofer et al. (2009) and Luderer et
al. (2009). (4) We included new emission scenarios for climate model intercomparison (so-called RCPs) (Moss et al. 2010).
(5) STERN / Bowen and Ranger (2009): Several multi-gas emission pathways (6) AVOID / Gohar and Lowe (2009): The
AVOID programme designed various stylized multi-gas emission pathways, eleven of which are included here. (7)
PRIMAP/Rogelj et al. (2010): We include four PRIMAP emission scenarios consistent with a quantification of the low or high
pledges. (8) EQW / Meinshausen et al. (2009): Two strong EQW mitigation case scenarios building on SRES multi-gas
characteristics are included. We complemented any missing gases of EMF-22, ADAM and RECIPE scenarios using the RCPs,
in particular RCP3-PD, RCP4.5 and RCP8.5 and linear interpolations in between based on the cumulative fossil CO2
emissions over the 21st century and harmonized to ~40 GtCO2eq/yr emission levels in year 2000 and emission trends up to
2005 consistent with observations of atmospheric concentrations (Meinshausen et al., submitted).
22References
Aggarwal, P. K. (2008): Global climate change and Indian agriculture: impacts, adaptation and Mitigation.
Indian Journal of Agricultural Sciences, 78, 911-919.
Ainsworth, E.A., McGrath, J. M. (2010): Direct effects of rising atmospheric carbon dioxide and ozone on crop
yields. In Lobell, B. E., Burke, M. (Eds): Climate Change and Food Security: Adapting Agriculture to a
Warmer World, Advances in Global Change Research, 37, 109-130.
Allen, M. R., Frame, D. J., Huntingford, C., et al. (2009): Warming caused by cumulative carbon emissions
towards the trillionth tonne. Nature, 458, 1163-1166.
Arnell, N. W., van Vuuren, D. P., Isaac, M. (2010 a.): The implications of climate policy for the impacts of
climate change on global water resources. Submitted to Global Environmental Change.
Arnell, N. W., Wheeler, T., Osborne, T., et al. (2010 b.): The implications of climate policy for avoided impacts
on water and food security. AVOID report AV/WS2/D1/R06, GA0215, Department of Energy and Climate
Change, UK.
Azar, C., Lindgren, K., Obersteiner, M., et al. (2010): The feasibility of low CO2 concentration targets and the
role of bio-energy with carbon capture and storage (BECCS). Climatic Change, 100(1), 195-202.
Barker, T. and Scrieciu, S. (2010): Modeling Low Climate Stabilization with E3MG:1 Towards a New Economics
Approach to Simulating Energy-Environment-Economy System. The Energy Journal, 31 (Special Issue).
Blanford, G. J., Richels, R. G. and Rutherford, T. F. (2009): Feasible climate targets: The roles of economic
growth, coalition development and expectations. Energy Economics, 31 (Supplement 2), 82.
Booker, F., Muntifering, R., McGrath, M., et al. (2009): The Ozone Component of Global Change: Potential
Effects on Agricultural and Horticultural Plant Yield, Product Quality and Interactions with Invasive
Species. Journal of Integrative Plant Biology, 51, 337-351.
Bosello, F., Roson, R., Tol, R. S. J. (2006): Economy-wide estimates of the implications of climate change:
Human health. Ecological Economics, 58, 579-591.
Bosetti, V., Carraro, C., Tavoni, M. (2009): Climate change mitigation strategies in fast-growing countries: the
benefits of early action. Energy Economics, 31, 144–S151
Bowen, A. and Ranger, N. (2009): Grantham/CCCEP Policy Brief No. 2: Mitigating climate change through
reductions in greenhouse gas emissions: the science and economics of future paths for global annual
emissions. London, UK, Grantham Institute: 47.
Calvin, K., Edmonds, J., Bond-Lamberty, B., et al. (2009): 2.6: Limiting climate change to 450 ppm CO2
equivalent in the 21st century. Energy Economics, 31(Supplement 2), 107.
Calvin, K., Patel, P., Fawcett, A., et al. (2009): The distribution and magnitude of emissions mitigation costs in
climate stabilization under less than perfect international cooperation: SGM results. Energy Economics,
31(Supplement 2), 187.
Cao, L., Caldeira, K. (2008): Atmospheric CO2 stabilisation and ocean acidification. Geophysical Research
Letters, 35, L19609.
Checkley, D., Dickson, A., Takahashi, M., et al. (2009): Elevated CO2 enhances otolith growth in young fish.
Science, 324, 1683.
Clarke, L., Edmonds, J., Krey, V., et al. (2009): International climate policy architectures: Overview of the EMF
22 International Scenarios. Energy Economics, 31(Supplement 2), 64.
Climateactiontracker.org (2010): ClimateActionTracker.org - Detailed information on individual country
pledges for greenhouse gas emission reductions. Retrieved May 2010 from
www.climateactiontracker.org.
23Climateinteractive/C-ROADS (2010): Climate Scoreboard." Retrieved March 2010 from
http://climateinteractive.org/scoreboard/scoreboard-science-and-data.
Dasgupta, S., Laplante, B., Meisner, C., et al. (2009): The impact of sea level rise on developing countries: a
comparative analysis. Climatic Change, 93, 379-388.
Delhotal, K. C., de la Chesnaye, F. C., Gardiner, A., et al. (2006): Mitigation of Methane and Nitrous Oxide
Emissions from Waste, Energy and Industry. Energy Journal, Special issue #3 - Multi-Greenhouse Gas
Mitigation, 27, 45-62.
den Elzen, M. G. J., Mendoza-Beltran, M. A., van Vliet, J., et al. (2009): Pledges and actions - A scenario analysis
of mitigation costs and carbon market impacts for developed and developing countries. Report
no.500102032, Netherlands Environmental Assessment Agency Biltoven, Netherlands.
den Elzen, M., Hof, A., Mendoza Beltran, M. A., et al. (2010): Evaluation of the Copenhagen Accord: Chances
and risks for the 2°C climate goal. Netherlands Environmental Assessment Agency, Biltoven,
Netherlands: 70.
den Elzen, M. G. J., van Vuuren D. P., van Vliet, J. (2010):, Postponing emissions reductions from 2020 to 2030
increases climate risks and long-term costs. Climate Change, 99(1-2), 313-320.
Edenhofer, O., Carraro, C., Hourcade, J.-C., et al. (2009): RECIPE - The Economics of Decarbonization: Synthesis
Report. Potsdam, Germany.
Edenhofer, O., Knopf, B., Barker, T., et al. (2010): The Economics of Low Stabilization: Model Comparison of
Mitigation Strategies and Costs. The Energy Journal, 31(Special Issue), 11-48.
EU EG Science Paper (2008): The 2oC Target Information reference document. Background on Impacts, Emission
Pathways, Mitigation Options and Costs.
EU Commission (2010): Commission Staff Working Document - Analysis of options to move beyond 20%
greenhouse gas emission reductions and assessing the risk of carbon leakage - Part II {COM(2010) 265
final}. Brussels, Belgium, EU Commission: 123.
Fischer, G., van Velthuizen, H., Wiberg, D. (2007): Climate change impacts on irrigation water requirements:
effects of mitigation, 1990-2080. Technological Forecasting and Social Change, 74, 1083-1107.
Forster, P., Ramaswamy, V., Artaxo, P., et al. (2007): Changes in Atmospheric Constituents and in Radiative
Forcing. In: Climate Change 2007: The Physical Science Basis. Contribution of Working Group I to the
Fourth Assessment Report of the Intergovernmental Panel on Climate Change [Solomon, S., D. Qin, M.
Manning, Z. Chen, M. Marquis, K.B. Averyt, M.Tignor and H.L. Miller (eds.)]. Cambridge University Press,
Cambridge, United Kingdom and New York, NY, USA.
Gohar, L.K. and Lowe, J A. (2009): Summary of the emissions mitigation scenarios. AVOID report
AV/WS1/D1/R02, GA0215, Department of Energy and Climate Change, UK.
Golding, N. and Betts, R. (2008): Fire risk in Amazonia due to climate change in the HadCM3 climate model:
Potential interactions with deforestation. Global Biogeochemical Cycles, 22, GB4007.
Gosling, S. N., McGregor, G. R., Lowe, J. A. (2009): Climate change and heat-related mortality in six cities Part 2:
climate model evaluation and projected impacts from changes in the mean and variability of
temperature with climate change. International Journal of Biometeorology, 53, 31-51.
Gurney, A., Ahammad, H. and Ford, M. (2009): The economics of greenhouse gas mitigation: Insights from
illustrative global abatement scenarios modelling. Energy Economics, 31(Supplement 2), 174.
Haines, A., McMichael, A. J., Smith, K. R., et al. (2009): Public health benefits of strategies to reduce
greenhouse-gas emissions: overview and implications for policy makers. The Lancet, 374, 2104-2114.
Hayashi, A., Akimoto, K., Sano, F., et al. (2010): Evaluation of global warming impacts for different levels of
stabilisation as a step toward determination of the long-term stabilisation target. Climatic Change, 98,
87-112.
24IEA (2009): World Energy Outlook 2009. Organisation for Economic Co-operation and
Development/International Energy Agency, Paris, France.
IEA (2010): Energy Technology Pathways 2010 – Scenarios and Strategies. Organisation for Economic Co-
operation and Development/International Energy Agency, Paris, France.
IPCC AR4 (2007): Fourth Assessment Report of the Intergovernmental Panel on Climate Change, 2007.
Cambridge University Press, Cambridge, UK.
Jansen C. and Beebe, N. (2010): The dengue vector Aedes aegypti: what comes next. Microbes and Infection,
12(4), 272-9.
Jones, C., Lowe, J., Liddicoat, S., and Betts, R. (2009): Committed terrestrial ecosystem changes due to climate
change. Nature Geoscience, 2, 484-487.
Kitous, A., Criqui, P., Bellevrat, E., Chateau, B. (2010): Transformation Patterns of the Worldwide Energy
System - Scenarios for the Century with the Poles Model. Energy Journal. 31 (Special Issue1), 49-82.
Krey, V. and Riahi, K. (2009): Implications of delayed participation and technology failure for the feasibility,
costs, and likelihood of staying below temperature targets--Greenhouse gas mitigation scenarios for the
21st century. Energy Economics, 31(Supplement 2), 94.
Kriegler, E., Hall, J. W., Held, H., et al. (2009): Imprecise probability assessment of tipping points in the climate
system. Proceedings of the National Academy of Sciences of the United States of America, 106, 5041-
5046.
Legge, O., Tyrell, T. (2009): Short review of chemical and biological consequences of ocean acidification. ICP
product number 7.2, report number 4, DECC/Defra (GA01101), MoD (CBC/2B/0417_Annex C5)
Leimbach, M., Bauer, N., Baumstark, L., et al. (2010): Technological Change and International Trade Insights
from REMIND-R. The Energy Journal, 31(Special Issue).
Lenton, T., Held, H., Kriegler, E., et al. (2008): Tipping elements in the Earth’s climate system. Proceedings of
the National Academy of Sciences of the United States of America, 105, 1786-1793.
Lobell, D. B., Field, C. B. (2008): Estimation of the carbon dioxide (CO2) fertilization effect using growth rate
anomalies of CO2 and crop yields since 1961. Global Change Biology, 14, 39-45.
Loulou, R., Labriet, M. and Kanudia, A. (2009): Deterministic and stochastic analysis of alternative climate
targets under differentiated cooperation regimes. Energy Economics, 31(Supplement 2), 131.
Lowe, J. A., Huntingford, C., Raper, S. C. B., et al. (2009): How difficult is it to recover from dangerous levels of
global warming? Environmental Research Letters, 4: Artn. 014012.
Lowe, J. A. and Gregory, J. M. (2010): A sea of uncertainty. Nature Reports Climate Change, 4, 42-43.
Lucas, P. L., Van Vuuren, D. P., Olivier, et al. (2007): Long-term reduction potential of non-CO2 greenhouse
gases. Environmental Science and Policy, 10 (2), 85-103.
Magne, B., Kypreos, S. and Turton, H. (2010): Technology Options for Low Stabilization Pathways with MERGE.
Energy Journal, 31(Special Issue), 83-108.
Malhi, Y., Aragao, L. E. O. C., Galbraith, D., et al. (2009): Exploring the likelihood and mechanism of a climate-
change-induced dieback of the Amazon rainforest. Proceedings of the National Academy of Sciences,
106, 20610-20615.
Manning, M. R., Edmonds, J., Emori, S., et al. (2010): Misrepresentation of the IPCC CO2 emission scenarios.
Nature Geoscience, 3, 376-377.
Matthews, H. D. and Caldeira, K. (2008): Stabilizing climate requires near-zero emissions. Geophysical Research
Letters, 35, L04705.
McKinsey (2009): Pathways to a low carbon economy: Version 2 of the global greenhouse gas abatement cost
curve, McKinsey & Company.
25Meinshausen, M., Hare, B., Wigley, T. M. L., van Vuuren, D., den Elzen, M. G. J. and Swart, R. (2006): Multi-gas
emission pathways to meet climate targets. Climatic Change, 75(1), 151-194.
Meinshausen, M., Meinshausen, N., Hare, W., et al. (2009): Greenhouse-gas emission targets for limiting global
warming to 2°C. Nature, 458(7242), 1158-1162.
Meinshausen, M., Smith, S. J., Calvin, K. V., et al. (submitted): The RCP Greenhouse Gas Concentrations and
their Extension from 1765 to 2500. Climatic Change, Special Issue.
Moss, R. H., Edmonds, J. A., Hibbard, K. A., et al. (2010): The next generation of scenarios for climate change
research and assessment. Nature, 463(7282), 747-756.
Munday, P. L., Dixson, D. L., Donelson, J. M., et al. (2009): Ocean acidification impairs olfactory discrimination
and homing ability of a marine fish. Proceedings of the National Academy of Science, 106, 1848-1852.
Nicholls, R. J., Tol, R. S. J., Vafeidis, A. T. (2008): Global estimates of the impact of a collapse of the West
Antarctic ice sheet: an application of FUND. Climatic Change, 91, 171-191.
Olivier, J. G. J., Peters, J. A. H. W. (2010): No growth in total global CO2 emissions in 2009. Netherlands
Environmental Assessment Agency (PBL), Bilthoven, The Netherlands.
Pfeffer, W. T., Harper, J. T. and O’Neel, S. (2008): Kinematic Constraints on Glacier Contributions to 21st-
Century Sea-Level Rise. Science, 321, 1340-1343.
Phillips, O. L., Aragao, L. E. O. C., Lewis, S. L., et al. (2009): Drought Sensitivity of the Amazon Rainforest.
Science, 323, 1344-1347.
Preston, B. L., Jones, R. (2008): A national assessment of the sensitivity of Australian runoff to climate change.
Atmospheric Science Letters, 9, 202-208.
Ramanathan, V. and Carmichael, G. (2008): Global and regional climate changes due to black carbon. Nature
Geoscience, 1, 221 – 227.
Ramanathan V. and Xu Y. (2010): The Copenhagen Accord for limiting global warming: Criteria, constraints, and
available avenues, Proceedings of the National Academy of Sciences, 107(18), 8055-8062.
Rahmstorf, S. (2010): A new view on sea level rise. Nature Reports Climate Change, 4, 44-45.
Reilly, J., Paltsev, S., Felzer, B., et al. (2007): Global economic effects of changes in crops, pasture, and forests
due to changing climate, carbon dioxide, and ozone. Energy Policy, 35, 5370-5383.
Rogelj, J., Nabel, J., Chen, C., et al. (2010): Copenhagen Accord pledges are paltry. Nature, 464(7292), 1126-
1128.
Russ, P. and van Ierland, T. (2009): Insights on different participation schemes to meet climate goals. Energy
Economics, 31(Supplement 2), 163-S173.
Smith, P., Martino, D., Cai, Z., et al. (2008) Greenhouse gas mitigation in agriculture, Phil. Trans. R. Soc. B,
363(1492), 789-813.
Smith, J. B., Schneider, S. H., Oppenheimer, M., et al. (2009): Assessing dangerous climate change through an
update of the Intergovernmental Panel on Climate Change (IPCC) "reasons for concern''. Proceedings of
the National Academy of Sciences, 106 (11), 4133-4137.
Socolow, R. H. and Glaser, A. (2009): Balancing risks: nuclear energy & climate change. Daedalus, 138 (4), 31-
44.
Solomon, S., Plattner, G. K., Knutti, R., et al. (2009): Irreversible climate change due to carbon dioxide
emissions. Proceedings of the National Academy of Sciences, 106, 1704-1709.
Stern, N. and Taylor, C. (2010): What do the Appendices to the Copenhagen Accord tell us about global
greenhouse gas emissions and the prospects for avoiding a rise in global average temperature of more
than 2°C? Nairobi, Kenya, UNEP / Grantham Research Institution Climate Change and the Environment:
26.http://www.unep.org/PDF/PressReleases/Accord_targets_paper.pdf
26You can also read