Seabird captures during the FMA 1 bottom longline fishery in the 2017/18 fishing year: comparison of electronic monitoring, observer, and audit data
←
→
Page content transcription
If your browser does not render page correctly, please read the page content below
Seabird captures during the FMA 1
bottom longline fishery in the 2017/18
fishing year: comparison of electronic
monitoring, observer, and audit data
New Zealand Aquatic Environment and Biodiversity Report No. 251

       A. McKenzie

ISSN 1179-6480 (online)
ISBN 978-1-99-004352-9 (online)

January 2021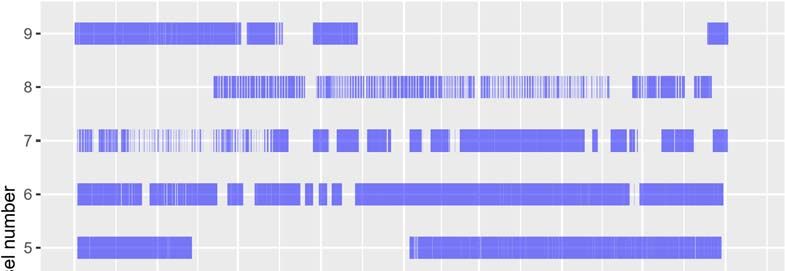
Requests for further copies should be directed to:

Publications Logistics Officer
Ministry for Primary Industries
PO Box 2526
WELLINGTON 6140

Email: brand@mpi.govt.nz
Telephone: 0800 00 83 33
Facsimile: 04-894 0300

This publication is also available on the Ministry for Primary Industries websites at:
http://www.mpi.govt.nz/news-and-resources/publications
http://fs.fish.govt.nz go to Document library/Research reports

© Crown Copyright – Fisheries New Zealand
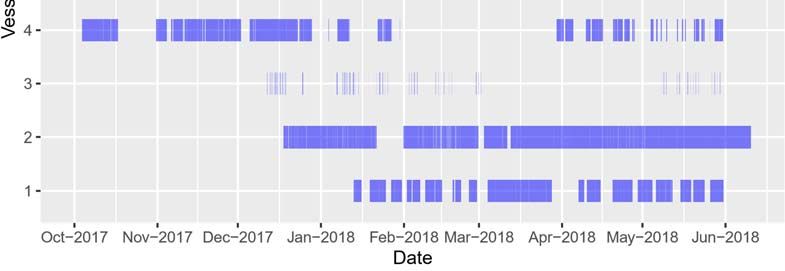
TABLE OF CONTENTS

EXECUTIVE SUMMARY                                                      1

1.      INTRODUCTION                                                   2

2.       METHODS                                                       3
     2.1    NIWA audited EM data                                       4
     2.2    Trident Systems review of electronic monitoring data       4
        EM trip review data                                            4
        EM capture data                                                7
     2.3    Observer data                                              8
        The data set                                                   8
        Event dates and seabird capture time                           8

3.       RESULTS                                                        8
     3.1    Representativeness of EM and observer data                  8
        Trident EM data                                                 8
        Observer data                                                  10
     3.2    Species identification: Trident reviewers and DOC expert   11
     3.3    Comparison of NIWA audit and EM data                       12
     3.4    Comparison of observer data and EM data                    13
        Date, vessel, and time for seabird capture                     17
        Capture rates: EM versus observer data                         20
        Capture rates: EM data (observed versus unobserved)            21
     3.5    Exploring camera footage continuity                        21

4.      DISCUSSION                                                     27

5.      MANAGEMENT IMPLICATIONS                                        27

6.      ACKNOWLEDGMENTS                                                28

7.      REFERENCES                                                     28

8.      APPENDIX 1: Selection of trips for auditing                    29
EXECUTIVE SUMMARY McKenzie, A. (2021). Seabird captures during the FMA 1 bottom longline fishery in the 2017/18 fishing year: comparison of electronic monitoring, observer, and audit data. New Zealand Aquatic Environment and Biodiversity Report No. 251. 30 p. Electronic monitoring for seabird capture data for the 2017/18 fishing year were compared with a NIWA audit of the footage and observer data. The purpose of these comparisons was to evaluate the efficacy of the electronic monitoring to detect seabird captures, and to identify to species level the birds caught. The NIWA audit consisted of a random selection of 27 trips, although it was subsequently established that one of these trips had not been reviewed by Trident Systems. For the 26 trips in common, the NIWA audit recorded five seabird captures, as did the electronic monitoring reviewed by Trident Systems. However, the NIWA audit missed one seabird capture (that was recorded in the electronic monitoring), and the electronic monitoring missed one seabird capture (that was recorded in the NIWA audit). One of the seabirds in the NIWA audit was identified to the more general “albatross” level instead of species level due to difficulties seeing the bird clearly on the camera. For the observer data on trips with reviewed electronic monitoring, five seabird captures were recorded, the same number as electronic monitoring for these trips. All species identifications were the same, except for one capture that was released quickly during a period when there was water on the camera. For trips that had both electronic monitoring and an observer, the seabird capture rate per 1000 hooks was 0.057 (95% confidence intervals of 0.019, 0.130). This is about 50% more than the rate for unobserved electronic monitored trips of 0.037 (0.027, 0.050); however, the difference is statistically insignificant. Fisheries New Zealand Seabird captures for FMA1 bottom longline fishery in 2017/18 1
1. INTRODUCTION
This research sits within the draft Electronic Monitoring of Seabird Captures project plan developed by
the Ministry for Primary Industries in 2016 (now held by Fisheries New Zealand), specifically
addressing workstreams 2 and 5 of the plan.
The purpose of the project was to assess the utility of cameras, deployed on fishing vessels, to detect
captures of both live and dead seabirds during all seabird interaction events and to identify captured
seabirds to species level. Electronic monitoring (EM) of fishing activity and seabird captures has been
carried out in FMA 1 (Figure 1), within the bottom longline (BLL) fishery targeting snapper (SNA) and
bluenose (BNS).
Overall, the project consisted of five work streams: 1. Video observation — approximately 50% of trips
by participating vessels were reviewed by Trident Systems; 2. Auditing of Trident Systems’ video
observation — a random selection of footage from workstream 1 (approximately 10%) was reviewed
independently; 3. In situ human observation — observers identified seabird captures in the SNA 1 and
BNS 1 BLL fisheries; 4. Verification of seabird identifications seabird identifications from captures
and interactions across workstreams 1–3 were confirmed independently; and 5. Data analyses and
reporting.
Objectives (data analyses and reporting):
a. the relative detection rates of seabird captures by human and video observation;
b. the ability for human and video observers to identify captured seabirds to species;
c. the impact of human observers on the detection of captures by video observers; and
d. the representativeness of the coverage achieved by human and video observation.
Statistical analyses were conducted to determine detection rates obtained by human versus video
observations, assessing for statistically significant differences in detection rates across all species, with
a focus on black petrels (Procellaria parkinsoni) and flesh-footed shearwaters (Puffinus carneipes). A
sub-objective was a power analysis to assess the effect of sample size (true number of seabird captures)
on the ability to obtain a statistical difference in detection rate, although this was replaced with
alternative analyses (see below).
After discussions with Fisheries New Zealand, the focus of the analyses was modified:
(1) drop the power analysis;
(2) investigate the prevalence of camera failure, and the impact this has on estimated seabird
capture rates;
(3) compare initial EM reviewer species identification to that of the Department of Conservation
(DOC) expert (who gives the final identification);
(4) compare/combine seabird captures with results from previous analysis.
The overall objective is to provide audit services and comparative analysis of the various data collected
from the 2017/18 trial of EM in the FMA 1 BLL fisheries. A previous set of analyses looked at the
2016/17 trial of electronic monitoring for the same fishery (McKenzie 2019).
For a global review on the use of electronic monitoring in fisheries see van Helmond et al. (2020), and
for a review with a similar scope but concentrating more on New Zealand commercial fisheries see
Pierre (2018). Although there is a comprehensive literature, much of it involving trials, there is much
less literature on the use of EM to monitor seabird captures. For example, a review by Wallace et al.
(2013) found that of fifty-nine reported EM trials, only two of these involved seabird interactions.
2 Seabird captures for FMA1 bottom longline fishery in 2017/18 Fisheries New Zealand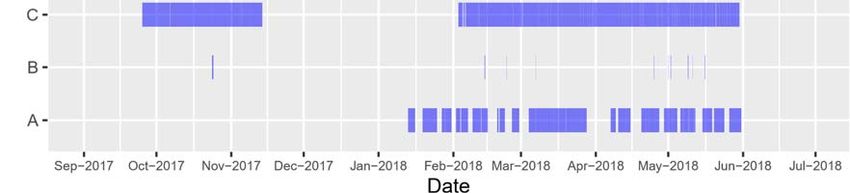
For seabirds in the Hauraki Gulf, the most pertinent previous trials are those involving small bottom longline vessels. An early trial of EM for the longline fishery in New Zealand was reported upon by McElderry et al. (2008). This was a pilot study to assess the effectiveness of EM for protected species interactions and involved two pelagic and two demersal longline vessels. For hooked seabirds, there was one black petrel outside the EM camera view, and one black petrel within EM camera view and detected. A more recent trial evaluated the efficiency of EM to detect black petrel proxy birds for a single inshore bottom longline vessel operating in the Hauraki Gulf (Middleton 2016). It found that the detectability of the seabird proxies ranged from 89% (single primary reviewer) to 94% (multiple reviewers). During the 2016/17 trial comparing EM and observer seabird captures, there was a very good match for the number of seabird captures and species identification, except for one seabird capture missed by EM due to camera failure (McKenzie 2019). For this same fishery, modelling work indicated that the presence of onboard cameras doubles the fisher-reported rate of seabird captures (Tremblay- Boyer & Abraham 2020). Figure 1: The Statistical Areas that define the FMA 1 QMA. 2. METHODS In this section, the NIWA audit data, EM data collected and reviewed by Trident Systems, and observer data are described. The representativeness of the EM and observer data for the FMA 1 BLL fishery was evaluated. For the time periods where the EM data overlapped with these other data, counts and identifications for seabird captures were compared. For the EM and observer data, seabird capture rates were calculated and compared. For just the EM data, capture rates between observed and unobserved trips were compared. Fisheries New Zealand Seabird captures for FMA1 bottom longline fishery in 2017/18 3
2.1 NIWA audited EM data
An audit of Trident Systems-reviewed electronic monitoring footage was undertaken by NIWA. This
audit was of a random selection of 10% of the observed trips and 10% of the unobserved trips, with a
spread across vessels in both cases (Appendix 1). The total number of trips selected for auditing was
27, although this was later found to include one trip which had been erroneously labelled by Trident
Systems as having been reviewed, when it had not.
The audit followed the protocols outlined in Annexure 4 of Fisheries New Zealand’s draft Electronic
Monitoring of Seabird Captures project plan, using the Trident Systems’ ‘Fisheye’ dashboard. All
(100%) of the audit footage was audited and seabird captures identified (species and fate). One of the
seabirds in the audit was identified as “albatross” instead of by species due to difficulties seeing the
bird clearly on the camera.
2.2 Trident Systems review of electronic monitoring data
The data set from Trident Systems (hereafter referred to as ‘Trident’) was for reviewed EM footage
from 1 October 2017 to 31 May 2018. There were two associated data sets:
(i) records for EM time slices reviewed by Trident (“trip reviews”), and
(ii) capture records for protected species.
These data sets are discussed in the next two sections.
EM trip review data
Trident delineated “trips” as time slices that are a port-port trip but can also include periods in port
without footage (David Middleton, Trident Systems, pers. comm.). These “trips” were labelled with a
Trident trip identification number which is unrelated to the trip identification numbers used by the
warehou commercial catch-effort and observer databases. The Trident data included vessel names and
“trip” dates, which enabled matching with warehou and observer data. Protected species captures from
the Trident data had a timestamp, which was not in the observer database and had to be extracted from
observer notebooks. For ease of terminology, for the rest of this document we will refer to EM time
slices as trips.
The records for reviewed EM time slices covered 02 October 2017 through to 31 May 2018. A total of
256 unique trips were reviewed, ten of these had at least two Trident reviews for quality control
(Table 1). Duplicate trips were dropped, just the first review record for a trip was retained, with
subsequent reviews used for quality control.
For each Trident trip record, the total number of hooks set was used as a measure of effort. This was
determined by linking to the warehou catch-effort data, using the vessel name and trip dates. For 4% of
the Trident trips which had hauling events, there were no linked catch-effort data (possibly the effort
was reported, but with the wrong date), and they were dropped. This left 191 trip records for which 52
records were for a vessel sitting in port.
The temporal coverage of the reviewed EM footage, including time slices where a vessel was in port,
is shown in Figure 2. Temporal coverage for reviewed time slices where fishing activity occurred is
shown in Figure 3, which is overlaid with haul start times from linked catch-effort records (Figure 4).
Most time slices with fishing activity are less than five days, with the time slices longer than ten days
most likely including some time in port as well as fishing activity (Figure 5). For the time slices longer
than ten days, no extra effort (number of hooks) were allocated to the “trip”, and the matched observer
data will still be in the appropriate trip.
4 Seabird captures for FMA1 bottom longline fishery in 2017/18 Fisheries New Zealand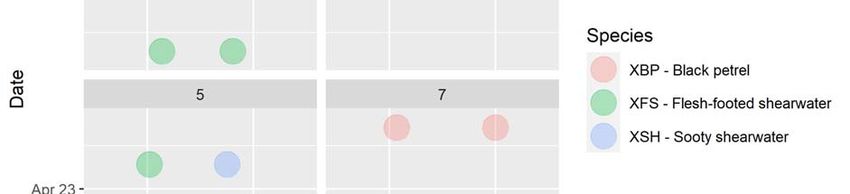
Table 1: Reviewed trips EM that received multiple reviews as part of quality control. The table entries are
the number of reviews.
Trip ID Trip reviewer ID Sum
14 33 38 67
1133842 1 1 0 0 2
1133843 1 0 1 0 2
1133872 1 0 1 0 2
1133875 1 0 1 0 2
1133876 1 0 1 0 2
1133882 1 0 1 0 2
1134376 0 1 1 0 2
1134481 0 1 0 1 2
1134860 0 1 1 0 2
1134865 0 1 1 0 2
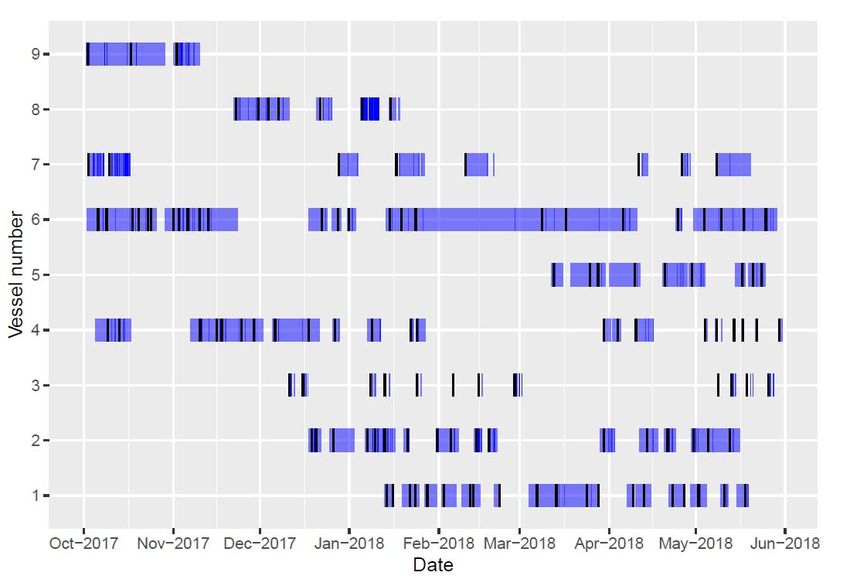
Figure 2: Period covered by the Trident reviewed EM data, by vessels assigned numerical labels. Trips are
shaded blue from their start to end dates, with vertical black lines denoting the start date for trips.
Trips include time slices where a vessel is sitting in port without fishing.
Fisheries New Zealand Seabird captures for FMA1 bottom longline fishery in 2017/18 5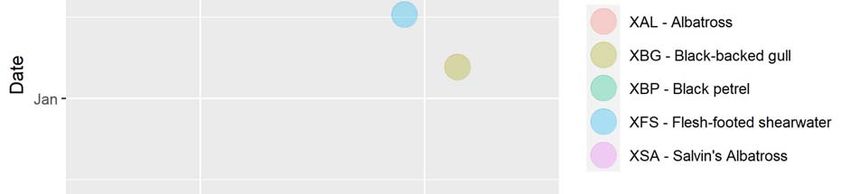
Figure 3: Period covered by the Trident reviewed EM data, for time slices with fishing, by vessels assigned
numerical labels. Trips are shaded blue from their start to end dates, with vertical black lines
denoting the start date for trips. Unlike Figure 2, time slices with no fishing are removed.
Figure 4: Trident reviewed EM footage for fishing trip events (blue shading) overlaid with haul start time
for catch-effort records for the same vessels (red vertical lines).
6 Seabird captures for FMA1 bottom longline fishery in 2017/18 Fisheries New ZealandFigure 5: Length of Trident reviewed slices with fishing. Vessels are given numeric labels. The red dot
shows the mean length of a trip for a vessel.
EM capture data
An important point is that there were two stages to seabird species identification for the Trident captures
data. The first stage was the identification of a seabird capture event and preliminary species
identification by a Trident reviewer. In the second stage, Trident seabird capture events were reviewed
by a DOC expert to give the final species identification.
The initial capture data set contained both John dory and seabird captures, referred to here as animal
captures. There was a record for each animal capture event, with the date and time of capture given,
and contained 107 records. For nearly all the animal capture events records, only a single animal was
caught, except for one record where two animals were caught and three records where the number was
not given. The record with two animal captures was replicated so that each record represents the capture
of a single animal, and where the number of animals were not given it was assumed to be one.
Records dropped from the analysis included five records for John dory which had been used as a proxy
species in the 2016/17 reviewing and was also recorded in some 2017/18 reviews, the 47 Trident
reviewer records, and the 6 NIWA audit capture records. The only records retained for comparison to
the audit and observer data were the DOC expert seabird capture identification records (50 records)
which were to species level, unlike the Trident reviewers’ identifications which were not all to species
level.
Some points on the DOC expert reviews (David Middleton, Trident, pers. comm):
1. The DOC expert reviewed short slices (five minutes either side of a Trident-identified
capture) not whole trips.
2. There may be some Trident captures for which the DOC expert had not yet been asked to
give an identification. However, for all capture events in the received data set there was a DOC
expert identification.
Fisheries New Zealand Seabird captures for FMA1 bottom longline fishery in 2017/18 72.3 Observer data
The data set
Observers were put on vessels both with and without EM, and Trident tried to ensure that EM footage
with observers was prioritised for review (David Middleton, Trident, pers. comm.).
Observer data were requested for events that started or ended in FMA 1, using fishing method ‘bottom
long lining’, from the dates 1 October 2017 to 31 May 2018 (i.e., the 2017/18 fishing year). This data
set had 162 records, each of these corresponding to a fishing set.
A record with the wrong observation date for a seabird capture was corrected (trip number 5305 with
the incorrect date of 10 April 2018 instead of the correct date of 17 April 2018). Another seabird capture
for the same trip, and on 17 April, was missing the date and time of observation, which were filled in
using the EM data (assuming it was the same seabird).
Event dates and seabird capture time
Time of seabird capture is no longer recorded in observer data. This contrasts with the Trident EM data
for which a capture time is recorded.
For 2017/18, observer data were recorded on paper forms, with the electronic records yet to be used.
For these data the observer fields event_end_date and event_end_time denote the start of hauling and
were used to place an observer event in time. The end of hauling date and time were not recorded on
the paper forms.
For seabird capture events, archived observer notebook data were used to obtain the date and time of a
seabird capture event.
3. RESULTS
Firstly, representativeness of the EM and observer data was looked at. Following this species
identifications were compared between the Trident EM reviewer and that given by the DOC expert. The
next sections compare the NIWA audit to EM, and observer data to EM.
3.1 Representativeness of EM and observer data
Trident EM data
Participation in the EM trial was voluntary. Vessels included in the trial were not chosen to be
representative of the fishery but were selected by Fisheries New Zealand and Trident, based on:
• Participation in the FMA 1 SNA and BNS target fisheries (i.e., favouring vessels with the
highest levels of effort in these fisheries).
• Overlap of the vessel’s previous effort with the best available information on black petrel
distribution in the period of the trial.
The number of hooks was used as the measure of effort, and representativeness was evaluated with
respect to the relative spread of the number of hooks by month/area.
The Trident reviewed EM fishing trip effort covered 16% of the fishery effort. Relative to the fishery,
proportionally there was less EM effort for fishing events in December and more in January and
February (Figure 6). Relative to the fishery, proportionally there was less EM effort for fishing events
8 Seabird captures for FMA1 bottom longline fishery in 2017/18 Fisheries New Zealandin Statistical Areas 002 and 008, and more in 005, 006, 007, and 009 (Figure 7, see Figure 1 for the
Statistical Areas).
Figure 6: Percent of hook numbers by month (for data restricted to 1 October 2017 through to 31 May
2018). Comparison of catch-effort data and reviewed EM data.
Figure 7: Percent of hook numbers by area (for data restricted to 1 October 2017 through to 31 May 2018).
Comparison of catch-effort data and reviewed EM data. Areas shown here represent Statistical
Areas 001–010, 106, and 107.
Fisheries New Zealand Seabird captures for FMA1 bottom longline fishery in 2017/18 9Observer data
The observer effort covers 4% of the fishery effort. Relative to the fishery effort, proportionally there
is more observer effort in November and December, less in January and February, and none in May
(Figure 8). Relative to the fishery effort, proportionally there is more observer effort in Statistical Areas
003 and 009, and less in 006 and 008 (Figure 9, see Figure 1 for the Statistical Areas).
Figure 8: Percent of hook numbers by month (for data restricted to 1 October 2017 to 31 May 2018).
Comparison of catch-effort data and observer data.
Figure 9: Percent of hook numbers by month (for data restricted to 1 October 2017 to 31 May 2018).
Comparison of catch-effort data and observer data. Areas shown here represent Statistical Areas
001–010, 106, and 107.
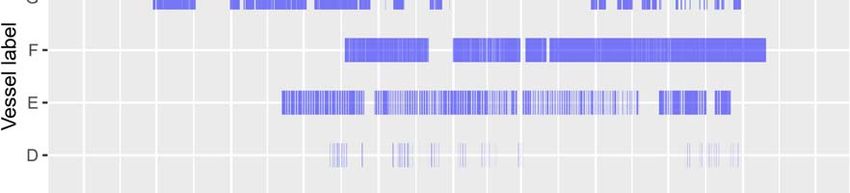
10 Seabird captures for FMA1 bottom longline fishery in 2017/18 Fisheries New Zealand3.2 Species identification: Trident reviewers and DOC expert
To reiterate, there are two stages to seabird species identification for the Trident capture data. The first
stage is the identification of a seabird capture event and preliminary species identification by a Trident
reviewer. In the second stage, Trident seabird capture events are reviewed by a DOC expert to give the
final species identification.
The final species identification is visually compared with the preliminary identification in Figure 10.
As is apparent from the figure, the preliminary species identification is more often at the non-species
level (e.g., XSB Seabird), with flesh-footed shearwater apparently more difficult to identify (Table 2).
Although the DOC expert identified three birds at the non-species level of XSB (Seabird), for one of
these identifications the associated comment by the DOC expert gives the identification as black petrel,
and there may have been difficulties remembering the three letter codes (David Middleton, Trident,
pers. comm.).
Figure 10: Day of seabird capture by vessel for DOC expert and EM reviewer. The points are jittered
horizontally.
Fisheries New Zealand Seabird captures for FMA1 bottom longline fishery in 2017/18 11Table 2: Comparison of species identification by DOC expert and EM reviewer preliminary identification.
Species DOC expert EM reviewer
XBP - Black petrel 8 6
XCP - Cape Pigeon 0 1
XFS - Flesh-footed shearwater 37 15
XPE - Petrel (Unidentified) 0 3
XSA - Salvin's Albatross 1 0
XSB - Seabird 3 18
XSS - Seabird Small 0 3
XSW - Sooty Shearwater 1 0
XWM - New Zealand white capped albatross 0 1
Sum 50 47
3.3 Comparison of NIWA audit and EM data
The number of seabird captures recorded is the same in the NIWA audit compared with the Trident
review (five seabirds), but with differences in both species identifications and the trips for which seabird
captures were recorded (Tables 3–4, Figures 11–12).
For vessel 6 on 7 January 2018, there was a black-backed gull (Larus dominicanus) recorded in the
NIWA audit, but not in the EM capture data. The trip (1134654) is in the EM review data, but there is
no associated capture record, and it is a missed capture in the EM. A comment from the NIWA audit
noted that it was very difficult to identify the bird because the camera imagery was not clear, and that
the bird appeared to be retained on board.
For vessel 3 on 2 March 2018, there was a black petrel recorded as an EM capture, but not in the NIWA
audit.
For vessel 9 on 19 October 2017, there was an albatross recorded in the NIWA audit, and a Salvin’s
albatross (Thalassarche salvini) in the EM capture data. The comment by the NIWA auditor was “Very
difficult to ID accurately, sun glare and not shown to camera. Small (Thalassarche) albatross, possibly
northern Buller’s.”
In summary, the NIWA audit missed one seabird capture, and one identification was to the more general
“albatross” instead of species level due to difficulties seeing the bird clearly on the camera imagery.
The EM reviews missed a seabird capture (see Tables 3–4).
An additional trip 1134359 was reviewed as part of the NIWA audit; this was not, in fact, reviewed by
Trident. This trip identified a further capture of a flesh-footed shearwater by vessel 2 on 17 January
2018.
Table 3: Number of seabird captures by species.
Doc Expert NIWA audit
XAL - Albatross 0 1
XBG - Black-backed gull 0 1
XBP - Black petrel 3 2
XFS - Flesh-footed shearwater 1 2*
XSA - Salvin’s albatross 1 0
Sum 5 6
* Includes one bird from a trip not reviewed by Trident.
12 Seabird captures for FMA1 bottom longline fishery in 2017/18 Fisheries New ZealandTable 4: Number of seabird captures by trip identifier.
Doc Expert NIWA audit
1133857 2 2
1134359 0 1*
1134585 1 0
1134654 0 1
1134689 2 2
Sum 5 6
* Includes one bird from a trip not reviewed by Trident.
3.4 Comparison of observer data and EM data
For comparison of seabird captures with EM, the observer data were reduced to those for vessels with
reviewed EM footage (Tables 5–6). This reduced data set covers the period 07 October 2017 to 28 April
2018.
Table 5: Summary of amount of observer data, before and after restricting the observer data to vessels
with reviewed EM footage.
All vessels Vessels with reviewed EM
Number of vessels 15 6
Number of trips 16 6
Number of sets 162 60
Number of seabird captures 9 6
Table 6: Number of observed sets for vessels with reviewed EM footage.
Vessel number label Number of observed sets
1 11
2 16
4 8
5 9
7 3
9 13
Sum 60
The distribution of haul start dates for observer records is shown in Figure 13. This is superimposed
upon the temporal coverage for the reviewed EM time slices with fishing event in Figure 14.
For seabird capture comparison purposes, observer records were restricted to those for which the record
occurred within the time frame of a reviewed EM time slice with fishing activity (using the observer
event_end date and time). Reviewed EM time slices with fishing were restricted to those with an
observer record (Figure 15). These restrictions resulted in 31 observer events (from 60) and 14 reviewed
EM time slices with fishing (from 139).
For the observer data five seabird captures were recorded, and for the associated electronic monitoring
data five seabird captures were also detected.
Fisheries New Zealand Seabird captures for FMA1 bottom longline fishery in 2017/18 13Figure 11: Day of recorded seabird captures for EM and NIWA audit data. The points are jittered
horizontally.
14 Seabird captures for FMA1 bottom longline fishery in 2017/18 Fisheries New ZealandFigure 12: Day of recorded seabird captures for EM and NIWA audit data, by vessel. The points are jittered
horizontally.
Fisheries New Zealand Seabird captures for FMA1 bottom longline fishery in 2017/18 15Figure 13: Haul start dates for observer records with seabird events by vessel. This is for observer records
that had reviewed EM footage.
Figure 14: Trident reviewed EM footage for time slices with fishing (blue shading) overlaid with the haul
start dates for observer records (red vertical lines), by vessel.
16 Seabird captures for FMA1 bottom longline fishery in 2017/18 Fisheries New ZealandFigure 15: Trident reviewed EM footage for time slices with fishing (blue shading) overlaid with the haul
start dates for observer records (red vertical lines), by vessel.
Date, vessel, and time for seabird capture
The date and vessel for the five seabird captures match for reviewed EM data and observer data
(Figures 16–17). Species identifications matched, except for vessel 5 on 25 April 2018, for which the
DOC expert identified the bird as a flesh-footed shearwater, and the observer reported it as a sooty
shearwater (Puffinus griseus). This seabird identification was difficult, due to the short time available
to sight the bird, as comments attest:
1. Doc expert. “ID difficult due to water on camera, bird caught on haul, never brought on deck,
hook removed with bird on side of the boat and returned to sea, never held to camera.”
2. Observer. “XSH attacked baited hook on hauling was released within seconds of capture, no
visible injuries”
The difference in recorded seabird capture times are shown in Figure 18. These match except for the
record on 28 April 2018 from vessel 7, for which the time difference is apparently more than 300
minutes. The observer record for this event has the comment (with some editing for clarity): “Observer
off duty, vessel followed camera protocol and released the bird uninjured. Caught in rough weather
(Beaufort 6)”.
Observers may record a different day for a bird capture if the day was recorded as when a set was put
down instead of hauled (David Middleton, Trident, pers. comm.). However, because archived observer
notebook date and time were available this was not a problem in practice.
In summary, there was a good match between the observer and EM data for the number and
identification of species. There was a difference for one bird identification, for a capture released
quickly during a period when there was water on the camera lens.
Fisheries New Zealand Seabird captures for FMA1 bottom longline fishery in 2017/18 17Figure 16: Day of seabird captures for EM and observer data. The points are jittered horizontally. 18 Seabird captures for FMA1 bottom longline fishery in 2017/18 Fisheries New Zealand
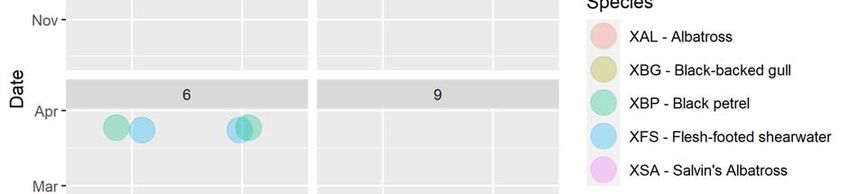
Figure 17: Day of seabird captures by vessel for EM and observer data. The panels are labelled by vessel
number, and the points are jittered horizontally.
Fisheries New Zealand Seabird captures for FMA1 bottom longline fishery in 2017/18 19Figure 18: Difference in recorded capture time (EM - observer) for capture records on the same vessel and
the same date.
Capture rates: EM versus observer data
Confidence intervals for seabird captures rates were calculated using the binom.test function from the
R stats package with the “exact” method, which tends to produce conservatively sized intervals (i.e.,
larger than some other methods). The unit of sampling was taken to be 1000 hooks.
Capture rates for the total number of seabird captures, for the EM and observer data restricted to trips
in common, are shown in Table 7. The observed and EM capture rates are identical (to two significant
figures).
Raw total number of seabirds capture rate was calculated using all the EM and observer data (not
restricted to trips in common). The capture rate for the EM data was about 50% more than for the
observer data, though there was considerable overlap in the confidence intervals (Table 8). Note that
capture rates can differ depending on, for example, months sampled (i.e., capture events are more
common in certain months). So it is not unexpected for the EM and observer capture rates (based on
the full sets of data) to differ, compared with when their data were restricted to trips in common.
Capture rates for black petrel and flesh-footed shearwater captures, for the EM and observer data
restricted to trips in common, are shown in Table 9. The capture rate for black petrel is the same for
EM and observer data and 0.011 (95% confidence intervals of 0.000, 0.062) per thousand hooks. For
flesh-footed shearwater the capture rate per thousand hooks is 0.046 (EM) or 0.034 (observer) but
confidence intervals are large, and the difference is not statistically significant.
Table 7: Comparison of seabird capture rates (all birds) for EM and observer data for fishing trips that
are in common, with 95% CIs.
Num seabirds 1000s hooks Rate per 1000 hks Low CI High CI
EM 5 87 0.057 0.019 0.129
Observed 5 88 0.057 0.019 0.128
20 Seabird captures for FMA1 bottom longline fishery in 2017/18 Fisheries New ZealandTable 8: Comparison of seabird capture rates (all birds) for EM times slices with fishing and all available
observer data, with 95% CIs.
Num seabirds 1000s hooks Rate per 1000 hks Low CI High CI
EM 50 1291 0.039 0.029 0.051
Observed 9 337 0.027 0.012 0.050
Table 9: Comparison of black petrel and flesh-footed shearwater capture rates for EM and observer data
for fishing trips that are in common, with 95% CIs.
Num seabirds 1000s hooks Rate per 1000 hks Low CI High CI
Black petrel
EM 1 87 0.011 0.000 0.062
Observed 1 88 0.011 0.000 0.062
Flesh-footed shearwater
EM 4 87 0.046 0.013 0.114
Observed 3 88 0.034 0.007 0.096
Capture rates: EM data (observed versus unobserved)
Reviewed EM trips with fishing were taken to be observed if there was an observer record within their
time frame, with other trips taken to be unobserved. This gave 14 observed fishing trips with 5 seabird
captures, and 177 unobserved fishing trips with 45 seabird captures (Table 10).
Using the number of hooks as a measure of effort, this corresponds to a seabird capture rate for observed
trips of 0.058 per 1000 hooks, and 0.037 per 1000 hooks for unobserved trips (see Table 10). The
observed capture rate is about 70% of the rate reported for the observed SNA 1 BLL fishery (Middleton
et al. 2016, p. 10) and about 50% more than the unobserved capture rate of 0.037 per 1000 hooks.
However, the observed and unobserved capture rate values are statistically indistinguishable (p-value
of 0.51 for a two-sided test using the prop.test function from the R stats package).
Table 10: Seabird capture rates (all birds) for observed and unobserved reviewed EM times slices with
fishing, with 95% confidence intervals (CIs).
Num trips Num seabirds 1000s hooks Rate per 1000 hks Low CI High CI
Observed 14 5 87 0.057 0.019 0.130
Unobserved 177 45 1204 0.037 0.027 0.050
3.5 Exploring camera footage continuity
Camera operation data were received from David Middleton (Trident). Each row of data represents a
continuous segment of camera operation for a vessel. For this data set, a gap of more than five minutes
for camera operation constituted the definition of a new segment of data. The number and continuity of
footage segments varied substantially between vessels (Table 11, Figure 19). Median value for length
of footage segments by vessels varied from less than five minutes to two days (Figures 20–21). Most
vessel trips will be less than five days in duration, with many around a day or two in length (see
Figure 5).
Columns for the data included vessel and segment start/end date-time; however, there was no column
for the trip identification. Assigning a trip identification is not straightforward because trip start/end
times are not forced to fall at the boundaries between footage segments, so there is no guarantee that
there is a 1:1 relationship (David Middleton, Trident, pers. comm.). No trip identification for a segment
makes it difficult to determine the percentage of trip time for which a camera is operating, because it is
not known which trip a footage segment belongs to.
Fisheries New Zealand Seabird captures for FMA1 bottom longline fishery in 2017/18 21Table 11: Number of footage segments by vessel label.
Vessel Number of
label footage segments
A 47
B 15
C 187
D 200
E 1 887
F 315
G 144
H 93
I 323
J 2 215
Sum 5 426
In lieu of there being a trip identification field in the data, trips were inferred from the EM review data
which have Trident assigned trip identifications for reviewed EM trips (see Figure 2). To align with the
vessels and dates in the EM review data, the vessel labelled “B” with 15 footage segments was dropped,
and only footage segments that lay partially or wholly within 1 October 2017 to 31 May 2018 were
used. This alignment reduced the number of footage segments slightly from 5426 to 5407. Relabelling
the vessels to match with the labelling for EM review data, and restricting the footage segment
temporally, gave the footage segment spreads in Figure 22.
As camera footage continuity is more critical during fishing activity than sitting in port, trips are inferred
for segments for which fishing took place (see Figure 3), and the rest of the segments were not used. A
footage segment is given the trip identification of a reviewed EM fishing trip if the segment is wholly
or partially within the time interval of the trip. The footage segments with reviewed EM fishing trips
are shown in Figure 23, and these footage segments were used in subsequent analyses.
For a trip, the trip interval is inferred from the associated footage segments, as the difference between
the maximum and minimum datetimes for these. The percentage of a trip interval covered by footage
segments was calculated by summing up the footage segment lengths with that trip label, dividing by
the inferred trip interval, then multiplying by 100.
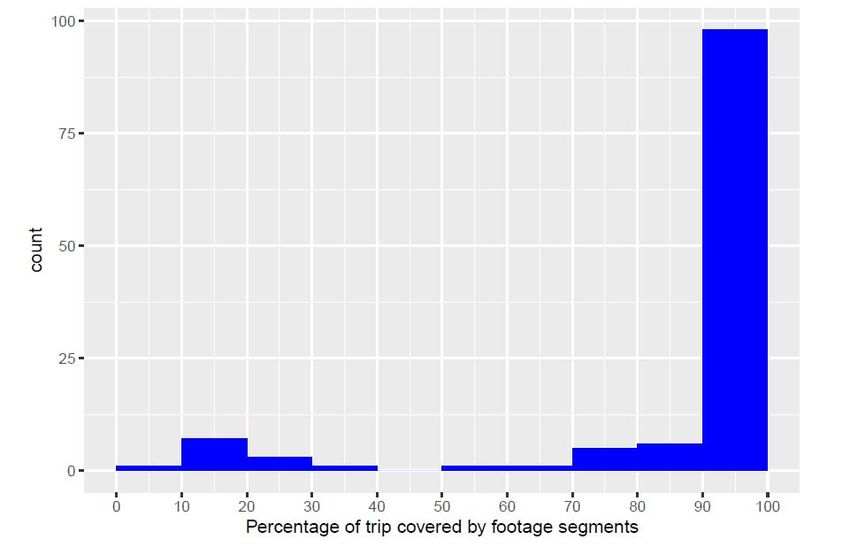
Except for vessels 3 and 8, for most trips and vessels the percentage was greater than 90% (Figures 24–
25). This may indicate problematic footage continuity for vessel 3 and 8, or perhaps difficulties in
assigning trip labels to footage segments for them. Overall, 20% of the trips have less than 90% of the
trip interval covered by footage segments. Over all trips and vessels, the percentage of the trip interval
covered by footage segments is 94%. Assuming uniformity of seabird captures across the reviewed
video footage with fishing activity, this indicates that at worst 1 in 20 seabird captures may be missed.
An important caveat is that the inferred trip interval may include periods of non-fishing activity at night,
or powering down of the boat between hauls, for which footage coverage is unimportant. Dropping
these non-fishing periods would make the calculated percentages for footage coverage higher.
Preferably footage coverage continuity would be analysed just for periods of hauling activity, however
for 2017/18 only the haul start datetime is recorded with paper records, not the haul end datetime. In
2019/20 electronic recording for catch-effort is used, and haul start datetime and end datetime are
recorded, allowing routine reporting of EM footage coverage for hauls (David Middleton, Trident, pers.
comm.).
22 Seabird captures for FMA1 bottom longline fishery in 2017/18 Fisheries New ZealandFigure 19: Time period covered by footage segments, by vessel. Footage segments are shaded blue from
their start to end dates.
Figure 20: Length of footage segments (log scale), by vessel. The footage segment length values are jittered
vertically.
Fisheries New Zealand Seabird captures for FMA1 bottom longline fishery in 2017/18 23Figure 21: Boxplot for the length of footage segments (log scale), by vessel. The central rectangle of the
boxplots has horizontal lines (from bottom to top) at the quartiles: 25% (lower quartile), 50%
(median), and 75% (upper quartile). The interquartile range (IQR) is equal to the upper quartile
minus the lower quartile. The upper whisker extends to the largest value no further than the upper
quartile + 1.5*IQR; the lower whisker extends to the smallest value greater than the lower quartile
- 1.5*IQR. Values beyond the whiskers are denoted by solid circles.
24 Seabird captures for FMA1 bottom longline fishery in 2017/18 Fisheries New ZealandFigure 22: Period covered by footage segments, by vessels which are given the same numeric labels as the
EM reviews. Footage segments are shaded blue from their start to end dates. The vessel labelled
“B” in Figure 19 is dropped.
Figure 23: Period covered by footage segments that are part of EM reviewed footage segments containing
fishing activity, by vessel number. Footage segments are shaded blue from their start to end dates,
with black vertical lines denoting the start of a trip.
Fisheries New Zealand Seabird captures for FMA1 bottom longline fishery in 2017/18 25Figure 24: Percentage of a trip interval covered by footage segments, by vessel number. Each brown dot
represents an individual trip.
Figure 25: Distribution for the percentage of a trip covered by footage segments.
26 Seabird captures for FMA1 bottom longline fishery in 2017/18 Fisheries New Zealand4. DISCUSSION The NIWA audit of 26 trips with Trident reviewed EM recorded five seabird captures, the same number as the reviewed EM. However, the NIWA audit missed one seabird capture (that was recorded in the reviewed EM), and the reviewed EM missed one seabird capture (that was recorded in the NIWA audit). This illustrates that even for trained reviewers, a rare event such as a seabird capture can be missed. One of the seabirds in the NIWA audit was identified to the more general “albatross” level instead of species level due to difficulties seeing the bird clearly on the camera. Where a seabird capture could be clearly seen by both the NIWA audit and the reviewed EM, then the same species identification was given. In the 2016/17 NIWA audit by the same person a seabird capture was missed, and an extra incorrect capture was recorded, compared with the EM data. For the observer data, five seabird captures were recorded, the same number as the associated EM data. All species identifications were the same, except for one capture that was released quickly during a period when there was water on the camera lens. For both observer and EM, the seabird capture rate per 1000 hooks is 0.057 (95% confidence intervals of 0.019, 0.130). This very good match between observer and EM for seabird captures and identification was also seen for the 2016/17 analyses: for the observer data 12 black petrels were recorded, and for the associated EM data 11 black petrels were detected (a seabird capture was missed during a period of camera failure). For EM trips with observers, the capture rate is 0.057 (0.019, 0.130), which is about 50% more than the capture rate for unobserved EM trips of 0.037 (0.027, 0.050). However, the difference is not statistically significant. Because of the low number of seabird captures, there is much uncertainty in annual seabird capture estimates. For comparison purposes, in the 2016/17 fishing year the seabird capture rate estimates were (a) observed EM trips 0.035 (0.018, 0.062), and (b) unobserved EM trips 0.010 (0.005, 0.018). In the 2016/17 analyses camera breakdown was a significant factor for some seabird captures to be missed in the EM (McKenzie 2019), but this was not a problem for the current set of analyses. Video coverage by EM is not always continuous but covers at least 94% of fishing activity for trips. However, for some vessels video coverage is much less, indicating potential problems with footage continuity, and there should be ongoing monitoring of this. For the data analyses above, some changes to the data sources and documentation would make it easier in the future. The Trident EM is a rich and valuable data source, however there is very little documentation, and data extraction and interpretation is reliant upon personal communication from Trident. For the observer data, the seabird capture time is recorded in archival notebooks but not entered into the observer database as it used to be. Given the ongoing need to compare EM and observer seabird captures, and the likelihood that observers will still be used in the future, then the seabird capture time should be required to be reported with other observer data. Species identification is an important aspect of the data but can sometimes be difficult for a variety of reasons (e.g,. a quick seabird capture and release, water on the camera). However, unless the comments are read for the identification, the quality of the identification is unknown. A useful additional field for species identification would be an identification quality category (e.g., 1 = low, … 5 = high). 5. MANAGEMENT IMPLICATIONS For both the 2016/17 and 2017/18 EM trials, there was a very good match between EM and observers for number of seabird captures and species identification, implying that EM has potential to substitute or supplement observer coverage. Comparisons between the two are informative, because they show how the EM can be improved (e.g., keeping the camera lens clear, maintaining footage continuity during hauling). Fisheries New Zealand Seabird captures for FMA1 bottom longline fishery in 2017/18 27
6. ACKNOWLEDGMENTS
This work was completed under Objective 2 of Fisheries New Zealand project PSB2018-09. Thank you
to William Gibson (Fisheries New Zealand) and David Middleton (Trident Systems) for very useful
comments on an earlier version of this manuscript, and David Thompson (NIWA) for reviewing the
document. Editorial comments by Susan Jane Baird (Fisheries New Zealand) helped to clarify many
parts of the report.
7. REFERENCES
McElderry, H.; Schrader, J.; Anderson, S. (2008). Electronic monitoring to assess protected species
interactions in New Zealand longline fisheries: a pilot study. New Zealand Aquatic Environment
and Biodiversity Report No. 24. 39 p.
McKenzie, A (2019). Seabird captures for FMA 1 BLL fishery: comparing electronic monitoring (EM),
observer, NIWA audit data, and fisher data for the 2017 fishing year. (Unpublished Final Research
Report held by Fisheries New Zealand). 29 p.
Middleton D.A.J.; Guard, D.P.; Orr T.J. (2016). Detecting seabird captures via video observation. Final
report for the Southern Seabird Solutions Trust. (Unpublished final report held by Southern Seabird
Solutions). 27 p.
Pierre, J.P. (2018). Using electronic monitoring imagery to characterise protected species interactions
with commercial fisheries: A primer and review. Final Report prepared by JPEC for the
Conservation Services Programme, Department of Conservation, Wellington. 42 p.
https://www.doc.govt.nz/globalassets/documents/conservation/marine-and-coastal/marine-
conservation-services/reports/int2017-02-final-report-em.pdf.
Tremblay-Boyer, L.; Abraham, E.R. (2020). Increased fisher-reporting of seabird captures during an
electronic monitoring trial. New Zealand Aquatic Environment and Biodiversity Report No. 238.
32 p.
van Helmond A.T.M; Mortensen, L.O.; Plet-Hansen, K.S.; Ulrish, C.; Needle, C.L.; Oesterwind, D.;
Kindt-Larsen, L.; Catchpole, T.; Mangi, S.; Zimmermann, C.; Olesen, H.J.; Baily, N.; Bergsson,
H.; Dalskov, J.; Elson, J.; Hosken, M.; Peterson, L.; McElderry, H.; Ruiz, J.; Pierre, J.P.; Dykstra,
C.; Poos, J.J. (2020). Electronic monitoring in fisheries: lessons from global experiences and future
opportunities. Fish and Fisheries 21(1): 162–189. Doi/10.1111/faf.12425.
Wallace, F.; Faunce, C.; Loefflad, M. (2013). Pressing rewind: A cause for pause on electronic
monitoring in the North Pacific. Presentation paper at the 2013 International Council for the
Exploration of the Sea (ICES) annual conference. Available from Farron.Wallace@noaa.gov.
28 Seabird captures for FMA1 bottom longline fishery in 2017/18 Fisheries New Zealand8. APPENDIX 1: Selection of trips for auditing
A list of video slices (“trips”) reviewed by Trident, along with associated information, was supplied on
6 May 2019 by David Middleton (Trident).
Each row of data represents a unique and single trip (the id column), with:
1. associated vessel id,
2. a logical flag indicating whether the trip was reviewed by Trident or not
3. the number of observed events for the trip
4. a logical flag MPIobserved set to TRUE if the number of observed events is greater than zero
5. a column fma1events for the number of hauls in FMA 1
6. a column nonfma1events for the number of hauls outside FMA 1
Records where fma1events are zero indicate a vessel either remained in port for the time period of the
“trip” or fished outside FMA 1 (David Middleton, pers. comm.).
There were 418 trips in the data, all of which were reviewed by Trident. Of these 315 trips have hauls
in FMA 1 (i.e., fma1events > 0). Trips are filtered keeping only those with hauls in FMA 1. The filtered
trip data set has 9 unique vessels, for which the number of trips for each is given in Table 1.1. There is
a spread of trips over vessels for both observed (TRUE) and unobserved trips (FALSE), though there
are fewer observed trips (Table 1.2). The percentage of trips observed is 7% (23 out of 315).
Table 1.1: Number of trips for potential audit by vessel id.
Vessel id 14 237 254 256 264 267 275 277 285
Number of trips 71 12 37 44 4 66 23 14 44
Table 1.2: Number of trips that are observed (TRUE) and unobserved (FALSE).
Vessel id 14 237 254 256 264 267 275 277 285 Sum
FALSE 71 12 32 39 3 61 23 13 38 292
TRUE 0 0 5 5 1 5 0 1 6 23
Sum 71 12 37 44 4 66 23 14 44 315
The trip selection specification for audit is to randomly select 10% of the observed trips, and 10% of
the unobserved trips, with a spread across the vessels in both cases. The type of vessel spread is
undefined but is taken be in proportion to the number of trips reviewed for a vessel. An additional final
constraint is that there must be at least one trip from each vessel (either observed or unobserved). The
specification to select 10% of the unobserved trips corresponds to 29 trips, and 10% of the observed
trips to 2 trips.
The spread across vessels is achieved by allocating to each vessel a number of trips in proportion to the
number of reviewed trips for the vessel in the data, doing this separately for unobserved and observed
trips. Under this allocation scheme the number of trips for each combination of observed
(FALSE/TRUE) and vessel id is given in Table 1.3. Within each combination of observed or not
(TRUE/FALSE) and vessel id trips are randomly selected without replacement to meet the allocated
number.
The total number of trips to be audited was 31. However, two of these trips in fact had no footage to
review, and for two of trips there were problems playing back the footage, so the final number of trips
audited was 27. Subsequently it was established that one of these audited trips had not been reviewed,
so the total number of audited trips with reviewed EM footage was 26.
Fisheries New Zealand Seabird captures for FMA1 bottom longline fishery in 2017/18 29Table 1.3: Number of trips randomly selected from each vessel, where TRUE is an observed trip, and
FALSE an unobserved trip.
Vessel id 14 237 254 256 264 267 275 277 285 Sum
FALSE 7 1 3 4 1 6 2 1 4 29
TRUE 0 0 1 0 0 0 0 0 1 2
Sum 7 1 4 4 1 6 2 1 5 31
30 Seabird captures for FMA1 bottom longline fishery in 2017/18 Fisheries New ZealandYou can also read


