Second Quarter 2022 Presentation - Oslo, July 21, 2022
←
→
Page content transcription
If your browser does not render page correctly, please read the page content below
Second Quarter 2022 Presentation
Oslo, July 21, 2022

                                   1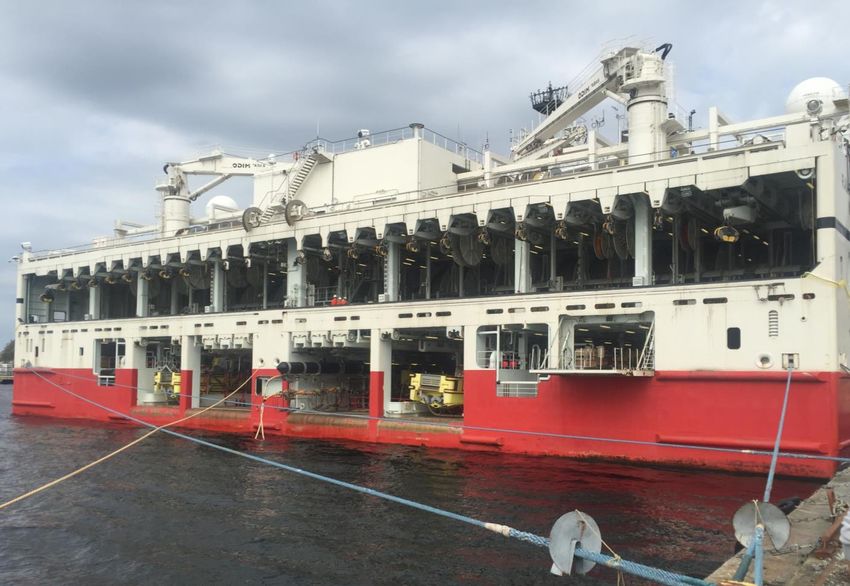
Cautionary Statement

     ▪ This presentation contains forward looking information

     ▪ Forward looking information is based on management
       assumptions and analyses

     ▪ Actual experience may differ, and those differences may be material

     ▪ Forward looking information is subject to significant uncertainties
       and risks as they relate to events and/or circumstances in the future

     ▪ This presentation must be read in conjunction with the Q2 2022 earnings release and
       the disclosures therein

     ▪ The full disclaimer is included at the end of this presentation

                                                                                             -2-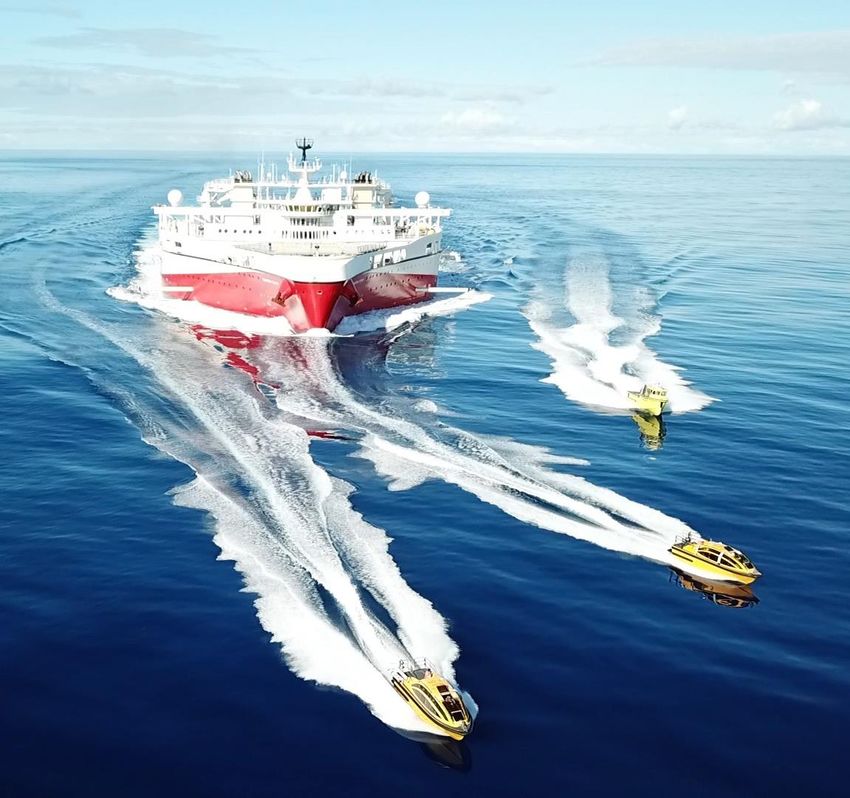
Agenda Q2 2022 Earnings Presentation

                                       Rune Olav Pedersen, President & CEO
                                          – Q2 takeaways
                                          – Financial summary
                                          – Order book

                                       Gottfred Langseth, EVP & CFO
                                           – Financial review

                                       Rune Olav Pedersen, President & CEO
                                          – Operational update and market comments
                                          – Guidance
                                          – Summary and Q&A

                                                                                     3
Q2 2022 Takeaways

            Second highest quarterly revenues since           Successful private placement and
            Q4 2014 and positive net income                   obtained commitment for Super Senior
            • Strong MultiClient late sales                   debt facility
            • High volume of completed MultiClient projects   • Completed subsequent offering in July
            • All 6 active 3D vessels back in operation       • Well positioned to refinance ahead of Q3 2023

            Awarded the fourth carbon storage
                                                              Increasing order book
            acquisition contract
                                                              Market activity and pricing continuing on
            Secured access to ultra-high resolution
                                                              a positive trend
            P-cable

                                                                                                                -4-
Financial Summary
Revenues and Other Income EBITDA*
300
274 193
200
250
210
150
200 186 132
USD million
USD million
166 118 119
142
150 136
100
66
100
52
50
50
0 0
Q1 21 Q2 21 Q3 21 Q4 21 Q1 22 Q2 22
Contract Late sales Other Pre-funding
EBIT** Cash Flow from Operations
58
200
50
150
30
115
USD million
USD million
10
10 100 89
81
63
-10 -5
-8 42 44
50
-21
-30
-29
0
-50
*EBITDA, when used by the Company, means EBIT excluding other charges, impairment and loss on sale of non-current assets and depreciation and amortization, as defined in Appendix of the Q2 2022 earnings release published on July 21, 2022
**Excluding impairments and Other charges. -5-
Improving Marine Seismic Market

          Supportive macro environment                                   Increasing E&P activity
          • High oil and gas prices                                      • Renewed interest from several companies in
          • Increasing focus on energy security                            frontier exploration data sets
          • Investment pressure on energy companies                      • Higher E&P investments

                                        Seismic
                                        • Increasing industry MultiClient library sales
                                        • More client interest in pre-funding new
                                          MultiClient surveys
                                        • Contract activity and pricing continue on a
                                          positive trend
                                        • Vessel schedule for winter season firming up

                                                                                                                        6
Order Book Development
500
▪ Order book of $359 million on June 30, 2022
400 – $82.9 million relating to MultiClient
USD million
300
▪ Fully booked for summer season*
– Q3 22: 18 vessel months
200
– Q4 22: 11 vessel months
– Q1 23: 6 vessel months
100
▪ One vessel booked through the 2023 North Sea
0
Q1 21 Q2 21 Q3 21 Q4 21 Q1 22 Q2 22 season
Contract and other MultiClient pre-funding MultiClient produced, but not delivered
*As of July 19, 2022. Booked positions include planned steaming and yard time. -7-Q2 2022 Financials
Gottfred Langseth, EVP & CFO
This presentation must be read in conjunction with the Q2 2022 Earnings Release and the disclosures therein.
8Consolidated Key Financial Figures
Q2 Q2 YTD YTD Full year
(In millions of US dollars, except per share data) 2022 2021 2022 2021 2021 ▪ Y-o-Y revenue increase
due to an improving
Profit and loss numbers
seismic market, strong
Revenues and Other Income 273.6 185.9 409.9 351.7 703.8
EBITDA 193.3 118.5 245.2 236.2 434.0
late sales and a high
EBIT ex. Impairment and other charges, net 57.8 (7.6) 37.3 (12.8) (32.0) volume of MultiClient
Net financial items (32.7) (16.2) (53.4) (49.8) (97.6) projects finalized and
Income (loss) before income tax expense 28.0 (23.5) (16.2) (59.5) (163.8)
Income tax expense (9.3) (2.5) (14.3) (5.7) (15.6)
delivered to clients in the
Net income (loss) to equity holders 18.7 (26.0) (30.5) (65.2) (179.4) quarter
Basic earnings per share ($ per share) $0.04 ($0.07) ($0.07) ($0.17) ($0.45)
▪ Q2 net financial items
Other key numbers includes $9.0 million
Net cash provided by operating activities 43.7 81.4 107.0 170.0 326.6 expense relating to fair
Cash Investment in MultiClient library 26.2 25.7 47.7 69.0 127.2
Capital expenditures (whether paid or not) 16.2 11.3 35.1 17.5 33.4
value adjustment of the
Total assets 1,822.6 1,946.2 1,822.6 1,946.2 1,792.8 conversion right in the
Cash and cash equivalents 219.8 155.4 219.8 155.4 170.0 convertible bond due to
Net interest bearing debt 887.2 954.5 887.2 954.5 936.4
Net interest bearing debt, including lease liabilities following IFRS 16 985.8 1,093.6 985.8 1,093.6 1,051.3
increased share price
The accompanying unaudited financial information has been prepared under IFRS. This information should be read in conjunction with the Q2 2022 Earnings Release published on July 21, 2022. -9-Q2 2022 Operational Highlights
Contract revenues MultiClient revenues
70 66 100%
64
63
62 90% 200 50
60
80%
52
50 40
70% 150 108
USD million
60%
USD million
40
30
USD million
50%
100 49 81
30 66
26 40%
20
20 30%
25
50 97
20% 80 55 10
10 63 60
10% 45
15
0 0% 0 0
Q1 21 Q2 21 Q3 21 Q4 21 Q1 22 Q2 22 Q1 21 Q2 21 Q3 21 Q4 21 Q1 22 Q2
Contract revenues % active 3D capacity allocated to contract MultiClient pre-funding (lhs) MultiClient late sales (lhs) Cash investment in MultiClient library (rhs)
▪ Contract revenues of $62.8 million ▪ Total MultiClient revenues of $204.7 million
– 63% of active time used for contract acquisition – High transfer fees contributed to strong late sales
– Contract revenues impacted by: – High pre-funding driven by high volume of surveys
• Steaming and standby early in Q2 completed and delivered to clients
• Mobilization for two surveys where production and – Cash investment in MultiClient library of $26.2 million
revenue recognition will primarily be in Q3 and Q4
-10-Seismic Vessel Allocation* and Utilization
100%
▪ 65% active vessel time in Q2 2022
80%
▪ Impacted by relocation and standby in the first part of
60%
Q2
– North Atlantic season start (4 vessels)
40%
– New surveys in Brazil and Cyprus
20%
▪ Vessel utilization expected to improve significantly in
0%
Q1 21 Q2 21 Q3 21 Q4 21 Q1 22 Q2 22
Q3
Contract MultiClient Steaming Yard Stacked/Standby
* The vessel allocation excludes cold-stacked vessels and was in Q2 2022 based on 6 vessels and a total of 90 streamers.
-11-Cost* Development
▪ Q2 2022 cost increase primarily due to
120
116
higher activity level, project specific cost
111
107 and fuel prices
102
98
92
▪ Fuel price adjustment clauses in most
80
agreements for contract work
USD million
▪ Full year gross cash cost guidance
40
increased to ~$500 million
– Increased project activity
– Will operate Sanco Swift and PGS Apollo as
source vessels longer than initially planned
-
Q1 21 Q2 21 Q3 21 Q4 21 Q1 22 Q2 22
Cost of Sales Research and development costs Selling, general and administrative costs ▪ Cost remains a key priority
*Gross cash cost are defined as the sum of reported net operating expenses (excluding depreciation, amortization, impairments, deferred steaming and Other charges) and the cash operating costs capitalized as investments in the MultiClient library as well as capitalized development costs.
-12-Balance Sheet Key Numbers
June 30 June 30 December 31
In millions of US dollars 2022 2021 2021
Total assets 1,822.6 1,946.2 1,792.8
MultiClient Library 321.6 512.2 415.6
Shareholders' equity 332.4 358.0 245.1
Cash and cash equivalents (unrestricted) 219.8 155.4 170.0
Restricted cash 72.1 72.5 73.7
Gross interest bearing debt 1,179.1 1,182.4 1,180.1
Gross interest bearing debt, including lease liabilities following IFRS 16 1,277.7 1,321.5 1,295.0
Net interest bearing debt 887.2 954.5 936.4
Net interest bearing debt, including lease liabilities following IFRS 16 985.8 1,093.6 1,051.3
▪ Cash and cash equivalents (unrestricted) of $219.8 million
▪ Liquidity sweep for cash and cash equivalents above $200 million
– Prepay the September TLB amortization and deferred amounts of the ECF loans
– $19.8 million to be paid early Q3 2022
▪ PGS will convert the remaining outstanding amount of the Convertible Bond to shares in Q3
The accompanying unaudited financial information has been prepared under IFRS. This information should be read in conjunction with the Q2 2022 Earnings Release published July 21, 2022. -13-Consolidated Statements of Cash Flow
Q2 Q2 YTD YTD Full year
In millions of US dollars 2022 2021 2022 2021 2021
Cash provided by operating activities 43.7 81.4 107.0 170.0 326.6
Investment in MultiClient library (26.2) (25.7) (47.7) (69.0) (127.3)
Capital expenditures (11.0) (9.8) (26.8) (18.1) (35.4)
Other investing activities (2.1) (3.0) (4.5) (5.2) (9.2)
Net cash flow before financing activities 4.4 42.9 28.0 77.7 154.7
Proceeds, net of deferred loan costs, from issuance of non-current debt/net cash payment for debt amendment* - (0.8) - (19.2) (19.5)
Interest paid on interest bearing debt (21.9) (20.1) (41.8) (40.0) (80.8)
Proceeds from share issue 83.1 - 83.1 - -
Share buy-back (0.4) - (0.4) - -
Payment of lease liabilities and related interest (recognized under IFRS 16) (10.7) (12.3) (21.9) (24.2) (49.2)
Decrease (increase) in non-current restricted cash related to debt service 1.4 1.8 2.8 4.4 8.1
Net increase (decr.) in cash and cash equiv. 55.9 11.5 49.8 (1.3) 13.3
Cash and cash equiv. at beginning of period 163.9 143.9 170.0 156.7 156.7
Cash and cash equiv. at end of period 219.8 155.4 219.8 155.4 170.0
▪ Moderate net cash provided by operating activities as planned and expected
– Cash collection for Q2 MultiClient late sales primarily early Q3
– Excessive Q2 liquidity sweep avoided
▪ Expect strong Q3 cash flow
The accompanying unaudited financial information has been prepared under IFRS. This information should be read in conjunction with the Q2 2022 Earnings Release published July 21, 2022. 14Q2 Revenues will Drive Q3 Cash Flow
300
250
200
▪ High receivables balance end Q2, driven by
– Revenue increase
USD million
150
– Revenue mix with high MultiClient late sales
100 – Collection of most of Q2 MultiClient late sales in Q3
50
▪ Strong collection and cash flow expected in Q3
– No extended payment terms in Q2 revenues
0
Q4 21 Q1 22 Q2 22
Accounts receivables Accrued revenues and other receivables
▪ Expect a strong liquidity position post the
September amortization of the TLB
▪ Receivables balance end Q3 will be driven by
revenue level and revenue mix in the quarter
15Improving Financial Position
▪ Successfully completed a private placement of ~$85 million
of new equity
▪ Obtained commitments for $50 million of new senior
secured debt
– Will draw in conjunction with the $135 million TLB
amortization in September
▪ Completed subsequent offering of ~$14* million in July
▪ Proceeds used for:
– Debt amortization in Q3 2022
– Increase buffer to the minimum liquidity covenant
– Strengthening balance sheet
▪ Will convert the remaining outstanding amount of the
Convertible Bond (NOK 75.7 million) to shares in Q3 2022
– Issuer conversion option if share trades above NOK 6 for
more than 30 consecutive days
▪ Well positioned to refinance ahead of Q3 2023
*The subsequent offering was fully subscribed to, and gross proceeds amounts to approximately NOK 141 million, corresponding to approximately
$14 million with the exchange rate at the time of closing.
16Operational Update and
Markets Comments
Rune Olav Pedersen, President & CEO
This presentation must be read in conjunction with the Q2 2022 Earnings Release and the disclosures therein.
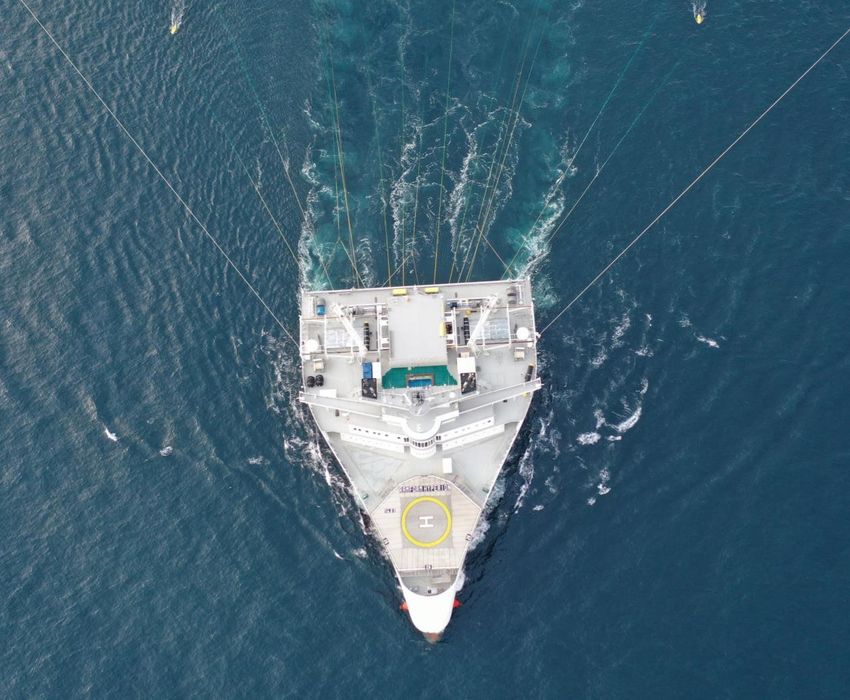
17Fleet Activity July 2022
Ramform Hyperion
Ramform Vanguard
(Norway)
Ramform Atlas
(Norway)
Ramform Titan
(Canada)
Ramform Sovereign
Sanco Swift - source vessel
(Cyprus)
PGS Apollo - source vessel
(Steaming to Brazil)
Ramform Tethys
(Brazil)Improving Marine Seismic Market with Seasonal Swings
Sales leads and active tenders for contract work
▪ Sales leads building momentum for winter-season
1400
with Mediterranean and West Africa as the most
1200 active regions
– Sales leads volume likely to continue to positively
1000
impact tenders
800
USD million
▪ Active Tenders curve increases with multiple recent
600 tenders
– Decline early in Q2 primarily due to awards and
400
removal of large Brazil 4D bid
200
▪ Large number of informal requests for pricing on
0
programs for 2023
Active Tenders Marine Contract* All Sales Leads Marine Contract (Including Active Tenders)* – Often results in later contract tenders, hybrid
MC/contract awards or MultiClient programs
*Contract bids to go (in-house PGS) and estimated $ value of bids + risk weighted leads as of mid-July, 2022.
19Historically Low Supply
Number of
streamers
700
600
▪ Supply remains stable during summer-
500
season
– Little warm-stacked capacity brought
400
back opportunistically
▪ PGS operates 6 vessels
300
200
100
0
Q1 13 Q1 14 Q1 15 Q1 16 Q1 17 Q1 18 Q1 19 Q1 20 Q1 21 Q1 22
Source: PGS internal estimates
20New Energy Gains Momentum:
Establishing a Solid Position in the Carbon Storage Geoservices Market
▪ Successful completion of Northern Lights Carbon
Capture and Storage (CCS) 4D baseline and acquisition
over the Endurance CCS reservoir
▪ Awarded acquisition contract by Equinor over the
Smeaheia carbon storage site in the North Sea
▪ Acquiring data for CCS as part of Snøhvit 4D
▪ Entered into an agreement with deepC Store (dCS) to
co-develop CCS projects in Asia Pacific
– Provide advisory services in exchange for shares in dCS
▪ Expect to generate revenues of ~$30 million relating to
New Energy business in 2022
Ramform Hyperion while acquiring the Endurance CCS survey during Q2 2022.
212022 Guidance and Year-to-date Performance
MultiClient cash Active 3D vessel
Group cash cost investment time allocated to Capital expenditures
Contract
2022 Guidance ~$500 million ~$125 million ~65% ~$60 million
Year-to-date $222.8 million ~$47.7 million 67% $35.1 million
-22-Summary
Successful private placement and
Second highest quarterly revenues since
obtained commitment for Super Senior
Q4 2014
debt facility
New Energy business continues to gain Winter season is firming up with activity
momentum and pricing continuing on a positive trend
-23-Questions?
COPYRIGHT
The presentation, including all text, data, photographs, drawings and images (the “Content”) belongs to PGS ASA, and/or its subsidiaries (“PGS”) and may be protected by Norwegian,
U.S., and international copyright, trademark, intellectual property and other laws. Accordingly, neither the whole nor any part of this document shall be reproduced in any form nor used
in any manner without express prior written permission by PGS and applicable acknowledgements. In the event of authorized reproduction, no trademark, copyright or other notice shall
be altered or removed. © 2022 PGS ASA. All Rights Reserved.
This presentation must be read in conjunction with the Q2 2022 earnings release and the disclosures therein.
24Appendix
Yard Stays* Next Six Months
Vessel When Expected Type of Yard Stay
Duration
Ramform Atlas Q3/Q4 2022 10 days Port call – general
maintenance and source
controller upgrade
Ramform Titan Q3/Q4 2022 5 days Port call – general
maintenance
Ramform Vanguard Q3/Q4 2022 7 days Port call – general
maintenance and UPS
upgrade
*Subject to changes -25-Disclaimer
▪ This Presentation is for informational purposes only. The information contained in this Presentation, unless otherwise specified, is only current as of the date of this
Presentation and is subject to further verification and amendment in any way without liability or notice to any person. The information contained in this Presentation has not
been independently verified.
▪ The information in this Presentation includes forward-looking statements, which are based on the Company’s assumptions, analysis and current expectations and
projections about future events. These forward-looking statements is subject to significant uncertainties and risks as they relate to events and/or circumstances in the future
and are only predictions and are subject to known and unknown risks, uncertainties, assumptions and other factors beyond the Company’s control. Actual experience may
differ, and those differences may be material. Factors that might cause or contribute to such differences include, but are not limited to, global economic conditions, the
impact of political, economic and regulatory developments in the United Kingdom, Norway, United States and the European Union and other relevant geographies, and
planned capital expenditure. None of the Company nor any of its affiliates or their respective directors, officers, employees, advisers, agents or representatives (each a
“Company Related Person”) undertakes any obligation to update any forward-looking statements to reflect any changes in the Company’s expectations with regard thereto or
any changes in events, conditions or circumstances on which any such statement is based.
▪ This Presentation must be read in conjunction with the Q2 2022 earnings release and the disclosures therein, and is not and should not be read as a confirmation or
otherwise on future compliance with financial covenants under the Company’s financing arrangements.
▪ THIS DOCUMENT IS NOT FOR RELEASE, PUBLICATION OR DISTRIBUTION, IN WHOLE OR IN PART, DIRECTLY OR INDIRECTLY, IN OR INTO OR FROM THE UNITED STATES OF
AMERICA, ITS TERRITORIES OR POSSESSIONS, AUSTRALIA, CANADA, JAPAN OR SOUTH AFRICA OR TO ANY RESIDENT THEREOF, OR ANY JURISDICTION WHERE SUCH
DISTRIBUTION IS UNLAWFUL. THIS DOCUMENT IS NOT AN OFFER OR AN INVITATION TO BUY OR SELL SECURITIES.
▪ Each Company Related Person expressly disclaims any duty, undertaking or obligation to update publicly or release any revisions to any of the information, opinions or
forward looking statements contained in this Presentation to reflect any events or circumstances occurring after the date of this Presentation. No undertaking,
representation or warranty or other assurance, express or implied, is made or given as to the accuracy, completeness, sufficiency or fairness of the information or opinions
contained or expressed in this Presentation or any related oral presentation (or whether any information has been omitted from this Presentation) and no responsibility or
liability is accepted by any person for any loss, cost or damage suffered or incurred as a result of the reliance on such information or opinions or otherwise arising in
connection with this Presentation or any related oral presentation. In addition, no duty of care or otherwise is owed by any loss, cost or damage suffered or incurred as a
result of the reliance on such information or opinions or otherwise arising in connection with this Presentation. Recipients of this Presentation should conduct their own
investigation, evaluation and analysis of the Company in this Presentation.
▪ This Presentation does not constitute investment, legal, accounting, regulatory, taxation or other advice and does not take into account any recipient’s investment
objectives or legal, accounting, regulatory, taxation or financial situation or particular needs. Each recipient is solely responsible for forming its own opinions and conclusions
on such matters and for making its own independent assessment of the Company. Recipients are responsible for seeking independent professional advice in relation to the
Company. No responsibility or liability is accepted by any person for any of the information or for any action taken by any Company Party on the basis of such information.
▪ This Presentation does not constitute or form part of, and should not be construed as an offer or the solicitation of an offer to subscribe for or purchase securities of the
Company.
▪ This Presentation and any distribution and use of this Presentation shall be governed by and construed in accordance with Norwegian law. The courts of Norway, with
Oslo as legal venue, shall have exclusive jurisdiction to settle any dispute which may arise out of or in connection with the distribution and use of this Presentation.
26You can also read