SENIORS HOUSING INDUSTRY OVERVIEW CANADA - Cushman & Wakefield
←
→
Page content transcription
If your browser does not render page correctly, please read the page content below

SENIORS HOUSING
INDUSTRY OVERVIEW
CANADA

A Cushman & Wakefield
Valuation & Advisory Publication

January 2022

                                   // 1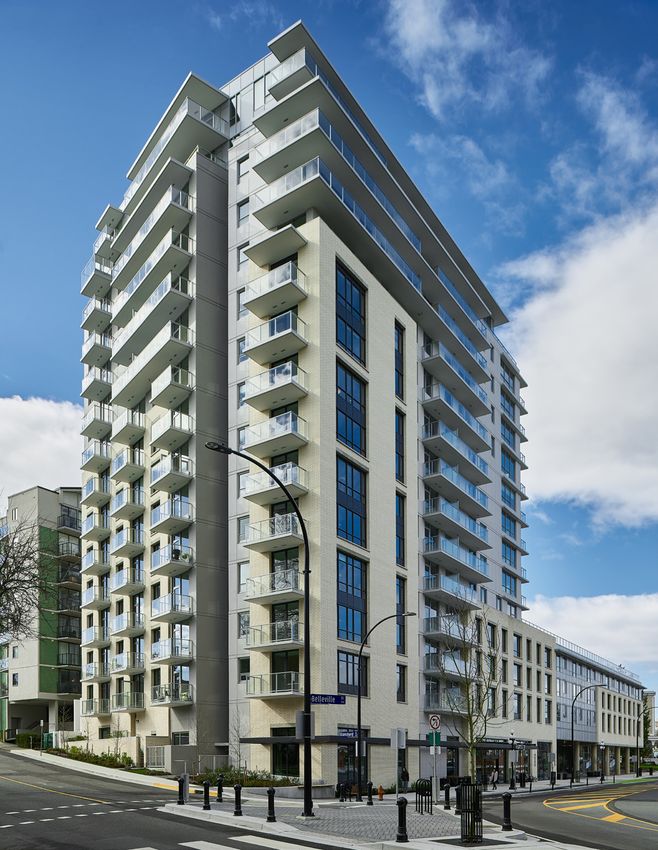
INTRODUCTION
TABLE OF CONTENTS                             For a second year in a row, the COVID-19 pandemic shaped
                                              nearly all facets of life in Canada. While several encouraging

   2
                                              new developments in 2021 brought about renewed
                     INTRODUCTION             optimism for a return to ‘life as normal’, pandemic-related
                                              challenges remained pervasive throughout the year and

   3
                                              into the start of 2022.
                     YEAR IN REVIEW
                                              Last year began with the implementation of a newly
                                              developed COVID-19 vaccine on the horizon. Although

   4                 OPERATING FUNDAMENTALS
                                              the rollout of vaccines was initially slower in Canada than
                                              in other developed countries due to limited supply, by
                                              August 2021 Canada claimed one of the highest population

   8
                                              immunization rates in the world. Following almost a year-
                     DEVELOPMENT MONITOR      and-a-half of a downward trend, national seniors housing
                                              occupancy reached an inflection point in the summer of

  10
                                              2021 and positive leasing momentum and occupancy gains
                     INVESTMENT MARKET        began to build through the remainder of the year. High
                                              resident and staff vaccination rates bolstered consumer
                     OVERVIEW
                                              confidence and propelled leasing lead generation and tour
                                              activity back to pre-COVID levels for many communities.
                                              Improved visibility into the path to recovery in fundamentals
For more information about                    provided the foundation for a resounding return of
Canadian Seniors Housing,                     investors, who completed several benchmark-setting
please contact:                               transactions during the year.

Sean McCrorie, CFA, CBV, AACI, MRICS
Executive Vice President & Practice Leader    In November 2021, the emergence of the highly
Seniors Housing & Healthcare                  transmissible ‘Omicron’ variant of concern and the resulting
Valuation & Advisory                          rise in community infection rates led to labour shortages
+1 416 359 2735                               in Canada as isolation guidelines to help limit transmission
sean.mccrorie@cushwake.com
                                              of the virus resulted in higher staff absences. While the
Heather Payne, AACI, P.App                    leasing momentum built through the second half 2021 may
Vice President                                slow on a seasonal basis, we remain optimistic that the
Seniors Housing & Healthcare                  needs-driven demand that characterizes this asset class
Valuation & Advisory                          will continue to drive net leasing gains in 2022 and beyond.
+1 416 359 2736
                                              Over the medium-term, as demand is expected to outstrip
heather.payne@cushwake.com
                                              supply growth, we expect higher rent growth will more than
Austin Lennard                                offset the effects of increasing inflation due to tight labour
Associate Vice President                      markets and lingering costs related to mitigating impacts
Seniors Housing & Healthcare                  from the pandemic.
Valuation & Advisory
+1 416 359 2737
austin.lennard@cushwake.com                   Despite the persisting near-term headwinds, the investment
                                              thesis for seniors housing remains intact, with many
On the cover and throughout:                  investors actively positioning themselves to capitalize
Tapestry at Victoria Harbour
                                              on the next 20 years of expected strong growth in this
Victoria, British Columbia. Opened 2021.
                                              asset class.
Throughout:
Seasons Cambridge
Cambridge, Ontario. Opened 2020.

                                                                                                    // 2
YEAR IN REVIEW
The pandemic seems to have accelerated                          Third Quarter
                                                                Leasing indicators suggest that a recovery in seniors
the rate of change when it comes to market
                                                                housing operating fundamentals in Canada commenced
fundamentals and investment activity in the
                                                                in Q3. The seniors housing investment market also
seniors housing sector. To summarize the                        started to rebound, with the level of investor interest in
evolving market sentiment over time, we                         ‘best-in-class’ properties pushing cap rates for triple-A
have provided a review of the state of the                      quality assets lower than pre-COVID levels in the Greater
Canadian seniors housing market in 2021                         Toronto, Montréal and Lower Mainland markets. On
on a more granular quarterly basis.                             a national basis, the total number of COVID-19 cases,
                                                                related-hospitalizations and deaths during the ‘fourth
                                                                wave’ of the pandemic remained well below prior waves.
First Quarter                                                   High community and staff immunization rates coupled
Despite challenges posed by the ‘third wave’ of the             with targeted public health measures contributed to an
COVID-19 pandemic, seniors housing investor sentiment           environment of improving consumer confidence and
started to improve relative to 2020. Although community         market sentiment for this asset class which caters
spread of the virus and its variants continued to increase in   to a clientele who are particularly vulnerable to the
Canada through the first quarter of 2021, related outbreaks     COVID-19 virus.
and case counts in retirement residences and long-term
care homes began to decrease materially following the
rollout of vaccines. The implementation of vaccines             Fourth Quarter
bolstered consumer confidence, a key pre-requisite for          Building off the momentum from major transaction
a turnaround in operating performance. From a leasing           announcements in Q3, activity in the direct property
perspective, lead generation improved significantly and         investment market continued to increase to close out the
began to return to pre-COVID levels for many communities.       year, with prospects of more deal announcements to come
As vaccinations reached critical mass, we began to predict      in early 2022. The improving outlook for the investment
an inflection point in occupancy would occur later in the       market was tempered by the emergence of the highly
year, kicking off an ensuing recovery.                          transmissible ‘Omicron’ variant of concern, which sparked
                                                                a resurgence of concerns regarding COVID-19 related
                                                                outbreaks, labour shortages and increased pandemic
Second Quarter                                                  related expenses. The latest wave of the pandemic could
Seniors housing occupancy data from the U.S. and the U.K.,      potentially weigh on the leasing momentum and the
countries which initially had higher vaccination rates than     occupancy recovery which continued to show progress
Canada, began to suggest an inflection point in same-           during the fourth quarter of 2021. Notwithstanding the
property seniors housing occupancy trends occurred in           current challenges associated with the pandemic, some
Q2 2021. With improving vaccination rates, continued            infectious disease experts are looking beyond the ‘fifth
strength in the housing market and general stability in the     wave’ and are hopeful that the new year could see a
overall economic outlook, we anticipated seniors housing        downgrade from pandemic to endemic disease status
occupancy in Canada would follow the path set by the U.S.       in most parts of North America. The emergence of new
and U.K. data albeit on a lagged basis, commencing in the       variants that manage to evade vaccine-induced immunity
second half of 2021.                                            could pose a risk to this hopeful outlook.

                                                                                                                    // 3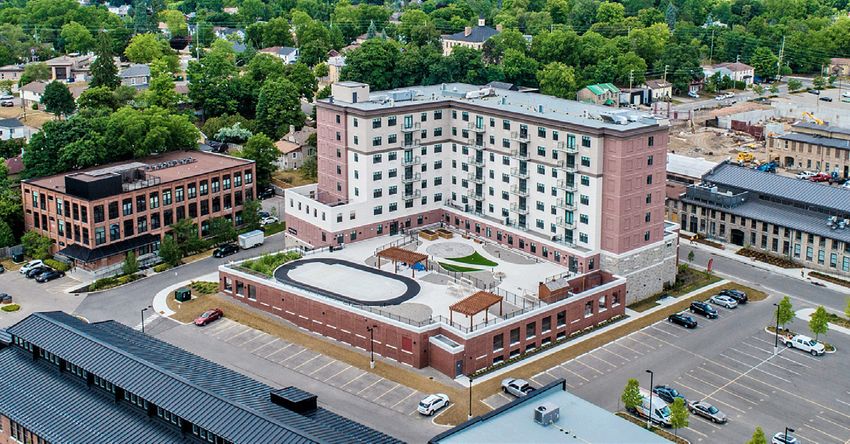
OPERATING FUNDAMENTALS
Canadian Historical Operating Statistics: 2010 to 2021
Supply Supply Demand Demand Occupancy
Since
Year the COVID-19
Pop. Age 75+ Pop. outbreak
% Growth was declared
Inventory Changea global the reported
% Change # of Residents Change 2020 statistics
% Change largely Change
Occupancy reflected the
Base IL market
Rents Rent Growth
[%] [Units] [Units] [%] [%] [Residents] [%] [%] [pp] [$] [%]
pandemic
2012 in March 2020,
2,346,041 3.2% the virus has had5,757
204,496 a material 2.9% conditions
202,092 6,830pre-COVID.
3.5% We 90.5%
primarily attribute
0.2 the
$2,158decline2.7%
in
2013 2,399,240 2.3% 208,301 3,805 1.9% 205,112 3,020 1.5% 90.8% 0.3 $2,230 3.3%
impact
2014 on 2,462,464
occupancy in seniors219,052
2.6% housing communities.
10,751 5.2% reported
218,650 occupancy
13,538 6.6% to the91.3%
government 0.5mandated
$2,271 leasing 1.8%
2015 2,513,989 2.1% 224,342 5,290 2.4% 224,962 6,312 2.9% 91.9% 0.7 $2,307 1.6%
As
2016illustrated by the CMHC
2,584,397 2.8% Seniors
232,478Housing Survey 3.6%
8,136 restrictions
234,989 10,027 placed on operators
4.5% 92.5% during0.6certain$2,406periods of4.3%
data,
2017
2018
national seniors housing
2,648,745
2,746,162
2.5%
3.7%
occupancy
236,980
247,983
decreased4.6%
4,502
11,003
by
1.9%
lockdowns
240,383
251,323
5,394
10,940
during4.6%
this period.
2.3% 93.0%
92.7%
We note that despite
0.5
(0.4)
$2,472
$2,552
the 2.7%
3.2%
more
2019 than 2,822,028
six points year-over-year
2.8% 255,295 as of Q1 2021. CMHC
7,312 2.9% impact on
257,360 6,037occupancy,
2.4% rent 92.3%
growth remained
(0.4) robust
$2,636 during 3.3%
2020 2,880,911 2.1% 262,338 7,043 2.8% 265,178 7,818 3.0% 92.1% (0.2) $2,711 2.8%
statistics
2021 represent
2,993,582 a point
3.9% estimate
272,179 of each statistic 3.8%
9,841 the first
253,340 year of the
(11,838) pandemic.
(4.5%) 85.5% (6.6) $2,815 3.8%
10-Year CAGR 2.8% 3.2% 2.6% (4.8) 3.0%
from data collected in Q1 of the survey year. Therefore,
Source: CM HC Seniors Housing Report (2009 to 2021) Tables 1.4 and 3.1, Cushman & Wakefield
Demand defined as the number of residents living within a seniors residence, as reported by CM HC
Occupancy Average One Bedroom Rent
Occupancy Average One Bedroom Rent
100.0% $6,000
$5,284
95.0% $5,000 $4,907
90.8% $4,323
90.0% $4,000
87.4%
85.0% 85.5% $3,000
80.0% 80.9% $2,000 $1,888
77.8%
75.0% $1,000
70.0% $0
2009 2012 2015 2018 2021 2009 2012 2015 2018 2021
Ontario Québec British Columbia Alberta National Toronto Montréal CMA Vancouver Coastal Calgary CMA
Note: Average rents reflect typical ISL service package (i.e., including daily meals and weekly housekeeping) except for reported Montréal rents, which exclude the services component
Canadian Historical Operating Statistics: 2012 to 2021
Pop. % Supply Supply # of Demand Demand Occupancy
Year Pop. Age 75+ Inventory Occupancy Base IL Rents Rent Growth Rent Growth
Growth Change % Change Residents Change % Change Change
[%] [Units] [Units] [%] [%] [Residents] [%] [%] [pp] [$] [%] [CAGR %]
2012 2,346,041 3.2% 204,496 5,757 2.9% 202,092 6,830 3.5% 90.5% 0.2 $2,158 2.7% 2.7%
2013 2,399,240 2.3% 208,301 3,805 1.9% 205,112 3,020 1.5% 90.8% 0.3 $2,230 3.3% 3.0%
2014 2,462,464 2.6% 219,052 10,751 5.2% 218,650 13,538 6.6% 91.3% 0.5 $2,271 1.8% 2.6%
2015 2,513,989 2.1% 224,342 5,290 2.4% 224,962 6,312 2.9% 91.9% 0.7 $2,307 1.6% 2.4%
2016 2,584,397 2.8% 232,478 8,136 3.6% 234,989 10,027 4.5% 92.5% 0.6 $2,406 4.3% 2.7%
2017 2,648,745 2.5% 236,980 4,502 1.9% 240,383 5,394 2.3% 93.0% 0.5 $2,472 2.7% 2.7%
2018 2,746,162 3.7% 247,983 11,003 4.6% 251,323 10,940 4.6% 92.7% (0.4) $2,552 3.2% 2.8%
2019 2,822,028 2.8% 255,295 7,312 2.9% 257,360 6,037 2.4% 92.3% (0.4) $2,636 3.3% 2.9%
2020 2,880,911 2.1% 262,338 7,043 2.8% 265,178 7,818 3.0% 92.1% (0.2) $2,711 2.8% 2.9%
2021 2,993,582 3.9% 272,179 9,841 3.8% 253,340 (11,838) (4.5%) 85.5% (6.6) $2,815 3.8% 3.0%
10-Year
2.8% 3.2% 2.6% (4.8) 3.0%
CAGR
Source: CMHC Seniors Housing Report
// 4
Demand from
Demand from Baby
Baby Boomers
Boomers Population Age 75+
Population Age 75+
Forecast
Forecast
Actual
Actual
% of Total
% of Total
9,000,000 16%
While we we have
have been been hearing
hearing this this one
one for for thethe past
past 15 15
9,000,000 16%
While
8,000,000 14%
8,000,000 14%
years, the time has finally come.
years, the time has finally come. Over the next 20 Over the next 20 7,000,000
7,000,000
12%
12%
years, the
the 75-plus
75-plus segment segment is is expected
expected to to grow
grow by by
6,000,000
years,
10%
Sector Tailwinds
6,000,000
5,000,000 10%
almost 4.0% per year and will
almost 4.0% per year and will account for 13.5% of account for 13.5% of the
the 5,000,000
4,000,000
8%
8%
total
Once population
conditions by
total population by
permit2040.
2040. We
sustained expect
We expect demand
re-leasing
demandactivity, from
from the the 4,000,000
we think occupancy will bounce back within a reasonable
3,000,000
6%
6%
3,000,000
age
timeframe80+ cohort
age 80+ cohort for most to pick up
communities.
to pick materially
up materially starting
Thestarting
following in 2022.
in factors
2022. summarize why we remain constructive on the long-term
2,000,000
4%
4%
SECTOR TAILWINDS
2,000,000
2%
outlook for the asset class.
1,000,000
1,000,000 2%
To maintain
To maintain the the current
current levellevel of of seniors
seniors housinghousing -
- 1971 1981 1991 2001 2011 2021 2031 2041 2051 2061
-%
-%
inventory
Once per per capita
conditions and market
permit equilibrium, total supply Population Age 75+
supply Population
marketsustained
1971 1981 1991 2001 2011 2021 2031 2041 2051 2061
Demand
inventory
will need to
from capita
more
Baby
than
and Boomers
double
equilibrium, total
over the next 20 years.
Age 75+ Forecast Actual % of Total
Source: StatsCan. Tables 17-10-0005-01 and 17-10-0057-01 Projection scenario M4: medium-grow th
re-leasing activity, we think
will need to more than double over the next 20 years. occupancy Source: StatsCan. Tables 17-10-0005-01 and 17-10-0057-01 Projection scenario M4: medium-grow th
9,000,000 16%
While we have been hearing
will bounce back within a reasonable this one for the past 15 8,000,000 14%
Decline
years,
Decline the in
timeframe in
time New
New has Retirement
finally
most come.
forRetirement Residence
Over
Residence
communities. the next We20 remain Canada
Canada
7,000,000
12%
Construction
years, the
Construction 75-plus
constructive Starts
segment
Starts is expected
on the long-term outlook for to grow by
6,000,000
Construction Starts as % of Inventory (Units)
Construction Starts as % of Inventory (Units)
5,000,000
10%
almost 4.0% per year and will account for 13.5% of the 8.0%
8%
the
Seniors sector
housing for the following
construction starts reasons.
increased
8.0%
Construction Starts as % of Inventory
4,000,000
Seniors
total housingbyconstruction
population starts increased 7.0%
20212040. We expect demand from the
Construction Starts as % of Inventory
7.0% 6%
marginally
marginally inin 2021 and remain
and remain at historically
at historically low levels,
low levels, 3,000,000 6.0%
5.5%
age 80+ cohort to pick up materially starting in 2022.
6.0%
4%
asDemand From Baby Boomers
4.9% 5.5%
developers remain more selective about new new
2,000,000 5.0% 4.8%
4.9%
as developers remain more selective about
5.0% 4.8%
1,000,000 4.0% 2%
While we have been hearing this one for the past 15 years,
3.6%
Toprojects.
maintain the current level of seniors housing
projects.
4.0%
-3.0% -%
3.6%
2.6%
2.8%
2.8%
the time has finally come. Over the next 20 years, the age 3.0%
1971 1981 1991 2001 2011 2021 2031 2041 2051 2061 2.6%
inventory
75-plusper
Pre-COVID, segmentcapita
the is and
market market
was deep
expected deep
to equilibrium,
grow into
by a total
4.0%supply
a development
development
almost per
2.0%
Pre-COVID, the market was into
2.0%
Source: StatsCan.
1.0% Tables 17-10-0005-01 and 17-10-0057-01 Projection scenario M4: medium-growth
Source: StatsCan. Tables 17-10-0005-01 and 17-10-0057-01 Projection scenario M4: medium-grow th
will need
cycle,
yearwith to
with
and will more
several than
account double
major regions
for 13.5% over the
across
of the next
total thethe 20 years.
country
population
1.0%
cycle, several major regions across countryby -%
-%
2016 2017 2018 2019 2020 2021
facing
2040. headwinds
We expect from demand oversupply
from the age
facing headwinds from oversupply due to overbuilding. due to
80+ overbuilding.
cohort to pick 2016 2017 2018 2019 2020 2021
Decline
Today, thein outlook
up materially New startingRetirement
on new
in 2022. supply Residence
is favourable as the
Canada
Canada
Today, the outlook on new supply is favourable as the
M etric: Pro jects which co mmenced co nstructio n in the perio d (measured by units) as a percentage o f the existing units o f invento ry (Sample based o n C&W Co nstructio n Index)
Construction Starts as % of Inventory (Units)
Construction Starts activity
MC&W
etric: Co
Pronstructio n Index
jects which sample ocof market
co mmenced marticipants
nstructio has
n in the perio been expanded
d (measured to o ver
by units) as a60% o f po pulatio
percentage n fo
o f the r 2021units
existing statistics. Prio rryperio
o f invento ds restated
(Sample based ofon rC&W
the expanded dataset
Co nstructio n Index)
decrease in
decrease in development
development activity between
between 2018 2018 to to 2021
2021 Construction
Source:
C&W Cushman
Co nstructio
Construction
n& Wakefield
Index sampleULC
Starts Starts
o f market marticipants has been expanded to o ver 60%o f po pulatio n fo r 2021 statistics. Prio r perio ds restated fo r the expanded dataset
as % of Inventory
as % of(Units)
Source: Cushman & Wakefield ULC Inventory (Units)
will
Toresult
maintainin less disruption
the current levelfrom new
of seniors competition
housing inventoryin the United
8.0% States
8.0%
as % of Inventory
willper
Seniorsresult in less
housing disruption
totalconstruction
from new
starts competition
increased in the United States
Starts as % of Inventory
coming capita,
years. supply will need to more than double over 7.0%
7.0%
coming
marginally years.
the next in 202021years.and remain at historically low levels,
Construction Starts as % of Inventory (Units)
Construction
6.0% Starts as % of Inventory (Units)
6.0%
5.5%
5.5% 4.9%
as developers remain more selective about new
6.0%
5.0% 4.8%
4.9% 6.0%
Inventory
5.0% 4.8%
4.0%
of entory
3.6%
projects.
5.0%
Decline in New Retirement Residence
% Starts
5.0% 4.2% 2.8%
4.0% 3.6%
3.0%
% Inv
4.0%
Construction
4.2% 2.6%
Construction Starts 4.0% 4.0% 2.8% 3.8%
of
Pre-COVID, the market was deep into a development
3.0% 2.0%
4.0% 2.6% 3.8% 3.2%
Construction as as
3.2%
Seniors housing construction starts increased marginally
Starts
3.0%
1.0%
2.0%
cycle, withand several
remainmajor regionslow across the as country
Starts
3.0%
2.1% 2.2%
in 2021 at historically levels, developers -%
Construction
2.0% 2.1% 2.2%
1.0% 2016 2017 2018 2019 2020 2021
facing headwinds from about
oversupply duenewtoprojects.
overbuilding.
Construction
2.0%
remain more selective starting -% 1.0%
Today, the outlook on new supply is favourable as the 2016 2017 2018 2019 1.0% 2020 2021
M etric: Pro jects which co mmenced co nstructio n in the perio d (measured by units) as a percentage o f the existing units o f invento ry (Sample based o n C&W Co nstructio n Index)
C&W Co nstructio n Index sample o f market marticipants has been expanded to o ver 60%o f po pulatio n fo r 2021 statistics. Prio r perio ds restated fo r the expanded dataset
-%
decrease in development activity between 2018 to 2021
Metric:
Source: Projects
Cushman whichULC
& Wakefield commenced construction in the period (measured by units) as a percentage of the existing units of inventory (Sample based on C&W Construction Index)
Pre-COVID, the market was deep into a development -%
C&W Construction 2016of market participants
Index sample
2016
Source: Cushman & Wakefield ULC
2017
2017
2018
has been expanded to over
2018
2019for 2021 statistics. Prior
60% of total market supply
2019
2020
2020
periods restated for the 2021
expanded data set
2021
will cycle,
resultwith
in less disruption from across
new competition in the United States
Metric: Projects which commenced construction in the period (measured by units) as a percentage of the existing units of inventory (Sample based on C&W Construction Index)
several major regions the country facing C&W Construction Index sample of market participants has been expanded to over 60% of total market supply for 2021 statistics. Prior periods restated for the expanded dataset
M et ric: Unit s under const ruct ion as a percent age of t he exist ing unit s of invent ory (Sample based on NIC M AP, All M arket s, Seniors Housing)
Source: Cushman & Wakefield ULC
coming years.
headwinds from oversupply due to overbuilding. Today, MSource: NIC
et ric: Unit M AP®
s under Data
const Service
ruct ion as a percent age of t he exist ing unit s of invent ory (Sample based on NIC M AP, All M arket s, Seniors Housing)
Source: NIC M AP® Data Service
Construction Starts as % of Inventory (Units)
Higher
Higher Barriers
the outlook on newto
Barriers Entry
supply
to Entry
is favourable as the decrease Year-over-Year
Year-over-Year
6.0%
Year-over-Year
Increase,Increase,
Q2 2021
Increase, Q2 2021
Q2 2021
in development activity between 2018 to 2021 will result in United
160% States148%
Starts as % of Inventory
160%
In the
the past
past 18-months
18-months wecompetition
have seen
seeninmaterial
material increases
5.0% 148%
In less disruption from newwe have the coming years.
increases
140%
140% 4.0%
4.2%
Construction Starts as % of Inventory (Units)
in the cost of development for all property
in the cost of development for all property types, types, 120%
120%
4.0%
8.0% 101%
3.8%
3.2%
Higherseniors
including Barriers to Entry
housing. Rising construction
construction costs
costs
% of Inventory
100%3.0% 101%
including seniors housing. Rising 100%
7.0% 77% 2.1% 2.2%
have resulted in higher barriers to entry and have
80%
In the past 18-months we have seen material increases in 77%
Construction Starts asConstruction
2.0%
have resulted in higher barriers to entry and have
80%
60% 6.0%
the cost
contributed toof development
to the
the trend
trend offor all
of lower property
lower supply types,
supply growth including
growth and and 60%
contributed
1.0%
40% 5.0%
PPI: All Commodities 19% 30%
seniors
fewer housing. Rising
construction construction costs have resulted in
starts. 40% 4.0% 4.2%
PPI: All Commodities 19% 30%
fewer construction
higher starts.
barriers to entry and have contributed to the trend
20%
20%
-%
4.0%
2016 2017 2018
3.8%
2019 3.2% 2020 2021
3%
0%3.0% 3%
of lower supply growth and fewer construction starts. 0% Diesel Fuel Lumber Copper Steel 2.1% Cement
2.2%
2.0% Diesel
M et ric: Unit s under const ruct Fuel
ion as a percent age of t he exist ing unit s Lumber Copper
of invent ory (Sample based on NIC M AP, All M arket s, Seniors Housing) Steel Cement
Source: NIC M AP® Data Service
1.0%
Source: U.S. Bureau of Labor Statistics (BLS), Moody’s Analytics Forecasted, Cushman & Wakef ield ULC
Higher Barriers to Entry
Source: U.S. Bureau of Labor Statistics (BLS), Moody’s Analytics Forecasted, Cushman & Wakef ield ULC
Year-over-Year Increase, Q2 2021
-%
160% 2016
148%
2017 2018 2019 2020 2021
In the past 18-months we have seen material increases 140%
in the cost of development for all property types, 120%Units under construction as a percentage of the existing units of inventory (Sample based on NIC MAP, All Markets, Seniors Housing)
Metric:
Source: NIC MAP® Data Service 101% CUSHMAN & WAKEFIELD 5
CUSHMAN & WAKEFIELD 5
including seniors housing. Rising construction costs 100%
77%
have resulted in higher barriers to entry and have
80%
60%
contributed to the trend of lower supply growth and 40%
PPI: All Commodities 19% 30%
fewer construction starts. 20%
3%
0%
Diesel Fuel Lumber Copper Steel Cement
// 5
Source: U.S. Bureau of Labor Statistics (BLS), Moody’s Analytics Forecasted, Cushman & Wakef ield ULC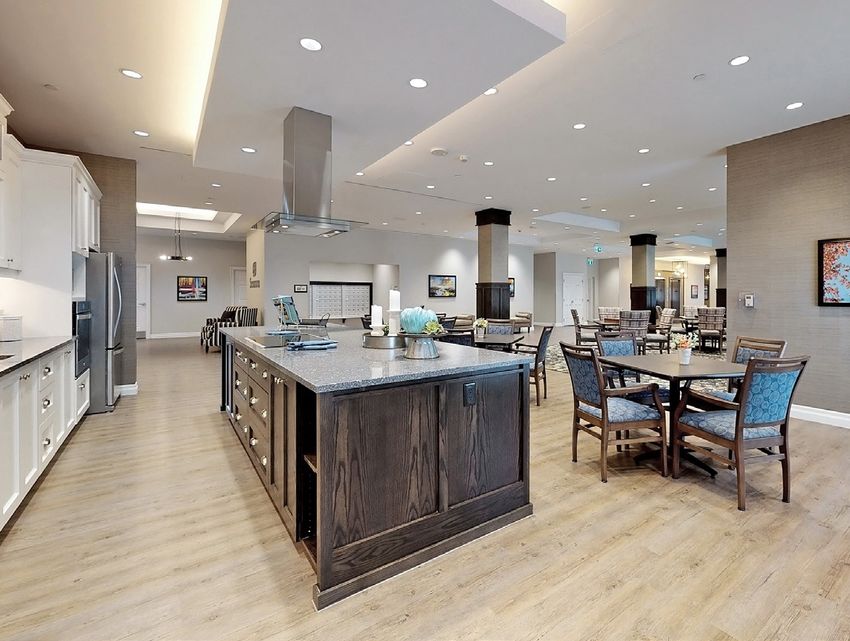
Extended Residential Housing Market Rally National House Price Index
Extended Residential
The seniors housing Housing
rental market Market
continues Rally
to benefit from National
NationalHouse
House Price Index
Price Index
Extended
xtended Residential
risingResidential
house
housingHousing
prices, which Housing
is a primary Market
Market
driver theRally
ofRally
net worth National
450450
House
PricePrice Index 20%
20%
Year-Over-Year Percent Change
National House Index
National House Price Index
The seniors rental market continues to benefit
ChangeChange
400400
of future seniors housing residents. Price appreciation over
National House Price Index
450 450 20%
15% 20%
15%
heThe seniors
from
seniors housing
rising
20 house
housing rental
prices,
rental amarket
which
market iscontinues
abased
continues primary
to to benefit
driver
on benefit of the 350350
400
the past years exceeds 6% CAGR the National
PercentPercent
National House Price Index
400
National House Price Index
300300 10%10% 15%
15%
omfrom net
rising
Bankworth
rising
house
and of
house future
prices,
Teranet seniors
prices, which
Inc.which
House ishousing
aisprimary
Price Index.residents.
a primarydriver Price
driver of the
of the 350
250250
350
appreciation over the past 20 years exceeds a 6% 300 10%
Year-Over-Year
etnet worth of future seniors housing residents. Price 300 5%5%
10%
worth of future seniors housing residents. Price 200200
250
ppreciation over the past 20 years exceeds a 6%6%Inc.
CAGR based on the National Bank
Increasing
appreciation overInvestor
the pastAllocations
20 years toand
exceedsTeranet
Real Assets
a
250
150150 0%0% 5%
Year-Over-Year
5%
200
200 100
CAGR House
based Price
Brookfield Index.
estimates that institutional investors’ allocations 100 Year-Over-Year
AGR based on on
thethe National
National BankBank andand Teranet
Teranet Inc.Inc. 150 Index
Index (LHS)
(LHS) Year-Over-Year Change (RHS) -5%
-5% 0%
150 50 Change (RHS) 0%
50
to alternatives, including real estate, private equity and
House
ouse Price
Price Index.
Index.
infrastructure, could reach 60% by 2030[1]. We also expect
100 100
- -
Index (LHS)
Year-Over-Year
Year-Over-Year -10%
-10%
-5%
2000
2000
2004
2004
2006
2009
2006
2005
2008
2008
2003
2002
2020
2007
2002
2020
-5%
ChangeChange
(RHS) (RHS)
2010
2001
2010
Index (LHS)
2014
2014
2016
2016
2019
2018
2018
2015
2012
2013
2012
2021
2017
2000
2002
2003
2004
2005
2006
2007
2009
2010
2011
2012
2014
2016
2016
2020
2000
2001
2002
2004
2006
2008
2008
2010
2013
2014
2015
2017
2018
2019
2020
2021
2011
50 50
real estate alternatives[2] to grow as a proportion of the - - -10% -10%
2000
2002
2003
2004
2005
2006
2007
2009
2010
2011
2012
2014
2016
2016
2018
2020
2000
2001
2002
2004
2006
2008
2008
2010
2012
2013
2014
2015
2017
2018
2019
2020
2021
Source:
Source: House
House Price
Price Index.
Index. TeranetInc.,
Teranet Inc.,and
and National
National Bank.
Bank.Re-indexed
Re-indexedto 100 = January
to 100 20002000
= January
overall real estate asset mix. Net capital inflows should
2000
2002
2003
2004
2005
2006
2007
2009
2010
2011
2012
2014
2016
2016
2018
2020
2000
2001
2002
2004
2006
2008
2008
2010
2012
2013
2014
2015
2017
2018
2019
2020
2021
[1]
2021 [1] [2]
Increasing Investor
continue to support strongAllocations
asset pricing into
theReal AssetsSource: HouseSource:PriceHouseIndex.PriceTeranetIndex.2000
seniors Teranet Inc., and National Bank. Re-indexed to 100 = January 2000
Inc., and National Bank. Re-indexed to 100 = January 2000
2030
housing space. [1] [1] [2]
BrookfieldInvestor
Increasing estimates Allocations
that institutional investors’
to to Real Assets 2000 [1] 2021
[1]
20302030
[2]
ncreasing Investor Allocations Real Assets 2000 2021
5%
30%
allocations toManagement
[1] Brookfield Asset alternatives, including
2021 Investor real estate, private
Day presentation 40%
Brookfield
rookfieldequity estimates
estimates
and
[2] Including thatthat
not limited institutional
to institutional
but infrastructure, seniors could
housing, reachinvestors’
investors’
life science, 60%
single family by 2030[1].
rentals, 5% 5%
60%
30%
allocations
locations
We also toexpect
alternatives,
to alternatives, real including
estateincluding realreal
alternatives estate,
manufactured housing, student housing, self-storage, data centres,
estate,
[2]
to private
grow private
parking, etc.
as a
30%
70%
40% 40%
equity and infrastructure, could reach 60% by by 2030 . .
[1] 95%
quity proportion
and of the overall
infrastructure, could real
reach estate 60% asset mix.
2030 Net
[1]
60% 60%
WeWe also expect realreal estate alternatives to grow as as a
capital inflows should continue to [2] [2]
support strong
also expect estate alternatives to grow aasset Equity/Fixed Income 70% 70%
Real Assets/Alternatives
95%
pricing
proportion ofin the
the seniors
overall housing
real estate space.asset mix. Net 95%
[1] Willis Tow ers Watson Global Pension Assets Study, 2020
roportion of the overall real estate asset mix. Net [2] Brookfield Asset M anagement estimate
capital
apital inflowsinflows should
should continue
continue to support
to support strongstrong asset asset Equity/Fixed
Equity/Fixed IncomeIncome Real Assets/Alternatives
Real Assets/Alternatives
[1] Brookfield Asset Management 2021 Investor Day presentation
pricing
ricing in in the
the butseniors
seniors to housing
housing space.
space.
[1] Willis Tow ers Watson Global Pension Assets Study, 2020
[1] Willis Tow ers Watson Global Pension Assets Study, 2020
[2] Including not limited seniors housing, life science, single family rentals, [2] Brookfield Asset M anagement estimate
[2] Brookfield Asset M anagement estimate
manufactured housing, student housing, self-storage, data centres, parking, etc.
[1] Brookfield
Brookfield AssetAsset Management
Management 20212021 Investor
Investor Day presentation
Day presentation
[2] Including
Including butlimited
but not not limited to seniors
to seniors housing,
housing, life science,
life science, singlesingle
familyfamily rentals,
rentals,
manufactured
anufactured housing,
housing, student
student housing,
housing, self-storage,
self-storage, data data centres,
centres, parking,
parking, etc. etc.
// 6
graphic-driven trends
phic-driven trends which
which sets
sets upupforfor a recovery
a recovery in in
yery
MACRO
in occupancy
in occupancy maymay
OUTLOOK
notnot
bebe linear
linear forfor
all all communities
communities due
due to to
ects
ts a return
a return to pre-COVID
to pre-COVID national
national occupancy
occupancy (~92.5%)
(~92.5%) by by
026
6 as as We
thethe prime
prime believe
ageage the
85+
85+ sector
cohort
cohort benefits
begins
begins to grow
to grow from strong
exponentially.
exponentially.
demographic-driven trends which sets up
outstrip
utstrip supply
supply
for growth,
agrowth, wewe
recovery inexpect
expect higher
higher
fundamentals rent
rent growth
growth willwill
in the moremore
oght
tight labour
labour markets
markets and
and lingering
lingering costs
costs related
related to mitigating
to mitigating
coming years.
While the recovery in occupancy may not be linear for all
Supply
Supply
& Demand
& Demand
Growth
Growth
communities
450,000
450,000
due to intra-year seasonality in leasing4.5%
trends,
4.5%
C&W projects a return to pre-COVID national occupancy
400,000
400,000 4.0%4.0%
[Supply/Demand Growth]
[Supply/Demand Growth]
(~92.5%)
350,000by early 2024 and further growth to ~95% by
350,000 the
3.5%3.5%
Macro Macro
300,000
end 300,000
of 2026Outlook
as Outlook
the prime age 85+ cohort begins to 3.0%3.0%
[Total Units]
[Total Units]
250,000
250,000 2.5%2.5%
Macro
Macro Outlook
grow exponentially.
Outlook This projection conservatively assumes
We
no believe
200,000
200,000
expansion thethe
We believe
in sector
the benefits
sector
pre-COVID fromfrom
benefits
capture strong
rate. demographic-driven
strong trends
demographic-driven
2.0%2.0%
which
trends sets sets
which up for
upafor
recovery in in
a recovery
150,000
150,000 1.5%1.5%
We believe
fundamental
We the in
fundamental
100,000 believe
100,000
sector
thethe benefits
in coming
the
sector coming from
years.
benefits years.strong
While
from Whiledemographic-driven
the
strong recovery
the recovery in occupancy
demographic-driven
1.0%1.0%
trends
in occupancy which
may
trends not
may sets
whichbe up
be for
linear
notsets afor
upfor
linear recovery
all in in due due
a communities
for all communities
recovery to to
fundamental
intra-year
Over intra-year
fundamental in
the medium-term,
50,000
50,000 the
seasonality coming
seasonality
in the comingin years.
leasing
in
as demand While
leasing
years. trends, theC&W
trends,
While the
is expected recovery
C&Wprojects
to recovery
outstrip in occupancy
projects
0.5%0.5% a return
a to
return may
to not
pre-COVID be
pre-COVID linear
nationalfor all communities
occupancy
national occupancy
in occupancy may not be linear for all communities due to due
(~92.5%)
(~92.5%)to
by by
intra-year
2024 2024 - seasonality
- and
intra-year
supply growth, further
and wefurther
seasonality
expectingrowth
growth leasing
into
higher ~95%trends,
torent
leasing ~95% by
trends,
growth C&W
the
by end
theprojects
C&W
will of
end 2026
of aas
-% 2026
projects
-%
more return
the
a as to pre-COVID
prime
the
return toage
prime age
pre-COVID national
85+ 85+
cohort cohortoccupancy
begins
national to grow
begins
occupancy to(~92.5%)
grow by by
exponentially.
exponentially.
(~92.5%)
20122012 20172017 20222022 20272027
2024 and
2024 further
and thefurther growth
effectsgrowth to ~95% by the end of 2026 as the prime age 85+ cohort begins to grow exponentially.
asto ~95% by the end toof 2026 as the prime age 85+
we cohort begins to grow exponentially.
than offset of increasing inflation due tight
Over the
Over medium-term,
the
Actual
Actual Supplymedium-term,
Supply Forecast
Forecast Supply
Supply demand
as demand
Supply
Supply is expected
Growth
Growth isDemand
expected
Demand to outstrip
Growth
Growth to outstripsupply growth,
supply growth, expect
we expecthigher rent
higher growth
rent will more
growth will more
labour markets and lingering costs related to mitigating
Over
than the
Overthan medium-term,
offset the effects
theoffset the effects
medium-term, as demand
of increasing is
of increasing expected
inflation to
due due
inflation outstrip
to tight supply
labour
to tight growth,
markets
labour we expect
and and
markets lingering higher rent
costscosts
lingering growth
related will more
to mitigating
related to mitigating
the pandemic. as demand is expected to outstrip supply growth, we expect higher rent growth will more
Source:
Source:
Cushman
Cushman
& Wakefiel
& Wakefiel
d ULCdand
ULCCM
and
HCCM
Seniors
HC Seniors
Housing
Housing
ReportReport
impacts from
than
Note: Suppl
offset
impacts
impacts
Note:ySuppl
the
from
and Demand
effects
y and Demand
the
from
Growth
Growth
of
pandemic.
the
represent
increasing
pandemic.
represent
a CAGRa CAGR
since 2011
inflation
since 2011
due to tight labour markets and
than offset the effects of increasing inflation due to tight labour markets and lingering costs related to mitigating lingering costs related to mitigating
impacts
impacts fromfrom the pandemic.
the pandemic.
Average
Average
Average Rent
Rent
Occupancy Rent Growth
Growth
Growth
Forecast
Occupancy Forecast Supply
Supply &&
Supply Demand
Demand
& DemandGrowth
Growth
Growth
Occupancy
4.5%4.5% Forecast Supply & Demand
450,000 Growth
450,000
Supply & Demand Growth
4.5% 4.5%
Occupancy
100.0%100.0% Forecast
4.0%4.0% 95.0%
95.0% 400,000400,000
450,000 4.5%4.0% 4.0%
[Supply/Demand Growth]
[Supply/Demand Growth]
100.0% 450,000 4.5%
100.0% 350,000350,000
400,000 4.0%3.5% 3.5%
3.5%3.5% 90.0%
90.0%
95.0%
[Supply/Demand Growth]
95.0% 400,000 4.0%
[Supply/Demand Growth]
85.0% 300,000300,000 3.0% 3.0%
3.0%3.0% 85.0% 350,000 3.5%
[Total Units]
[Total Units]
90.0% 350,000 3.5%
90.0% 250,000250,000 2.5% 2.5%
Macro Outlook
80.0% 80.0% 300,000 3.0%
85.0%
Macro Outlook
[Total Units]
2.5%2.5%
85.0% 300,000 3.0%
[Total Units]
75.0%
80.0% 75.0% 200,000200,000
250,000 2.5%2.0% 2.0%
2.0%2.0%
80.0% 250,000 2.5%
70.0% 70.0% 150,000150,000 1.5% 1.5%
We We believe
the the sector benefits
fromfrom strong demographic-driv
75.0% 200,000 2.0%
1.5% 75.0%
1.5%
65.0%
70.0% 65.0% believe
100,000
150,000
sector
200,000
100,000 benefits strong demographic-driven 1.5%
2.0%
1.0% 1.0%
1.0% 70.0%
1.0%
60.0% 60.0%
65.0% fundamental
fundamental 50,000
100,000
in the
150,000
in the
50,000 coming
coming years.
years. While
While the the recovery
recovery in occu
in occupan 1.0%
1.5%
0.5% 0.5%
65.0% 100,000 1.0%
55.0%
0.5%0.5% 55.0%
60.0%
60.0%
intra-year
intra-year seasonality
seasonality
50,000 - - in leasing
in leasing trends,
trends, C&W C&W projects
projects a retut
a return 0.5%-% -%
50.0% 50,000 0.5%
0.0% 50.0% 2012 2012 2017 2017 2022 2022 2027 2027
2024 and further growth to ~95% by the end of 2026 as the the
2024 and further growth to ~95% by the end of 2026 as
55.0%
0.0%
55.0%2012 2012
50.0% 20122012
2017 2017 20222022
20172017 2022 2022 20272027
2027 2027 -
2012
-
2017 2022
prim
2027
-%
-%
50.0% Actual
Actual
Actual Actual ForecastForecast
Forecast
Forecast Actual2012
Supply 2017Forecast
Actual Supply Forecast 2022
Supply Supply Supply Growth 2027 DemandDemand
Supply Growth Growth Growth
2012 2017 2022 2027
Source: Source:
Source:
Cushman
2012
Cushman &Cushman
&Source:
Cushman
Wakefiel Wakefiel
& Wakefiel
d ULCdandd Wakefiel
& ULC
ULC
CM and
and
HCCM dCM
HCHC
ULC
Seniorsand Actual
Seniors Housing
CMHousing
Seniors
HousingHC Seniors
ReportReport
2017
HousingForecast
Report Report
2022 2027
OverOver
the the
Source: Cushman
Source:
medium-term,
medium-term,
Actual Supply
&Cushman
Wakefiel
Actual d Wakefiel
&
as demand
as demand
Forecast
ULC and dCM
Supply ULC HCand
Seniors
is Demand
CM HC
expected
is expected
Supply
Housing
Forecast Report
Seniors
Supply
to outstrip
to outstrip
Housing Supply
Growth
Demand Growth
supps
Report Growth
Supply Growth
Actual Forecast
thanthan offset
offset the the effects
effects of increasing
of increasing inflation
inflation duedue to tight
to tight labom
labour
Note: Suppl y andSuppl
Note: Demand Growth
y and represent
Demand Growtharepresent
CAGR since 2011 since 2011
a CAGR
Source: Cushman & Wakefiel d ULC and CM HC Seniors Housing Report Source: Cushman & Wakefiel d ULC and CM HC Seniors Housing Report
Source: Cushman & Wakefiel d ULC and CM HC Seniors Housing Report Source: Cushman & Wakefiel d ULC and CM HC Seniors Housing Report
impacts
fromfrom
the the pandemic.
Note: Suppl y and Demand Growth represent a CAGR since 2011
impacts pandemic.
Note: Suppl y and Demand Growth represent a CAGR since 2011
Capture Rate Rate
Capture Forecast
Forecast Average Rent Rent
Average Growth
Growth
Capture Rate Forecast
Capture Rate Forecast
Occupancy
Average Rent Forecast
4.5% Growth
4.5%Occupancy Forecast S
Supply
Capture
10.0% 10.0% Rate Forecast Occupancy Forecast
Average Rent Growth
4.0% 4.0%
4.5% 450
9.0% 9.0%
10.0% 100.0%
4.5%
100.0%
10.0% 3.5%95.0%
4.0% 3.5% 400
8.0% 8.0%
9.0% 95.0%
4.0%
9.0%
7.0% 7.0%
8.0% 3.0%90.0%
3.5%
90.0% 3.0% 350
8.0% 3.5%
6.0% 6.0%
7.0% 2.5%85.0%
3.0%
85.0% 2.5% 300
[Total Units]
7.0% 3.0%
5.0%
6.0% 5.0% 2.0%80.0%
80.0%
2.5% 2.0% 250
6.0% 2.5%
4.0% 4.0%
5.0% 75.0% 75.0% 200
5.0% 1.5% 1.5%
2.0%
3.0% 3.0% 2.0%
70.0% 70.0%
4.0% 150
4.0% 1.0% 1.0%
1.5%
2.0% 2.0%
3.0% 65.0%
1.5%
65.0% 100
3.0% 0.5%60.0%
1.0% 0.5%
1.0%
2.0% 1.0% 60.0%
1.0%
2.0% 50
0.0%55.0%
0.5% 0.0%
1.0% -% -% 55.0%
0.5%
1.0%
2012 2012 2017 2017 2022 2022 2027 2027 2012 2012 2017 2017 2022 2022 2027 2027
-% 50.0%50.0%
0.0%
0.0%
2012 2012 Actual Actual
ForecastForecast
-%
2012 2017
Actual Actual ForecastForecast
2022 2027 2012 20172017 2017 2022 2022 2022 2027 2027 2027
2012 2017 2022 2027 2012 2017 2022 2027
Source: Cushman
Source:&Cushman
Wakefiel &
d Wakefiel
ULC and dCM HCand
ULC CMActual
Seniors
HCHousing
Seniors HousingForecast
Report Report Source: Cushman
Source:&Cushman
Wakefiel &
d Wakefiel
ULC and dCM HCand
ULC SeniorsActual
CM HC Actual
Housing Actual
Forecast
Report
Seniors Housing Report Forecast
Forecast
Actual Forecast Actual Forecast
Capture rate: Ratio rate:
Capture of the totalofnumber
Ratio of number
the total residents
ofl iving in thel iving
residents survey universe
in the divided
survey bydivided
universe its estimated
by its 75+ popul ation
estimated 75+ popul ation Source: Cushman &dand
Wakefiel d CM
ULC and CM HCHousing
Seniors Housing Report Sou
Source: Cushman & Wakefiel d ULC and CM HC Seniors Housing Report Source: Cushman
Source: & Wakefiel
Cushman d ULC
& Wakefiel ULCCM HC
and Seniors
HC Housing
Seniors ReportReport Source: Cush
Source: Cushman & Wakefiel d ULC and CM HC Seniors Housing Report Source: Cushman & Wakefiel d ULC and CM HC Seniors Housing Report Noty
Note: Suppl
Capture rate: Ratio of the total number of residents l iving in the survey universe divided by its estimated 75+ popul ation
Capture rate: Ratio of the total number of residents l iving in the survey universe divided by its estimated 75+ popul ation
Note: References to time on the x-axis is consistent with the Q1 timing reflected in CMHC’s data collection and reporting cadence
Capture
Capture Rate Rate Forecast
Forecast // 7 AveraA
4.5%
10.0%10.0%
DEVELOPMENT MONITOR
NEW CONSTRUCTION
The key takeaways from our annual update on reported construction starts are as follows:
1. The trend of (historically) lower construction starts holds
• Seniors housing construction activity increased slightly in 2021 but remained at historically low levels, as
developers remain more selective about new projects
• For the 12 months ending December 31, 2021, construction starts represented 2.8% of inventory, up 20 bps from
2020 (2017: 5.5% peak)
• The absolute number of starts (by units) was ~38% lower than the peak construction starts observed in 2017
2. Regional Differences
• Construction activity remains very low in B.C. (2021: starts are 1.2% of inventory; 2020: 2.8%)
and Quebec (2021: 2.1%; 2020: 2.4%) Canada
• Quebec construction has cooled the most ‘peak-to-trough’ vs. other Canadian regions (2018 peak: 6.5%)
Construction Starts as % of Inventory (Units)
• Alberta construction has remained elevated relative to other regions, as a government program to build additional
8.0%
Construction Starts as % of Inventory
subsidized assisted living (DSL) beds is being worked through 7.0%
(2021: 3.6%; 2020: 3.7%)
• Activity in Ontario is increasing, despite rising construction6.0%
costs (2021: 4.6%; 2020: 2.7%). Many of the projects
5.5%
which commenced in 2021 were planned for 2019 but were5.0% delayed last year due to the
4.9%
4.8% pandemic as developers
pressed pause. Some developers are making the decision to move forward with their project pipelines,
4.0% 3.6%
particularly
for projects in primary/secondary markets where rents can 3.0% support the higher capital investment hurdle 2.6%
2.8%
2.0%
3. We expanded the number of constituent companies reported as1.0% part of the ‘C&W Construction Index’ this year, and
stats for prior periods have been restated for the larger sample size.
-% The Index now includes over 60% of total market
2016 2017 2018 2019 2020 2021
supply by units. We note that the ‘C&W Construction Index’ is comprised of the most active developers in the sector,
and therefore sample statistics relating to construction may not be representative of the population data (i.e., total
Metric: Projects which commenced construction in the period (measured by units) as a percentage of the existing units of inventory (Sample based on C&W Construction Index)
market construction starts for 2021 may well be less than 2.8% of inventory) C&W Construction Index sample of market participants has been expanded to over 60% of total market supply for 2021 statistics. Prior periods restated for the expanded dataset
Source: Cushman & Wakefield ULC
Canada
Canada United
United States
States
Construction Starts as % of Inventory (Units) Construction Starts as % of Inventory (Units)
8.0% 8.0%
Construction Starts as % of Inventory
Construction Starts as % of Inventory
7.0% 7.0%
6.0% 6.0%
5.5%
4.9%
5.0% 4.8% 5.0%
4.0% 4.2%
4.0% 3.8%
4.0% 3.6%
3.2%
2.8%
3.0% 2.6% 3.0%
2.1% 2.2%
2.0% 2.0%
1.0% 1.0%
-% -%
2016 2017 2018 2019 2020 2021 2016 2017 2018 2019 2020 2021
Metric: Projects which commenced construction in the period (measured by units) as a percentage of the existing units of inventory (Sample based on C&W Construction Index) Metric: Units under construction as a percentage of the existing units of inventory (Sample based on NIC MAP, All Markets, Seniors Housing)
C&W Construction Index sample of market participants has been expanded to over 60% of total market supply for 2021 statistics. Prior periods restated for the expanded data set Source: NIC MAP® Data Service
Metric:
Source:Projects
Cushmanwhich commenced
& Wakefield ULC construction in the period (measured by units) as a percentage of the existing units of inventory (Sample based on C&W Construction Index) Metric: Units under construction as a percentage of the existing units of inventory (Sample based on NIC MAP, All Markets, Seniors Housing)
C&W Construction Index sample of market participants has been expanded to over 60% of total market supply for 2021 statistics. Prior periods restated for the expanded datasetSource: NIC MAP® Data Service
Source: Cushman & Wakefield ULC
United States
Construction Starts as % of Inventory (Units)
8.0%
of Inventory
7.0%
// 8
6.0%
DESIGN TRENDS
At the onset of the pandemic, many integrated operator/       effective while also meeting new market expectations in a
developer companies shifted their entire focus to             post-pandemic world. Key aspects of this are the ability to
operations to help navigate through the early days of         provide a full range of hospitality and care services in an
the pandemic. As a result, for many organizations land        inclusive environment, all while ensuring a higher level of
acquisition and new construction starts slowed through        resident and staff safety.
most of 2020.
                                                              We anticipate that developers will also look to redesign
In 2021, many developers were able to turn some of            amenities areas as well as incorporate new technology
their attention back to planning and executing on new         throughout the building to give residences the ability to
projects. Developers now face new challenges including        adapt as operating practices evolve. This may include a
significant increases in hard costs, development delays       range of items such as improved air quality and lighting
due to supply chain issues and labour shortages, as well as   controls, better communication and tracking systems and
rapidly rising land costs which further slowed the pace of    a range of new care service items to provide greater
new construction. Developers continue to work within the      support for staff.
narrow confines of ensuring that new residences are cost

                                                                                                                  // 9
NVESTMENT
IInvestment
Investment Market
Investment
MARKET
Overview
Market
Market
Overview
Overview
OVERVIEW
Investment Market Overview
TRANSACTION
Transaction
TransactionActivity
ActivityACTIVITY
Transaction Activity
Transaction Activity
InIncalendar
In calendar
calendar 2020,
2020,
2020, we we we tracked
tracked overover
tracked over
$1.1 $1.1$1.1
billion billion
inbillion
CanadianininCanadian
Canadian seniors
2022. seniors housing
Portfolio housing transaction
transactions transaction dollar
will continue dollar volume,
to volume,
drive down
most of from
down from
InIn
$4.3
$4.3calendar
calendar
billion
billion 2020,
2020,
in the
in the we we
prior
prior tracked
tracked
year.
year. over
Notably,over
Notably, $1.1$1.1
there billion
billion
there wereinin
were Canadian
Canadian
nono major
major seniors
seniors
portfolio
portfolio housing
housing
trades
trades transaction
transaction
thatthat occurred
occurred dollar
dollar in 2020.
in volume,
volume,
2020. Most
Mostdown
downof the
of from
from
the
seniors
$4.3 housing
billion in transaction
the prior dollar volume,
year. Notably, downthere from were no the transaction
major portfolio volume.
trades We
that also think foreign
occurred in sources
2020. of of the
Most
Investment
$4.3
Canadian billion
Canadian
$4.3 billion in
in the
seniors
seniors Market
the prior
prior
housing
housing Overview
year.marketNotably,
market
year. Notably,
participants
participantsthereare
there were noare
were no majorowner/operators
integrated
integrated portfolio
capital owner/operators trades and,
will increasingly play
that
and, occurred
as
a as
such,
rolesuch,
we
in thewe
in 2020.
sawsaw
Canadian
Most
these
these of the
market.
Canadian
Canadian
companies
companies seniors
seniors
devote
devote housing
housing
the the majority market
market
majority participants
participants
of oftheir
their focus are
focus are
on onintegrated
integrated
operations
operations owner/operators
owner/operators
inin2020
2020 rather
rather thanand,
and,
than asas
pursuingsuch,
such,
pursuing we we
new saw
new saw these
these
investments.
investments.
major
companiesportfolio trades that
devote the occurred
majority in 2020. Most of on operations Historically, portfolio trades have accounted forinvestments.
most of
companies
Transaction devote Activity the majority ofof their
their focus
focus on operations inin 2020
2020 rather
rather than
than pursuing
pursuing newnew investments.
the Canadian
Following a seniors
quiet
Following a quiet start to 2021, housing
start to market
2021,
nvestment i
nvestmentparticipants
i market are activity
market activity picked up the
picked Canadian
up
the inse
thein seniors
cond housing
half
second half of of
the investment
year
the year , marked market
, marked by by activity.
Following
In calendar
Following
integrated
major a a quiet
2020,
quiet
owner/operators
investments
major investments by we
bystart
starttracked
to
Blackstone to
and,
Blackstone 2021,
2021, , nvestment
over
nvestment
as i i
$1.1
such,
Ventas billion
weand market
market
saw in Canadian
these
Harrison
, Ventas and Harrison Street. activity
activity
Street. On
As picked
seniors
picked a the
average,
result,up
the
housing
up
As a result,he in
se
he
tin
se cond
transaction
cond
portfolio
total half
half
sales
dollarof of
thethe
dollar year
year
represent
volume
t total dollar volume of Canadian, ,
volume,marked
marked
over
of down
70% by
Canadian by
of
- from
-the total
major
$4.3
major
companies
based
based investments
billion
investments
seniors in
devote
seniors
the
housing prior
theby
housing by
Blackstone
year.
Blackstone
majority Notably,
,
of
transactions
transactions , Ventas
Ventas
their
inin there
focus
2021
2021andand
onwere
nearly Harrison
Harrison no
operations
nearly double major
doubled theStreet.
Street.
d the As
portfolio
As a a
transaction
volume
volume result,
trades
result,ofof he
t he
t
dollarthattotal
total
volume
transactions
transactions dollar
occurred
dollarin volume
in
volume
the
which 2020.
Canadian
which closedof
closedof
Most Canadian
of
Canadian
market
in
0.in -
202
0. -(with
the
202
Canadian
based
based seniors seniors
seniors housinghousing
housing market
transactionsparticipants
transactions in in 2021
2021 are
nearly integrated
nearly double
double d d
theowner/operators
the volume
volume of of and, as
transactions
transactions such, we
which
which
the remainder attributable to single asset deals). Since
saw these
closed
closed in
0. in
0.
202 202
in 2020 rather than pursuing new investments.
We companies
expect todevote
see the the majorityseniors
Canadian of theirhousing
focus on transaction
operations inactivity
2020 rather
and than
overall pursuing new investments.
We expect to see the Canadian seniors housing transaction 2001, activity
of the and
~$40 billion momentum
overall continue
in momentum
continue
Canadian toincrease
seniors toincrease
housing assets
We
in We
2022
in expect
expect
2022. . to
Portfolio tosee
Portfolio see
thethe Canadian
Canadian
transactions
transactions will seniors
seniors
continue
will continue housing
housing
to drive
to most
drive transaction
transaction
most of the
of the activity
activity
transaction
transaction and and
volumeoverall
overall
.
volume We
. We momentum
momentum
also
also continue
continue
think
think to
foreign to
foreignincrease
increase sources
sources
Followingaaquiet
Following quietstart starttoto 2021,
2021, nvestment
i
investment market
marketactivityactivity picked up
thein
which se cond
have half of
transacted, the yearover , marked
40% of the by volume can be
of in
inmajor2022
2022
capital
of capital . Portfolio
. investments
Portfolio
willwill transactions
transactions
increasingly
increasingly will
playwill
role
play acontinue
continue
role in
a the
in the to to
Canadian drive
drive
Canadianmostmost of ofthe
the
market.
market. transaction
transaction
Historically,
Historically, volume
volume
portfolio
portfolio. . We
We tradesalso
also
trades think
think
have
have foreign
foreign
accounted
accounted sources
sourcesfor
for
picked up in the secondby
Blackstone
half of ,the
Ventas year, and
marked Harrison
by Street.
major As a attributed
result,he t total
to the dollar
largest volume
15 of Canadian
transactions, - demonstrating
of
ofbased
most
most capital
capital
oftheof the will
will
Canadian
seniors
increasingly
increasingly
Canadian
housing seniors
seniors play
play
transactions rolerole
housing a
housinga
in in
the the Canadian
Canadian
investment
investment market.
market.
market
activity
market Historically,
Historically,
activity. On. On average,
average, portfolio
portfolio
portfolio
portfolio trades
trades sales
saleshave
haverepresent accounted
accounted over
0. 202The market is 70%
represent over for
for
70%
investments
most of the by Blackstone,
Canadian Ventasin
seniors and2021
housing
nearlydouble
Harrison Street.
investment
d As
the volume
market
activity
of transactions
the. concentration
On average,
which
inportfolio closed in
larger ‘mega-deals’.
sales represent over 70%
most
of the
of of
the the
totaltotal Canadian
transaction
transaction seniors
dollar
dollarhousing
volume
volume investment
inin thethe Canadian market
market
Canadianactivity
market . Onthe
(with
(with average,
theremainder
remainderportfolio sales represent
attributable
attributable toto single
single over
asset 70%
asset
aWe
result,
expect the total
to see dollar
the volume
Canadian of
seniorsCanadian-based
housing seniors
transaction also
activity increasingly
and overall appealing
momentum
continue to investors
to
increase based outside of
ofof the
deals). the
deals). total
total
SinceSince transaction
transaction
2001,2001, ofof thethe dollar
dollar
~$40
~$40 volume
volume
billion
billion inin the
in the
Canadian
Canadian Canadian
Canadian market
market
seniors
seniors(with
(with the
housing the
housing remainder
remainder
assets
assets which attributable
attributable
which have
have toto
transacted,
transacted,single
single asset
asset
over
over 40%
40% ofof
in 2022
housing
deals). . Portfolio
transactions
Since transactions
2001, in 2021
of the will continue
nearly
~$40 doubled
billion to drive
the most
volume ofthe
of transaction
Canada, volume
with . We
foreign also think
capital foreign
accounting sources
for over 28% of the of
deals).
thethe volume Since
volume can2001,
can be be ofattributed
the
attributed ~$40 to billion
tothe the inin
largest
largest Canadian
Canadian
15 seniors
seniors
transactions
15 , demonstrat
transactions
, demonstrat housing
housing ing the
ing assets
assets
the concentrati which
which
concentrati on onhave
have
in larger
in transacted,
transacted,
larger ‘mega -
‘mega - over
over 40%
40% of
of capital
transactions
the volume will increasingly
which
can closed
be in play
attributed role
2020. a to in thethe Canadian
largest market.
15 Historically,
transactions
, demonstrat portfolio
dollar volume ing over
the trades
the past
concentratihave20 onaccounted
years
in and for
larger over
‘mega 35%
- of the
the
deals’.volume
deals’.
most The
of The
the
can
market
market
Canadian
be attributed
is seniors
also
is also to
increasingly
increasingly the
housing investment
largest
appealing 15
appealing transactions
markettoto,
activity
demonstrat
investors
.investors
Onvolume
average,
ing
based
basedthe concentrati
outside
outside
portfolio ofof
sales
on
Canada,in
Canada,
represent
largerwith ‘mega
with
over
-
foreign
foreign
70% capital
capital
deals’.
deals’. The The market
market is is
alsoalso increasingly
increasingly appealing
appealing toto investors
investors since
based
based 2011.
outside We
outside predict
of of these with
Canada,
Canada, trends
with will continue
foreign
foreign capital
capital
accounting
accounting forfor overover 28%28% of the
of
of the total transaction dollar volume in the Canadian the dollar
dollar volume
volume overover the thepast
past 20 20 years
years and and
market (with the remainder attributable to single asset over
over 35% 35% of ofthe the volume
volume We since
Wesince2011.
2011.
We expect
accounting
accounting to see
forfor the
overover Canadian
28%28% of
of the seniors
the dollar housing
dollar volume transaction
volume over
over the over
thehousingpast the
past 20assets20 next
years decade.
yearswhich and
and over over 35% of the volume Wesince 2011.
predict
predict
deals). these
these
Since tren
ds
2001,tren
dswill
ofwillcontinue
the continue
~$40 over
billion over the
in the next
next
Canadian decade.
decade.
seniors have 35% of the over
transacted, volume 40% Wesince
of 2011.
predict
activity
predict
the volume
and these
these overall
cantrentren
ds ds
bewill will
momentum continue
continue
attributed
continue
to the over
over to the
the next
largest next
increase indecade.
decade.
15 transactions
, demonstrat ing the concentrati on in larger ‘mega -
deals’. The market is also increasingly appealing to investors based outside of Canada, with foreign capital
Transaction
accounting
Transaction Dollar
Dollar
Transaction Dollar Volume
for Volume
over 28% of the dollar volume over the past 20 years and
Volume Transaction
over 35%
Transaction of Composition
the volumeWe
Composition
Transaction Composition since 2011.
Transaction
predict
Transaction
[$mm]
[$mm] Dollar
these Volume
Dollartren
ds will continue over the next decade.
Volume Transaction Composition
Transaction Composition
$6,000
[$mm]
$6,000
[$mm]
$6,000
$6,000
$5,000
$5,000
Transaction
$5,000
Dollar Volume Transaction Composition
$5,000 26%26%
[$mm]
$4,000
$4,000 26%
$6,000 26%
$4,000
$4,000
$3,000
$3,000
$5,000
$3,000
$3,000 26%
$4,000
$2,000
$2,000
$2,000
$2,000 74%74%
$3,000
$1,000
$1,000 74%
74%
$1,000
$1,000
$2,000
- -
74%
- -2007 2008
2007 2009
2008 2010
2009 201120112012
2010 2013
2012 20132014
20142015 2016
2015 2017
2016 2018
2017 2019
2018 2020
2019 2021
2020 2021
$1,000
2007 2008 2009 2010 20112012
2012 20132014
2014 20152016
2016 20172018
2018 2019 2020 2021 Portfolio Individual
Portfolio Individual
2007 2008 2009 2010 2011 Portfolio
2013 Individual
Portfolio Individual
2015 2017 2019 2020 2021
Portfolio
Portfolio Individual
Individual
Portfolio
Portfolio Individual
Individual
-
Transaction
Transaction Dollary Volume
Dollary byby
Volume Sources
2007 2008 2009 2010 2011
Sources of of
Buyer
2012
Capital
2013 2014 2015 2016 2017 2018 2019
Buyer Capital
2020 2021
Sources of
Sources Buyer
of Buyer Capital: 2007
Capital: to to
2007 2021
2021
Transaction Dollar
Dollary Volume
Volume by
by Sources
Portfolio
Transaction Dollary Volume by Sources of of
Transaction Sources of
Individual Buyer
Buyer Capital
Capital Sources of
Portfolio
Sources Buyer
Individual
Capital: 2007 to 2021
% of
%
100%
Total
of Total Buyer Capital Sources of of Buyer
Buyer Capital:
Capital: 2007
2007 to to 2021
2021
%100%
of Total
% of Total
100%
Transaction Dollary Volume by Sources of Buyer Capital
100%
90% 90% Sources of Buyer Capital: 2007 to 2021
% 90%
of Total
90%
80% 9% 9%
80%
100%
80%
70%
80%
90% 9% 9%
70%
70% 70%
80% 9%
60% 60%
60%
70% 26%26% 46%46%
60%
50% 50%
26%26% 46%
50% 50%
60% 46%
40% 40%
26% 46%
50%
40%
40%
30% 30%
40%
30% 30%
20% 20%
30%
20% 19%19%
20%
10% 10%
20%
10% 19%19%
10%
0% 19%
0%
10%
0%0% 0%2007 2008
2007 2009
2008 2010
2009 201120112012
2010 2013
2012 2014
2013 201420152015201620162017 2018
2017 2019
2018 2020
2019 2021
2020 2021
REIT Pension Institutional Private REIT
REITPension
PensionInstitutional Private
Institutional Private
20072007 2008
2008 2009
2009 2010
2010 20112011
REIT 2012
2012 20132014
Pension
2013 2014 20152016
Institutional
2015 2016 20172018
Private
2017 20182019
20192020
2020 2021
2021
2007 2008 2009 2010 2011 2012 2013 2014 2015 2016 2017 2018 2019 2020 2021 REIT Pension
PensionInstitutional
Institutional Private
REIT Pension
PensionInstitutional
Institutional Private REIT Private
Compiled by by
Compiled Cushman
Cushman& Wakefield
REIT
& Wakefield
REIT ULC
ULC
Pension Private
Institutional Private REIT Pension Institutional Private
Compiled by Cushman & Wakefield
Compiled by Cushman Wakefield ULC
Compiled by Cushman & Wakefield ULC ULC
// 10You can also read


