Sessione 1.3 Vulcani e geotermia - Istituto Nazionale di Oceanografia e di ...
←
→
Page content transcription
If your browser does not render page correctly, please read the page content below
GNGTS 2019

      sessione 1.3

   Vulcani e geotermia

Convenor: M. Palano e M. Viccaro

GNGTS 2019                                                                                              Sessione 1.3

THE MT. ETNA 2018 FLANK ERUPTION: SEISMOLOGICAL INVESTIGATIONS
AND NEW INSIGHTS ON THE VOLCANO FLANKS DYNAMICS
S. Alparone, G. Barberi, E. Giampiccolo, V. Maiolino, A. Mostaccio, C. Musumeci, A. Scaltrito, L. Scarfì,
T. Tuvè, A. Ursino
Istituto Nazionale di Geofisica e Vulcanologia, Sezione di Catania, Osservatorio Etneo, Italy

    Introduction. On December 24, 2018 an intense seismic sequence, starting at 08:30 UTC,
preceded and accompanied the beginning of a flank eruption at Mt. Etna volcano, about ten
years after the last 2008-2009 flank eruption. Simultaneously, a strong increase in the volcanic
tremor amplitude was recorded. The seismicity associated with the eruption (December 24-25,
2018) took place mainly during the first 24 hours. It accompanied the intrusion of a magmatic
dyke and the opening of the eruptive fracture in the summit area. The main evidences that
came out from the analysis of the space-time distribution of the seismicity reveal that the first
cluster of events was located beneath the summit craters and along the eruptive fracture with
epicentres aligned in a N-S direction. Then, seismicity migrated towards south and southeast, as
a probable response of the medium to the incoming intrusion. Following, the bulk of seismicity
moved towards the western wall of the Valle del Bove (VdB), in concomitance with the increase
in the volcanic tremor amplitude. The seismicity which followed the main eruptive episode
(December 26, 2018-February 28, 2019) affected the eastern and southwestern flanks of the
volcano. The most energetic event (ML =4.8), recorded on December 26 at 02:19 UTC, was
located just below the sea level in the middle eastern flank of the volcano, along the Fiandaca-
Pennisi Fault (FPF), a seismogenic structure belonging to the Timpe Fault System (TFS).
Following December 26, the seismic sequence decreases dramatically in terms of daily events
and magnitude. On January 8, at 23:50 UTC, a ML=4.1 earthquake occurred in the northern
sector of the volcano, along the Pernicana Fault System (PFS), one of the most active and well-

Fig. 1 - Map and W-E cross sections of the 3D locations of earthquakes (ML≥1.1) located (a) before (October
2017-December 23, 2018), (b) during (December 24-25, 2018) and (c) after the period of particularly intense eruptive
activity (December 26, 2018-February 28, 2019). Different colors are used to indicate an upper crustal (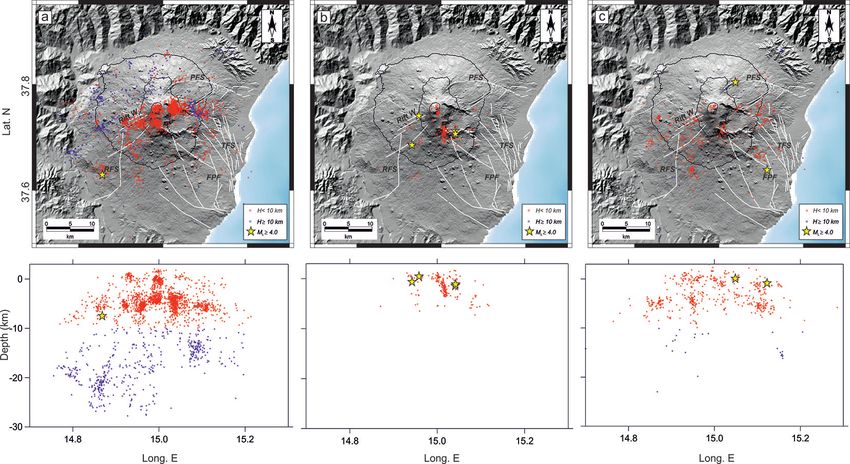
GNGTS 2019                                                                                           Sessione 1.3

defined tectonic structures at Mt. Etna, bordering the northern limit of the sliding eastern flank
of the volcano.
    In this work, we performed a careful analysis of seismicity and focal mechanisms collected
during about 1-yr interval encompassing the 2018 eruption (October 2017-February 2019) for
the purpose of: i) characterizing and interpreting the space-time evolution and kinematics of the
seismicity; ii) giving insights into the stress field; iii) investigating the relationship between the
eruption and the dynamic of the southern and eastern flanks of the volcano.
    Data analysis and results. A
total of 3200 seismic events with
ML ≥1.1, recorded in just over a
year (October 2017-February 2019)
by the INGV-OE seismic permanent
network deployed in the Mt. Etna
area, were used as data source for
this study (Gruppo Analisi Dati
Sismici, 2019). Specifically, we
calculated 3D locations of the
events (Fig. 1) and computed 77
fault plane solutions (FPSs) of the
most energetic events (ML≥2.3).
The computed FPSs show mainly
strike slip faulting (62%) over
most of the region during the pre-
and post-eruptive periods, normal
dip-slip ruptures (29%) during the
eruptive period, only a few events
(9%) are of reverse faulting type.
Interestingly, the P (maximum Fig. 2 - Horizontal projections of P-axes before (white lines), during
compression) axes of the focal (red lines) and after (blue lines) the eruption (see text for details);
mechanisms, particularly those yellow dashed lines show the location of the modelled sources by
related to the pre-eruptive period Bonforte et al. (2019).
(white in Fig. 2), are arranged
radially with respect to a probable pressurization sector, located to the south of the Central
Craters.
    Following, a standard numerical technique (Gephart and Forsyth, 1984) has been applied to
invert the 77selected FPS and determine the principal stress axes (σ1, σ2, σ3).
    The results of the present study gave new insights about the dynamic processes affecting
the instability of Mt. Etna edifice and provide important information for any hazard evaluation
deriving from these processes.
    In particular, the unrest was heralded few months before the beginning of the eruption,
as shown by the distribution of hypocenters, P-axes radially oriented around a probable
pressurization sector to the south of the Central Craters and σ1 W-E oriented. During the
eruption the magma intrusion caused significant ground deformation and redistribution of stress
on the neighboring faults. After the eruption both the space-time distribution of most energetic
earthquakes, following a temporal anti-clock wise rotation, and a σ1 trending NE-SW shed light
on the dynamic processes affecting the instability of Mt. Etna volcano. In this perspective any
flank eruption could temporarily enhance the sliding process of both the southern and eastern
flanks of the volcano.
References
Bonforte A., Guglielmino F. and Puglisi G.; 2019: Large dyke intrusion and small eruption: The December 24, 2018
   Mt. Etna eruption imaged by Sentinel-1 data. Terra Nova, 1-8, https://doi 10.1111/ter.12403.

168
GNGTS 2019                                                                                                     Sessione 1.3

Gephart J.W. and Forsyth D.W.; 1984: An improved method for determining the regional stress tensor using earthquake
    focal mechanism data: Application to the San Fernando earthquake sequence. J. Geophys. Res., 89, 9305-9320.
Gruppo Analisi Dati Sismici; 2019: Catalogo dei terremoti della Sicilia Orientale - Calabria Meridionale (1999-
    2019). Available at: http://www. ct.ingv.it/ufs/analisticatalogolist.php.
Neri M., Casu F., Acocella V., Solaro G., Pepe S., Berardino P., Sansosti E., Caltabiano T., Lundgren P. and Lanari R.;
    2009: Deformation and eruptions at Mt. Etna (Italy): a lesson from 15 years of observations. Geophys. Res. Lett.,
    36, L02309. http://dx.doi.org/10.1029/2008GL036151.

INNOVATIVE PERSPECTIVES FOR THE ASSESSMENT OF LOW-ENTHALPY
GEOTHERMAL POTENTIAL IN VOLCANIC AREAS:
A CASE STUDY FROM SALINA ISLAND (AEOLIAN ARC)
G. Floridia1, M. Viccaro1,2
1
    Università di Catania, Dipartimento di Scienze Biologiche Geologiche e Ambientali - Catania, Italy
2
    Istituto Nazionale di Geofisica e Vulcanologia – Sezione di Catania, Osservatorio Etneo - Catania, Italy

    Introduction. During the last years, the interest towards modern concepts of energy
efficiency leads to the exploitation of alternative resources and innovative methods of energy
production. In this regard, the interest toward geothermal resources is continuously increasing
and entirely represents this new perspective. Sicily represents one of the most interesting geo-
hydro-thermal sites of Southern Italy, which could offer exploitation of geothermal resources
from low to medium-high enthalpy. The geological and hydrogeological setting of the island
put into evidence how most of the territory is affected by a low-to-moderate thermal regime;
it makes the area as one of the most suitable contexts where geothermal resources could have
great potential to increase their whole usage. Furthermore, several active volcanic zones or
areas at high hydrothermalism offer advantageous exploitation from low to high enthalpy
geothermal resources. The case study is based on a detailed field survey providing information
on lithostratigraphic features and on hydrogeological conditions of the area of Santa Marina
Salina (Salina Island, Aeolian Island Arc) and is aimed at testing the thermal conductivity
distribution at various depths by means of a theoretical model. Collected data become crucial
for the definition of different conductivity gradient maps leading to the evaluation of the most
suitable areas and their low-grade geothermal potential.
    Methodology. Objectives of the fieldwork are aimed at recognizing lithotypes and
reconstructing the vertical stratigraphic successions of the first 100-150 meters in the area of
the town hall of Santa Marina Salina.
    The presence of terrains belonging to four volcanic complexes has been established during
the field survey: Rivi, Capo, Monte Fossa delle Felci and Porri. Although the investigated area
was mainly affected by the activity of only two of the above-mentioned eruptive centres (i.e.,
the Rivi-Capo complex and Monte Fossa delle Felci), volcanic deposits belonging to the Porri
volcano complex have been identified in some sectors. The chrono-stratigraphic reconstruction
allowed a detailed interpretation of the volcano-tectonic mechanisms leading to the current
morphology, together with a detailed definition of stratigraphic relationships. All this considered,
a detailed geological map of the area has been outlined in order to define a geological model
for the subsoil (Fig. 1).
    Despite the en2ironmental-friendly energy systems are solar thermal technologies,
photovoltaic and wind power, other advantageous technologies exist, although they have not
found wide development in countries such as Italy.
    Given the almost absent environmental impact and the rather favorable cost/benefit ratio,
                                                                                                                      169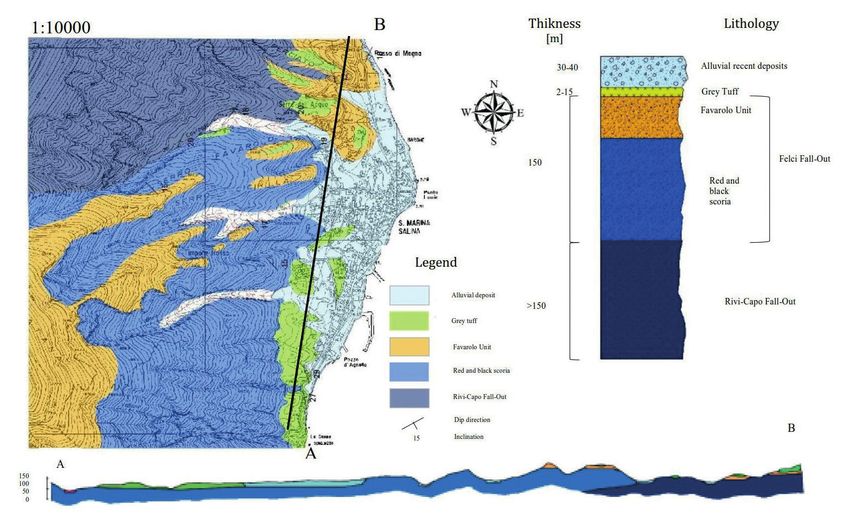
GNGTS 2019                                                                                                 Sessione 1.3

Fig. 1 - Geological map, litho-stratigraphic configuration and geological subsoil model of the investigated area of the
Salina Island.

low-enthalpy geothermal systems are, however, likely to be of strategic importance also in Italy
during the next years.
    The importance of geology for a sustainable exploitation of the ground through geothermal
systems from low-grade sources is becoming paramount. Specifically, understanding of the
lithological characteristics of the subsurface along with structures and textures of rocks is
essential for a correct planning of the probe/geo-exchanger field and their associated ground
source heat pumps. The complex geology of Eastern Sicily (Southern Italy), which includes
volcanic, sedimentary and metamorphic units over limited extension, poses the question of how
thermal conductivity of rocks is variable at the scale of restricted areas (even within the same
municipality). This is the innovative concept of geothermal microzonation, i.e. how variable is
the geothermal potential as a function of geology at the microscale. Some pilot areas have been
therefore chosen to test how the geological features of the subsurface can influence the low-
enthalpy geothermal potential of an area. Our geologically based evaluation and micro-zonation
of the low-grade source geothermal potential of the selected areas have been verified to be
fundamental for optimization of all the main components of a low-enthalpy geothermal system.
Saving realization costs and limiting the energy consumption through correct sizing of the
system are main ambitions to have sustainable development of this technology with intensive
utilization of the subsurface. The variegated territory of countries such as Italy implies that
these goals can be only reached if, primarily, the geological features of the shallow subsurface
(i.e. chemical-physical characteristics of rocks and fluids of the first 100 m below the ground)
are appropriately constrained.
    The importance of getting geological information for a sustainable exploitation of the
subsoil through geothermal systems from low-enthalpy resources is significant (Moeck, 2014).
Understanding of the lithological characteristics of the ground, along with the hydrogeological
context is essential for a correct planning of the probe field allowing the geo-exchange
(Hellstrom, 1998).
    One of the most important parameters for determining the subsoil heat exchange is the
170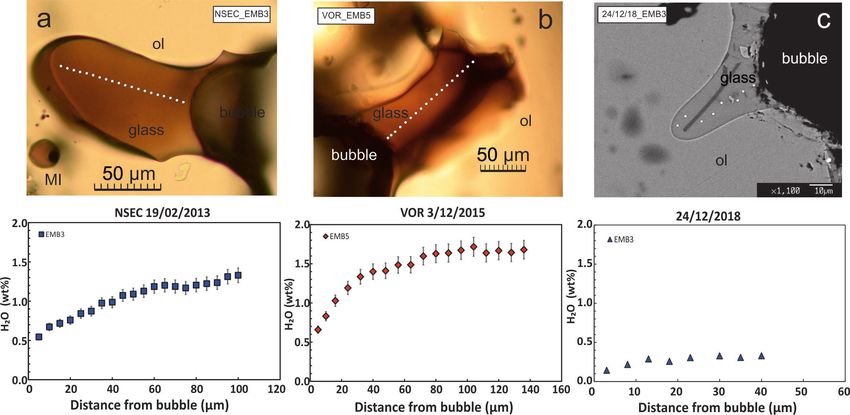
GNGTS 2019                                                                                Sessione 1.3

thermal conductivity of terrains that generally shows high variability, ranging from about 1
up to 6 W/mK. The variegated lithologies of the island of Salina are characterized by rocks
variable in their nature, different structures and textures of deposits and therefore porosity,
presence of organic particles, degree of water saturation, which all together strongly influence
their thermal characteristics. In support of a preliminary feasibility studies for the direct use of
low enthalpy geothermal energy, it was therefore necessary to fix relationships between rock
types and their thermal conductivity.
    According to the characteristics of rocks investigated during the geological field work,
values of thermal conductivity for the identified lithotypes have been obtained.
    The empirical method we have taken into account in this work considers thicknesses of
the lithostratigraphic units and the thermal conductivity for each type of lithology investigated
(Jorand et al., 2015). Evaluations on these rock types have led us to fix an average thermal
conductivity value for each analysed lithology. The recent alluvial deposits come from
dismantling of upstream deposits and occupy a large part of the investigated area. They are
characterized by heterogeneous and altered material. The low degree of cementation, high
porosity and absence of pore water have led to the estimation of their thermal conductivity
between 0.7 and 1 W/mK. The deposit underlying the epiclastic material is referred to the Grey
Porri Tuff unit. It is characterized by a fine matrix (mm-sized) with some coarse elements (cm-
sized) with a general low degree of cementation. Values of thermal conductivity have been
estimated considering the degree of water saturation of volcanic tuffs, which ranges from very
low values (0.5-1 W/mK) for dry tuffs up to 2.3 W/mK for wet tuffs. In our case, values of
thermal conductivity for tuffs are consistent to those of dry tuffs, being water not present (0.5-1
W/mK). Deposits underlying the Grey Porri Tuff are those referred to the Strombolian activity
of the Rivi-Capo complex and the Fossa delle Felci, which have rather basic compositions,
grain size and degree of cementation consistent with those of volcanic pyroclastic materials
having thermal conductivity ranging from 1.1 W/mK to 1.5 W/mK. The potential presence
of water would be relevant in modifying the final thermal conductivity, being this affected
positively in porous materials saturated with water. In the investigated area, the presence of
water in deposits at the surface is irrelevant, but interaction with sea water for layers beneath
the sea level cannot be excluded due to the proximity to the shoreline.
    Results and discussion. In this study, the detailed field survey allowed us to get information
on lithological/lithostratigraphic features and their spatial distribution, putting into evidence
important variations of thermal conductivity. This suggests that small-scale variations can
affect significantly the final value of thermal conductivity, indicating that studies aimed at
constraining the geothermal micro-zonation are of great impact.
    To assess the thermal potential from low enthalpy resources of the area, the production
of thematic maps concerning the thermal conductivity variation of the analysed lithologies
and their 3D development in the subsoil has been realized. The used method to get this type
of representation is based on the relationships between the geothermal characteristics of the
explored geological units and their relative thickness. According to an empirical model for
the calculation of thermal conductivity, based on the intrinsic characteristic of materials, an
average thermal conductivity value, which is function of the thickness for each lithology, has
been adopted for each sector. Consequently, a detailed mapping of the thermal conductivity
fluctuations has been carried out for depths between 50 m and 150 m (Fig. 2).
    Maps of the thermal conductivity variation put into evidence the significant influence of
alluvial deposits for the first 50 m of the succession, reflecting the alluvial fan shape. The
thematic cartography shows a remarkable contribution of volcanic terrains for the depth range
100-150 m, which finally imply the increase up to the maximum extractable thermal energy in
the investigated area.
    The most important aspect of this study is the extrapolation of specific thermal conductivity
data for a very narrow area, which leads to the innovative concept of geothermal micro-zonation.
                                                                                                 171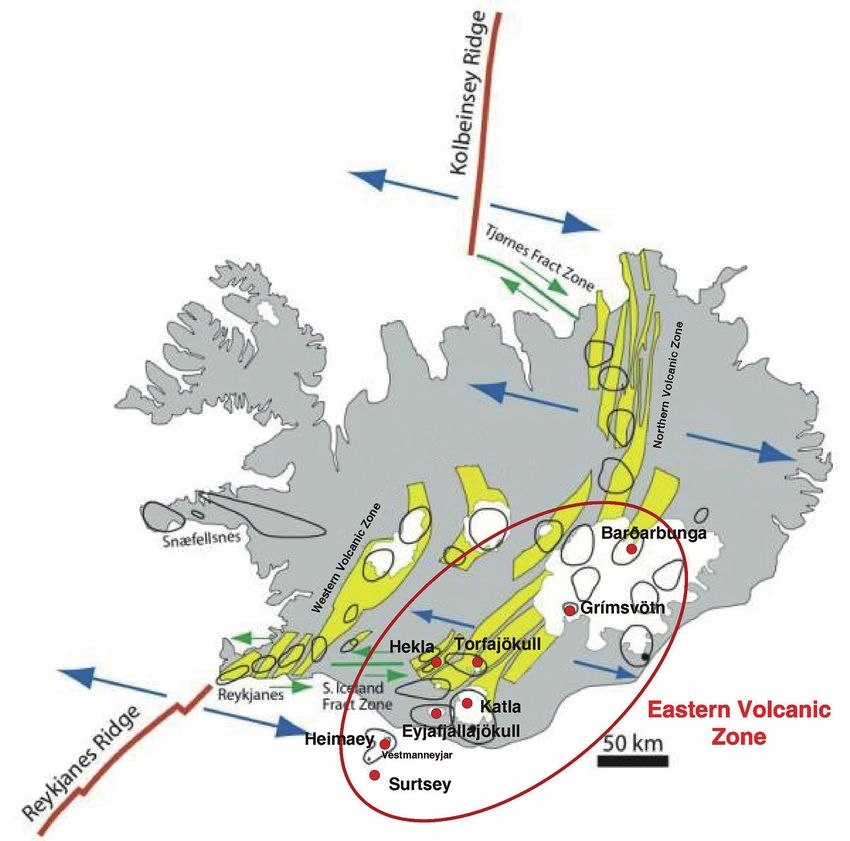
GNGTS 2019                                                                                           Sessione 1.3

Fig. 2 - Map of the geothermal potential (W/mK) for the studied area from 0 to 150 m depth (1:2000). a) 0-50 m in
depth; b) 50-100 m in depth; c) 100-150 m in depth.

The idea principally starts from the needing of data networking useful for the optimization of
low enthalpy geothermal systems. Indeed, the creation of detailed geothermal mapping based
on petrological (lithotypes, mineralogical structures and textures), geochemical (fluid) and
petrophysical (thermal conductivity) characterization is the only way for obtaining reliable
information on thermal characteristics of the subsoil (Viccaro et al., 2016). These maps have
the advantage to provide immediate information on the most suitable depths for the installation
of geothermal probe systems (Claessonj and Eskilson, 1987).
    Results furnished for several lithologies investigated in this work have been also used for
evaluations of the physical properties useful for the direct use of low-grade geothermal energy,
emphasizing the fundamental role played by the lithology, structural and textural characteristics
of the rocks on the final thermal conductivity of a layer.
    Geological and structural field work combined with thermal data of the subsoil have been
established to be fundamental for the optimization of a direct use power system for a specific
building in Santa Marina Salina. Understanding of the lithological characteristics of the
subsurface, along with petrographic characteristics of rocks, revealed to be essential for the
correct planning of the probe (geo-exchanger) field and the associated ground source heat pump
(Tab. 1).

Tab. 1 - Low enthalpy power plant dimensioning.

                                        Geothermal Heat Exchanger
                    Maximum extraction per GHE [kW]                                             6
                     Maximum insertion per GHE [kW]                                             7
                        Appropriate number of GHE                                               5
                               GHE Depth [m]                                                  125
                              Drilling meter [m]                                              625

    This innovative approaches to the evaluation of low-grade geothermal resources could be
certainly applied to other geological contexts and could increase the penetration degree into still
reluctant markets - like in Italy - towards this type of renewable energy.
References
Claessonj Eskilson P 1987 Conductive heat extration to a deep borehole: Thermal analyses and dimensioning rules
    (University of Lund, Sweden).
De Astis G Ventura G Vilardo G 2003 Geodynamic significance of the Aeolian volcanism (Southern Tyrrhenian Sea,
    Italy) in light of structural, seismological, and geochemical data Tectonics vol 22 issue 4.

172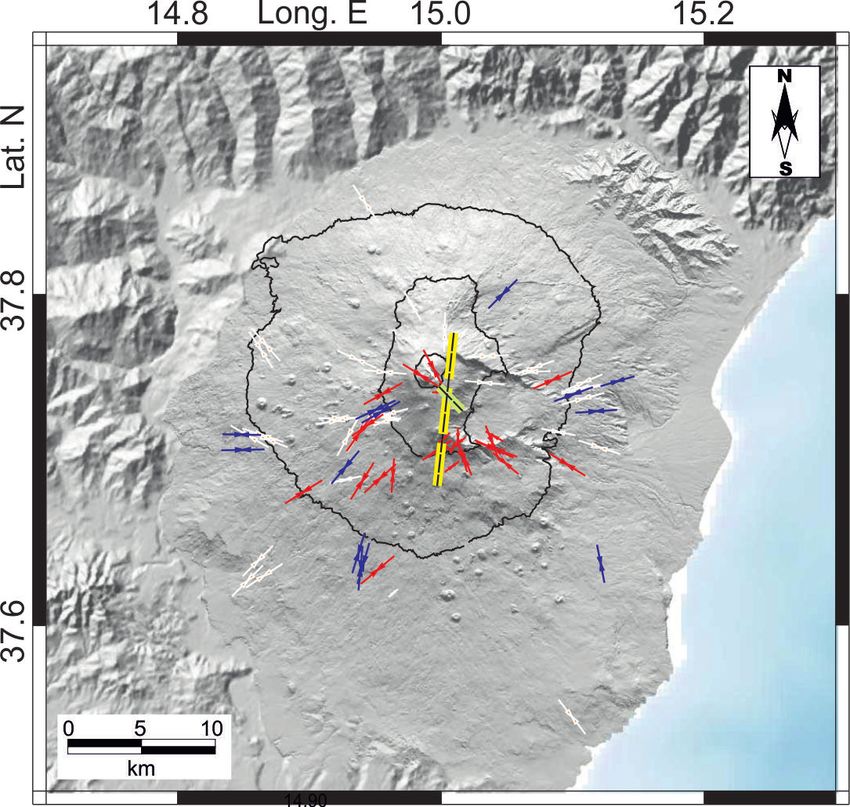
GNGTS 2019                                                                                                    Sessione 1.3

De Ritis R Ventura G Chiappini M 2007 Aeromagnetic anomaliesreveal hidden tectonic and volcanic structures in
    the central sector of the Aeolian Islands, southern Tyrrhenian Sea, Italy Journal of Geophysic Research 112 B 10.
Di Sipio E Chiesa S Destro E Galgaro A Giarretta A Gola G Manzella 2013 A rock thermal conductivity as key
    parameter for geothermal numerical models EGU General Assembly.
Hellstrom G 1998 Thermal Performance of borehole heat exchangers International Geothermal Conference (Stockton).
Jorand R Clauser C Marquart G 2015 Pechnig R Statistically reliable petrophysical properties of potential reservoir
    rocks for geothermal energy use and their relation to lithostratigraphy and rock composition: The NE Rhenish
    Massif and the Lower Rhine Embayment (Germany) Geothermics Journal vol 53 pp 413-428.
Moeck I 2014 Catalog of geothermal play types based on geologic controls Renewable and Sustainable Energy
    Reviews vol 37 pp 867-882.
Piromallo C Morelli 2003 A P wave tomography of the mantle under the Alpine-Mediterranean area Journal of
    Geophysic Research vol 108 NO B2.
Viccaro M Pezzino A Belfiore G M and Campisano C 2016 The significance of “geothermal microzonation” for the
    correct planning of low-grade source geothermal systems Geophysical Research Abstracts vol 18 EGU General
    Assembly (Vienna, Austria).

RELAZIONE SPAZIO-TEMPORALE DEI PROCESSI DI STOCCAGGIO E
TRASFERIMENTO DEI MAGMI LUNGO LA EASTERN VOLCANIC ZONE, ISLANDA
F. Furia1, M. Giuffrida1, M. Viccaro1,2
1
    Università di Catania, Corso Magistrale di Scienze Geofisiche, Catania, Italy
2
    Istituto Nazionale di Geofisica e Vulcanologia – Sezione di Catania, Osservatorio Etneo, Catania, Italy

    Introduzione. Il lavoro mira a definire le relazioni spaziali e temporali dei reservoir
magmatici presenti lungo la Eastern Volcanic Zone (EVZ), derivando in particolare la natura
e le scale temporali dei processi di stoccaggio e trasferimento dei magmi anche in funzione
del ruolo delle strutture tettoniche. Le profondità dei reservoir magmatici che costituiscono i
sistemi di alimentazione dei principali sistemi vulcanici lungo la EVZ sono state definite sulla
base di dati petrologici e geofisici da letteratura. I tempi di trasferimento del magma sono
stati definiti mediante modelli di diffusione di Fe-Mg in cristalli di olivina, correlandoli ove
possibile con dati geofisici relativi alla migrazione del magma nella crosta.
    Inquadramento geologico e strutturale dell’Islanda. L’Islanda è l’espressione subaerea
della Dorsale Medio-Atlantica (Mid Atlantic Ridge; MAR), la quale divide le placche Nord-
Americana da quella Euroasiatica. Il contesto di divergenza è reso più complesso dalla probabile
interazione con strutture mantelliche profonde (ad es., un plume mantellico) che sono state
rilevate attraverso tomografia nel settore settentrionale dell’Oceano Atlantico (Foulger 2010).
In queste zone, il movimento relativo tra le placche è circa ~18-20 mm/anno. In Islanda, i
segmenti della MAR determinano lo sviluppo di alcune zone neovulcaniche (
GNGTS 2019                                                                                               Sessione 1.3

Fig. 1 - Andamenti delle principali strutture tettoniche che caratterizzano l’Islanda (Neovolcanic Zones). Per quanto
concerne la Eastern Volcanic Zone sono riportati i sistemi vulcanici oggetto di questo studio.

    Relazioni spaziali dei reservoirs magmatici lungo la EVZ. Le profondità dei reservoir
magmatici sono state vincolate mediante dati di letteratura da diversi autori sui sistemi vulcanici
trattati lungo la EVZ. La rappresentazione grafica di questi dati è presentata in Fig. 2.
    Nel settore meridionale della EVZ, le isole Vestmanneyjar (specificatamente Surtsey ed
Heimaey) possiedono sistemi di alimentazione con reservoirs che si spingono fino a 30-35 km
di profondità associati ad altri più superficiali a 20 km e tra 10-15 km, identificati mediante
metodi sismici e magneto-tellurici (Gebrande 1980; Mattsson 2005). In questa zona della EVZ,
Mattsson (2003) ritiene che la Moho giace a circa 22 km di profondità.
    L’Hekla si trova a ridosso dell’intersezione tra la EVZ e la SISZ. Geirsson (2012), mediante
uno studio sulla deformazione della superficie del vulcano, assume che la sorgente profonda
che alimenta l’attività giace a circa 24 km di profondità, al di sotto della Moho, con una camera
magmatica di forma sferica. Studi geodetici tra i segmenti di placca che delimitano la SISZ e la
EVZ nelle aree dell’Hekla e del Torfajökull dimostrano un accumulo di stress elastico relativo
al movimento di rifting nella EVZ, ed una deformazione, inter-, co- e post-sismica nella SISZ.
L’ultimo grande episodio di rifting nella EVZ è avvenuto nel 1783-84 con l’eruzione fissurale
del Laki, durante la quale si è formato l’attuale campo di deformazione durante il periodo inter-
rifting. Inoltre, lo sforzo presente nei 60 km di larghezza della EVZ tende ad accumularsi più
rapidamente nella parte ovest della EVZ, dal Torfajökull al Bárðabunga. Considerando quanto
sopra, mediante misurazioni GPS sono stati stimati la posizione orizzontale, la profondità
e il tasso di variazione in volume per l’Hekla e il Torfajökull, tentando di definire anche
posizione e profondità dei segmenti di placca interessati dalla SISZ e dalla EVZ, ma il modello
174
GNGTS 2019 Sessione 1.3
Fig. 2 - Variabilità dello spessore crostale (Moho) e profondità dei principali reservoirs magmatici per i sistemi
vulcanici appartenenti alla Eastern Volcanic Zone (EVZ) definiti sulla base di dati di letteratura.
utillizzato per definire la deformazione della superficie non è stato utile a definire la profondità
dell’intersezione tra la SISZ e la EVZ (Geirsson 2012).
Per quanto riguarda l’Eyjafjallajökull, Tarasewicz et al. (2012) ritengono, attraverso metodi
di sismica a rifrazione e riflessione e misure gravimetriche, che la discontinuità di Moho si
trovi ad una profondità prossima ai 22-23 km circa. Questo vulcano ha un sistema di storage
complesso, costituito da alcune camere magmatiche che si trovano al di sotto della discontinuità
di Moho ed altri sistemi di ristagno/dicchi collocati più superficialmente e che hanno alimentato
l’eruzione nel 2010. Le composizioni dei magmi in questi resorvoirs coprono uno spettro
ampio, da basaltico a riolitico. La posizione e la profondità dei sill è stata definite nel 1996
mediante misurazioni del tremore sismico locale, in accordo con Sigmundsson (2010), che
associa il tremore ad una sorgente di depressione posta a 5 km di profondità al di sotto dei
crateri sommitali.
La Moho al di sotto del sistema vulcanico del Katla ha una profondità di 20 km (Darbyshire
et al., 2000). Óladóttir et al. (2008) trovano un consistente corpo ad alta densità al di sotto del
Katla, con diametro di 15 km e 8 di profondità, interpretato come un’intrusione solidificata
probabilmente gabbroide. Da indagini sismiche, Gudmundsson et al. (1994) hanno rilevato
un’anomalia nella velocità delle onde S. Le onde S giungono fino a 7 km di profondità e
ritornano in direzione obliqua verso la superficie mostrando la camera magmatica dal basso
posta a 2 km di profondità. La caratteristica principale del modello utilizzato è un abbattimento
delle velocità delle onde a 2-3 km di profondità vicine alla parte centrale del ghiacciaio su
cui giace il vulcano, accoppiata ad un’anomalia di aumento netto di velocità obliqua. Questa
sequenza di anomalie di velocità è stata interpretata con la presenza di una camera magmatica
al di sotto della caldera del Katla.
Al di sotto del sistema Grimsvötn – Laki la crosta raggiunge i 25 km di spessore secondo
Darbyshire (2000), con diversi batch magmatici che spaziano da 30 a 1 km di profondità e la
presenza di diversi sill/dicchi. Alcuni di questi ultimi hanno contribuito all’eruzione fissurale
del Laki del 1783-84. Questo sistema vulcanico dispone di batch magmatici con composizioni
e signature differenti, alimentati da sorgenti sia N-MORB sia E-MORB. Le motivazioni alla
base della variabilità composizionale sono da riferirsi ai tempi di stazionamento dei magmi nei
175GNGTS 2019 Sessione 1.3
relativi reservoir, che permettono evoluzione del magma con sviluppo di un crystal mush a 10-
15 km di profondità che interessa i magmi provenienti dalle porzioni più profonde (~25km).
Al di sotto del Barðarbunga la Moho raggiunge una profondità di 25 km, ove si trovano due
reservoirs che coinvolgono magmi basaltici con signature sia N-MORB sia E-MORB, insieme
ad altri batch a circa 20-22 km, a 10 km (a composizione sempre basaltica) e un dicco imponente
nella parte più vicina alla superficie, a circa 5 km di profondità (45 km di lunghezza e 5 kmdi
spessore), che ha contribuito all’ultima attività del Barðarbunga nel 2014-15 all’Holuraun
(Gudmundsson et al., 2014, Hartley et al., 2018).
Relazioni temporali dei reservoirs magmatici lungo la EVZ. Le informazioni temporali
sui processi di storage e trasferimento dei magmi sono stati ottenuti da dati di letteratura ed
originali relativi alla diffusione di Fe-Mg in cristalli di olivina. Questi dati sono relativi ai
magmi dei sistemi Heimaey 1973 (dati originali), Eyjafjallajökull 2010 (Viccaro et al. 2016),
Laki – Grimsvötn (dati originali). I risultati di questo lavoro, mostrano le seguenti stime
temporali relative al processo di risalita: a) ~1.5 giorni per i magmi che risiedono nei reservoir
più superficiali (2-3 km circa di profondità); b) ~30-40 giorni per i magmi che risiedono al di
sotto della Moho (24-26 km di profondità).
Conclusioni. È interessante notare che le tempistiche si mantengono relativamente costanti
per i sistemi vulcanici lungo la EVZ (almeno per quelli considerati e di cui si dispone di dati)
e che il meccanismo di innesco delle eruzioni è principalmente tettonico in quanto i cristalli
profondi non presentano zonature inverse indicative di processi di mescolamento di magmi. I
processi di mescolamento coinvolgono solo i livelli di stoccaggio del magma più superficiali e
rientrano in tempistiche dell’ordine di 1-2 settimane. Ulteriori studi futuri saranno finalizzati a
definire se questi trend di funzionamento possono esser estesi anche agli altri sistemi vulcanici
lungo la EVZ e se questi sono differenti rispetto alle dinamiche di altri settori neovulcanici in
Islanda (ad es., NVZ).
Bibliografia
Darbyshire F.A., White R.S. and Priestley K.F.; 2000: Structure of the crust and uppermost mantle of Iceland from a
combined seismic and gravity study. Earth Plan. Sci. Lett., 181, 409-428.
Foulger G.R.; 2010: Plates vs Plumes. A geological controversy. Wiley-Blackwell, 2010, paperback: 364 pages, ISBN
978-1-4051-6148-0
Gebrande, H., Miller, H., and Einarsson, P.; 1980: Seismic structure of Iceland along RRISP-profile. Int. J. Geophys.
47, 239–249.
Geirsson H., LaFemina P., Árnadóttir T., Sturkell E., Sigmundsson F., Travis M., Schmidt P., Lund B., Hreinsdóttir S., and
Bennett R., ; 2012: Volcano deformation at active plate boundaries: Deep magma accumulation at Hekla volcano
and plate boundary deformation in south Iceland. J. Geophys. Res., 117, B11409, Doi:10.1029/2012jb009400.
Gudmundsson A., Lecoeur N., Mohajeri N., and Thordarson T.; 2014: Dike emplacement at Bardarbunga, Iceland,
induces unusual stress changes, caldera deformation, and earthquakes. Bull. Volcanol., 76, art. 869, DOI
10.1007/s00445-014-0869-8.
Gudmundsson O., Brandsdottir B., Menke W. and Sigvaldason G. E.; 1994: The crustal magma chamber of the Katla
volcano in south Iceland revealed by 2-D seismic undershooting. Geophys. J. Int. 119, 277-296.
Hartley M. E., Bali E., Maclennan J., Neave D. A., and Halldórsson S. A.; 2018: Melt inclusion constraints on
petrogenesis of the 2014–2015 Holuhraun eruption. Iceland, Contrib. Mineral. Petrol. 173, 10.
Mattsson H.B. and Oskarsson N.; 2005: Petrogenesis of alkaline basalts at the tip of a propagating rift: Evidence from
the Heimaey volcanic centre, south Iceland. J. Volcanol. Geotherm. Res., 147, 245– 267.
Mattsson, H. and Höskuldsson, À.; 2003: Geology of the Heimaey volcanic centre, south Iceland: early evolution of
a central volcano in a propagating rift? J. Volcanol. Geotherm. Res., 127, 55-71.
Óladóttir B.A., Sigmarsson O., Larsen G., and Thordarson T.; 2008: Katla volcano, Iceland: magma composition,
dynamics and eruption frequency as recorded by Holocene tephra layers. Bull. Volcanol., 70, 475–493 DOI
10.1007/s00445-007-0150-5.
Sigmundsson F., Hreinsdóttir S., Hooper A., Arnadóttir T., Pedersen R., Roberts M. J., Óskarsson N., Auriac A.,
Decriem J., Einarsson P., Geirsson H., Hensch M., Ófeigsson B. G., Sturkell E., Sveinbjörnsson H., and Feigl K.
L.; 2010: Intrusion triggering of the 2010 Eyjafjallajökull explosive eruption, 2010. Nature, 468, 426-431.
Tarasewicz J., White R.S., Woods A.W, Brandsdòttir B., and Gudmundsson M.T.; 2012: Magma mobilization by
downward propagatin decompression of the Eyjafjallajökull volcanic plumbing system. Geophys. Res. Lett., 39,
L19309, doi:10.1029/2012GL053518.
176GNGTS 2019 Sessione 1.3
LINKING CRYSTAL CHEMISTRY AND GROUND DEFORMATIONS FOR
A HIGH-RESOLUTION DETECTION OF MAGMA DYNAMICS AT MT. ETNA
M. Giuffrida1, F. Zuccarello1, M. Borzì1, M. Palano2, M. Viccaro1,2
1
Università di Catania, Dipartimento di Scienze Biologiche, Geologiche e Ambientali, Catania, Italy
2
Istituto Nazionale di Geofisica e Vulcanologia – Sezione di Catania, Osservatorio Etneo, Catania, Italy
Introduction. During the last decade, Mt. Etna has given birth to a wide range of eruptions
from both the summit craters and the volcano’s flank, passing from periods of entirely effusive
activity to strongly explosive (i.e., violent Strombolian to lava fountains). Since 2011, the
eruptive behavior was dominantly explosive with two major cycles of paroxysmal eruptions
as those of 2011-2013 at the New South East Crater (NSEC) and those of December 2015 and
May 2016 at the Voragine Crater (VOR). In particular, the eruptions at VOR were among the
most explosive recorded during the last two decades. A new change of the eruptive behavior
was observed during 2017, when the activity turns again to dominantly effusive, giving rise
to a short sequence of weak Strombolian explosions and lava flow emissions from the NSEC.
The most recent history of the volcano has
seen the opening of eruptive fissures on the
eastern flank of the NSEC cone on December
24-27, 2018 (Fig. 1). Eruptive fissures
rapidly propagated southeastward, followed
by resumption of low-intensity explosive
activity at the summit vents. The short-lived
episode of December 2018 took place about
10 years after the last flank eruption of May
2008 (Aloisi et al., 2009). This eruption has
been here considered within the framework
of the changing mechanisms of magmatic
replenishment and transfer that affected
the Etna plumbing system since June 2016
(Viccaro et al., 2019). Indeed, the ending of
the paroxysmal activity at VOR on May 2016
marks the beginning of a period characterized
by a significant decreasing of the eruptive
frequency and emitted magma volumes,
despite the evidence of continuous magma
replenishment from depth. These observations
lead us to envisage the occurrence of important
changes in the modes of magma storage and
transfer beneath the volcano. The detection
and investigation of such dynamics required
a multidisciplinary approach in which crystal
chemical zoning, diffusion chronometry and
Fig. 1 - (a) Digital Elevation Model of Mt. Etna with ground deformation data have been combined.
location of the GPS stations used in this study (yellow The extended petrologic and geodetic dataset
squares), the eruptive fracture (pink areas) and the presented in this study allows for the spatial
lava flow field (red areas) related to the December 24- localization of active magmatic sources, and
27, 2018 volcanic events. The EDAM-EINT baseline also the definition of their temporal activation
is traced with a black line. BN: Bocca Nuova; VOR:
Voragine; NEC: North East Crater; SEC: South East
throughout the 2016-2018 eruptive periods.
Crater; NSEC: New South East Crater. (b) View of Data elaboration and integration. The
the fissure eruption on the eastern flank of NSEC cone compositional and temporal information
during the afternoon of December 24, 2018. preserved in volcanic crystals were elaborated
177GNGTS 2019 Sessione 1.3
and integrated together with GPS observations collected from the permanent monitoring
network of Mt. Etna during the December 2015 – December 2018 period of activity. Olivine
crystals were selected and grouped in populations based on their core compositions and zoning
types in order to detect the presence of magmas with distinct differentiation degrees. Olivine
cores spanning from more basic (Fo84) to slightly evolved compositions (Fo70) reflect crystal
residence and growth in five magmatic environments, which are variably distributed beneath
Mt. Etna. The physical parameters, such as P, T, and ƒO2, associated to each environment
were constrained through thermodynamic modeling. Thus, high-Fo core compositions at Fo84
designate a deep environment of crystallization at ca. 650 MPa, here indicated as M00; olivines
with Fo80-81 cores are representative of the M0 environment located at pressure of 420-380 MPa;
Fo78 cores refer to the M1a environment at 290-230 MPa; olivines with Fo76 core compositions
belong to the M1b environment at 160-120 MPa, whereas the Fo70-74 cores cover a compositional
range which is between 30 and 40 MPa (i.e., the environment M2). A detailed investigation
of the diversity of the olivine chemical zoning from core to rim allowed the identification of
some dominant paths of ascent and mechanisms of interactions between different magmas. This
finally led us to detect those environments that were reactivated before each eruptive episode
since December 2015. The timescales associated to these magmatic interactions were obtained
by modeling the diffusional relaxation of the Fe-Mg zoning in olivine crystals (Costa et al.,
2018; Costa and Morgan, 2010). The petrological evidence of multiple magmatic environments
beneath the volcano is strongly connected with the evidence of active magmatic sources
inferred through geodetic data inversions and associated to main ground deformation stages.
For instance, in the case of the 2015-2016 eruptions at VOR, ground deformation data indicate
the presence of a magmatic source at depth of 4.9–5.7 km bsl, which is rather consistent with
the depth of storage of the M1b reservoir defined by petrological investigations. Moreover,
the olivine chemistry indicates as trigger of the 2015-2016 eruptions the injection of high-Mg
magmas (Fo86-89) that rose up from the deepest regions of the Mt. Etna plumbing system (>650
MPa), moving to shallow crustal levels in very short time scales (ca. 1 month). Evidence of
this mafic end-member is given by the reverse zoning patterns observed in most of the crystals
erupted during the episodes of the 2015-2016. At the end of the activity at VOR on May 2016,
ground deformation data recorded a new inflation of the volcano edifice which lasted about
10 months. The inflation resulted by magma injection that caused the pressurization of the
shallow portion of the plumbing system within the pressure range of M1b. Associated to this
main deformation stage, we inferred a source of deformation that well overlaps the environment
M1b, as for the events of VOR. All over the 2017 eruptive period, olivine chemistry highlights
processes of continuous replenishment of the volcano plumbing system with basic M1a and
M1b magmas that rapidly moved throughout the crust, reaching the surface in 1-3 weeks. The
recharging magmas had more evolved compositions than those feeding the volcanic activity at
VOR. Noteworthy, the continuous magma injections from depth was completely balanced by
lava effusion at the surface, resulting in a nearly flat deformative pattern during the episodes of
February and March 2017. Similarly, a new inflationary deformative pattern was recorded since
April 1, 2017 albeit conspicuous magma discharges occurred during the eruptions of April 11,
19 and 27. In spite of the end of the activity at the NSEC, the inflation of the volcano edifice
continued steadily until December 24, 2018, when a new effusive lateral eruption took place
from a fracture system extending from the base of the NSEC down into the western wall of the
Valle del Bove. Through geodetic data modeling we inferred a magmatic source of deformation
at 7025±352 m bsl, which is therefore located at depth slightly higher than magmatic sources
feeding the 2015-2016 activity at VOR (5661±471 m; Cannata et al., 2018) and at the NSEC
during 2017 (6298 ± 350 m; Viccaro et al., 2019).
Conclusion. The integrated analysis of geodetic and petrological data applied to a complex
volcanic system like Mt. Etna has proved to be a powerful tool to gain insights into the spatial
and temporal history of magma transfer and recharge beneath the volcano. We explored the
178GNGTS 2019 Sessione 1.3
mechanisms of magmatic replenishment and transfer that characterized the plumbing system
of Etna since 2015, finally leading to the recent flank eruption of December 24-27, 2018.
Combination of our petrologic and geodetic observations supports the idea that the violent
paroxysmal activity affecting the VOR crater during December 2015 and May 2016 deeply
changed the modes of magma supplying into the Etna plumbing system, enhancing episodes
of deep replenishment and long-lasting storage at high pressure conditions, rather than shallow
pressurization with frequent emissions of magma at the surface.
References
Aloisi M., Bonaccorso, A., Cannavò F., Gambino S., Mattia M., Puglisi G. and Boschi E.; 2009: A new dike intrusion
style for the Mount Etna May 2008 eruption modelled through continuous tilt and GPS data. Terra Nova, 21, 316–
321.
Cannata A., Di Grazia G., Giuffrida M., Gresta S., Palano M., Sciotto M., Viccaro M. and Zuccarello F.; 2018: Space-
Time Evolution of Magma Storage and Transfer at Mt. Etna Volcano (Italy): The 2015–2016 Reawakening of
Voragine Crater. Geochem. Geophys. Geosyst., 19, 471-495.
Costa F., Dohmen R. and Chakraborty, S.; 2008: Time scales of magmatic processes from modeling the zoning patterns
of crystals. Rev. Mineral. Geochem., 69, 545–594.
Costa F. and Morgan D.J.; 2010: Time constraints from chemical equilibration in magmatic crystals. In: Dosseto A.,
Turner S.P., Van Orman J.A. (eds), Timescales of magmatic processes: from core to atmosphere, pp. 125–159
(Wiley, Oxford).
Viccaro M., Giuffrida M., Zuccarello F., Scandura, M., Palano M. and Gresta S.; 2019: Violent paroxysmal activity
drives self-feeding magma replenishment at Mt. Etna. Sci. Rep., 9, 6717.
RELATIONSHIP BETWEEN RESERVOIR PERMEABILITY, MAGMATISM AND THE
DEVELOPMENT OF GEOTHERMAL RESOURCES IN CONTINENTAL SETTINGS
G. Gola
Istituto di Geoscienze e Georisorse, Consiglio Nazionale delle Ricerche, Pisa, Italy
Introduction. Conductive heat transfer dominates in the middle-to-lower continental
crust where the permeability of the metamorphic rocks limits an efficient convective heat
transport (Ingebritsen and Manning 2003, Manning and Ingebritsen 1999). Instead, zones of
crustal weakness and faulting allows efficient transport of fluids and also provides shallow
magma storage space. Thanks to the high-temperature reservoir availability, the active or very
recent magmatic fields represent the most interesting areas where geothermal exploration
and exploitation focus. For this reason, the knowledge of the age of the last magmatic event
as well as the emplacement depth and temperature of the magmatic intrusion are essential
aspects in order to characterizing the geothermal system and assessing its potential. How long
magma bodies persist in the middle-to-upper crust is a fundamental information to unravel
also the relationship between magmatism and the development of conventional geothermal
resources in continental settings. In this work, the results achieved by the numerical
modelling of four geothermal fields in a magmatic setting are presented. The Ischia Island
(southern Italy), the Long Valley caldera (eastern California), the Acoculco caldera complex
(eastern Mexico) and the southern sector of the Larderello-Travale geothermal field (central
Italy) have been matter of a multidisciplinary study in which an integrated approach has
been applied in order to set-up numerical models able to simulate the conductive-convective
thermal structure. The heat source has been parametrized both in space and time through an
optimization procedure.
179GNGTS 2019 Sessione 1.3
Fig. 1 - (a) Comparison between the measured (red line) and the simulated thermal profiles (black lines) for different
reservoir permeability of Ischia Island. The thickness of the geothermal reservoir (light grey) and of the magmatic
intrusion (dark grey) are also reported. (b) Matrix of the NRMSE resulting from the multi-parametric study. Each
pixel corresponds to a numerical model solved using specific combination of permeability and magma temperature.
Thermal evidences. The Ischia Island is an example of an active volcano hosting a
large hydrothermal system. Geothermal exploration provided information about rocks and
temperatures down to a maximum depth of about 1 km. The temperature profiles display a
typical conductive trend in the upper sections due to the occurrence of impermeable, mainly
argillic, layers acting as caprock. The deeper tuff and lava formations constitute the deep-seated
geothermal reservoir along which a roughly isothermal profile is observed down to a maximum
depth of 900 m. Below this convective layer, the thermal gradient increases and a maximum
temperature of 225 °C is recorded.
In Long Valley Caldera, the measured thermal profiles show characteristic thermal picks at
very shallow depths systematically followed by temperature reversals. The numerous thermal
surveys suggest that the upwelling fluid locates in the western sector of the caldera where a
maximum temperature of 216°C at a depth of 1 km has been measured. From the western sector,
the geothermal fluid flows laterally eastward throughout the intra-caldera volcanic sequence.
The magnitude of the thermal anomaly decreases from >200°C to less than 50°C in the thermal
springs located in the easternmost sector.
The Acoculco caldera complex is characterized by a widespread hydrothermal alteration
but nowadays only two exploratory wells have been drilled. They are very close each-other and
recorded a similar thermal profile with a maximum temperature slightly above 300°C at 2 km
depth. The drilled formations resulted impermeable, likely due to self-sealing processes, and a
mainly conductive temperature distribution has been observed in both wells.
The Larderello-Travale geothermal field hosts two main reservoirs, the shallow reservoir
develops within Mesozoic evaporite-carbonate units with temperatures from 150°C to 260°C,
the deep reservoir is hosted in the uplifted Paleozoic metamorphic basement and Neogene
granitoids with temperatures from 300°C to 350°C. Fluids dominantly of meteoric origin at
vapor phase circulate in both reservoirs. A recent exploration program investigated the possible
occurrence of high-pressure and high-temperature fluids in the proximity of a deep seismic
reflector at about 3 km depth. Drilling revealed an unexpectedly high temperature >500°C near
the bottom at 2.65 km but no fluid entered into the well.
180GNGTS 2019 Sessione 1.3
Settings of numerical simulations and optimization procedure. With the aim to simulate
the temperature distribution in the four geothermal systems under study, site-specific geological
models were created including the available stratigraphic information from wells, active seismic
imaging as well as velocity and resistivity data attained in tomographic and magnetotellurics
studies. The heat and mass transfer processes acting in the subsurface have been described by the
combination of the continuity and momentum equations coupled with the energy conservation
equation. The lithothermal units were treated as a homogeneous and downward anisotropic
porous material (Pasquale et al. 2011) in which mixing laws were applied to estimate the
effective thermal and hydraulic properties accounting for the in-situ conditions. In the heat
transfer equation, the thermal energy carried by the geothermal fluids and the heat released by
radiogenic elements and by young magmatic intrusions have been accounted for. The solution
of the differential equations has been approximated through the finite element method on a
tetrahedral mesh grid.
Sensitivity analysis revealed that the key parameters having major control on the thermal
structure are the reservoir permeability and the magma emplacement temperature. As example,
the optimization procedure of the numerical model of Ischia is shown in Figure 1. The available
deep temperatures were used as control points on which the overall misfit was calculated by the
Normalized Root Mean Square Error (NRMSE).
Results and conclusions. The style and magnitude of fluid circulation in the upper crust
and the relationships between hot magmatic intrusions and hydrothermal systems have been
investigated for a variety of reservoir permeability, magma emplacement depth and temperature
as well as deep geometries. Thermal convection dominates in the magmatic environments if
rocks permeability is greater than about 10-15 m2, resulting in a spatial redistribution of thermal
energy which notably differs from a purely conductive thermal model. As soon as the magma is
emplaced in the crust, it warms the hosting rocks and large-scale convective cells develop after
few thousand years.
The large vertical heat flux transports the thermal energy from the heat source to the top
boundary of the reservoirs faster than it can be dissipated through the conductive caprock units.
This condition determines vigorous horizontal fluxes which in turn control the lateral extension
of the thermal plume. Although most geothermal systems are associated with up-flow paths,
there are some geothermal fields, like the Long Valley caldera, where up-flow appears over-
printed by a more vigorous cross-flow. Under these circumstances, temperature inversions arise
due to fluid flow within highly permeable, horizontal aquifers. Topography may provide an
additional kick to the fluid circulation as fluids flow from higher elevations towards lower ones
due to a difference in the pressure heads.
In order to maintain reservoir temperatures above 150°C – 200°C or greater for long times,
the heat source requires consecutive magmatic pulses because the cooling time of upper-crustal,
middle-sized granitoids is quite fast. It is particularly difficult to unravel the thermal evolution
of the heat source from convection-dominated thermal profiles because the hydrogeological
noise clears the deep thermal signals. Conversely, conductive thermal profiles may record
more clearly the thermal effects of deep magmatic sources. For example, the temperature data
coming from Acoculco and Larderello areas show a characteristic convex upward trend. These
temperatures can only be fitted by a transient simulation accounting for an increase of specific
heat flow with time. The transient simulations suggest for both the sites a relatively young age
of the magmatic intrusion ranging from 0.1 Ma to 0.01 Ma or even younger.
Acknowledgments. This research was performed within the framework of four main National (Italian) and
European projects. The GEOTHERMAL ATLAS OF SOUTHERN ITALY Project is one of six Projects constituting
the Program “CNR per il Mezzogiorno” of the Italian National Research Council. The IMAGE Project has received
funding from the European Community’s Seventh Framework Programme under grant agreement No. 608553. The
DESCRAMBLE and the GEMex Projects have received foundings from the European Union’s Horizon 2020 research
and innovation programme under the grant agreement No. 640573 and No. 727550, respectively.
181GNGTS 2019 Sessione 1.3
References
Ingebritsen, S.E. and Manning, C.E. [2003] Implication of crustal permeability for fluid movement between terrestrial
fluid reservoirs. Journal of Geochemical Exploration, 78-79, 1-6.
Manning, C.E. and Ingebritsen, S.E. [1999] Permeability of the continental crust: implications of geothermal data and
metamorphic systems. Review of Geophysics, 37(1), 127-150.
Pasquale, V., Gola, G., Chiozzi, P. and Verdoya, M. [2011] Thermophysical properties of the Po Basin rocks.
Geophysical Journal International, 186, 69-81.
MODELLO DI VELOCITÀ E DI ATTENUAZIONE DELL’ISOLA D’ISCHIA
DA REGISTRAZIONI DI RUMORE SISMICO
R. Manzo2, L. Nardone1, D. Galluzzo1, M. Pilz3, S. Carannante4, R. Di Maio2, M. Orazi1, M. Picozzi5,
P. Cusano1, C. Martino1, G. Gaudiosi1
1
Istituto Nazionale di Geofisica e Vulcanologia, Sez. di Napoli, Osservatorio Vesuviano, Napoli, Italy
2
DISTAR – Università di Napoli Federico II, Napoli, Italy
3
GFZ German Research Center for Geosciences, Helmholtzstr. 7, 14467 Potsdam, Germany
4
Istituto Nazionale di Geofisica e Vulcanologia, Sez. di Milano, Italy
5
Dipartimento di Fisica - Università di Napoli Federico II, Napoli, Italy
Introduzione. Nelle aree vulcaniche, come l’Isola d’Ischia, l’ampia variabilità litologica e
l’alto gradiente geotermico richiedono analisi sempre più accurate per la definizione di specifici
modelli di velocità e di attenuazione delle onde sismiche. Nel distretto vulcanico campano,
modelli di velocità e attenuazione sempre più accurati sono stati ottenuti per il Vesuvio e per
l’area dei Campi Flegrei, meno o del tutto assenti per quel che riguarda l’attenuazione per
l’isola d’Ischia. È ben noto come la dettagliata conoscenza del modello di velocità possa fornire
risultati più affidabili in termini di localizzazione dei terremoti locali. A tal proposito, è bene
ricordare che, dal 1999, almeno 78 terremoti sono stati registrati ad Ischia (elenco aggiornato
al 21 febbraio 2018) (D’Auria et al., 2018) e sono stati localizzati utilizzando il modello
disponibile per i Campi Flegrei, scelto sulla base di similarità geologiche e vulcanologiche.
Pertanto, l’obiettivo di questo lavoro è la definizione di un modello 1-D in velocità e
attenuazione della crosta più superficiale (fino a 2 km di profondità) di Ischia utilizzando tecniche
di array applicate al rumore sismico e rapporti spettrali valutati su segnali sismici registrati da
sismometri a larga banda installati sull’isola ai fini della sorveglianza e del monitoraggio.
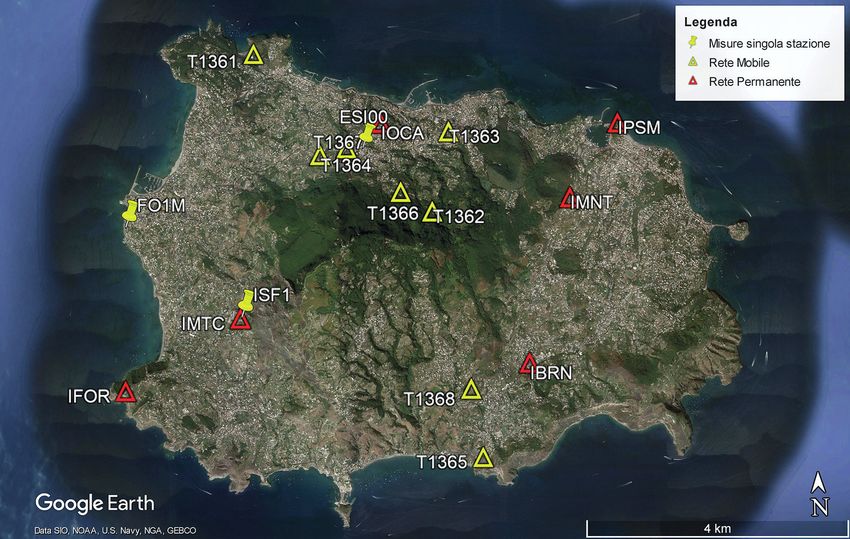
Metodologia di analisi e risultati ottenuti. Al fine di ottenere la velocità di fase delle onde
superficiali (c(ω)), e di conseguenza la struttura della velocità del sottosuolo, abbiamo usato
il metodo SPAC (Aki, 1957), nella versione modificata di Bettig et al. (2001), applicato alle
registrazioni del rumore sismico delle stazioni della rete di monitoraggio dell’isola (Orazi et al.
2018, Galluzzo et al., 2019) (Fig. 1).
Prieto et al. (2009) hanno mostrato che esiste una relazione tra il fattore di attenuazione
dell’onda Rayleigh α (ω) e il fattore di qualità delle onde Rayleigh Qr(ω), entrambi dipendenti
dalla frequenza, secondo l’equazione:
α(ω)=ω2Qr(ω) (1)
Una volta che la velocità di fase c(ω) e α (ω) sono note, Qr(ω) può essere stimato usando
l’equazione (1).
I coefficienti di correlazione di 6 classi di distanza sono stati utilizzati per la lettura degli
zeri, massimi e minimi delle funzioni di correlazione. A causa della dispersione dei valori di
velocità, soprattutto a frequenze inferiori a 0,6 Hz, abbiamo interpolato i valori di dispersione
con una curva polinomiale e, con una procedura manuale abbiamo piccato i valori di massimo
e minimo. Infine, la curva di dispersione da invertire (croci nere con la relativa deviazione
182GNGTS 2019 Sessione 1.3
Fig. 1 - Mappa dell’isola
d’Ischia. I triangoli rossi
indicano le stazioni
sismiche permanenti. I
triangoli gialli indicano le
stazioni della rete sismica
mobile. I segnaposto gialli
indicano siti in cui sono
state realizzate misure di
rumore.
standard Fig. 2a) è stata ottenuta mediante una media dei singoli valori di dispersione e delle
curve piccate, successivamente filtrata e ricampionata. I valori di velocità, in funzione della
frequenza, mostrano un comportamento dispersivo associabile alla presenza di onde superficiali
nel segnale. La curva di dispersione è stata invertita congiuntamente al rapporto spettrale medio
H/V (Figure 2b) di tutti i siti stazione.
I modelli risultanti dopo le fasi di inversione mostrano un buon adattamento (misfit minimo
= 0,15) tra curve sperimentali e teoriche usando una parametrizzazione del modello composta
da tre strati principali su semi-spazio con una velocità dell’onda di taglio che aumenta con la
profondità (Fig. 2 e Tab. 1).
Fig. 2 - Risultati dell’inversione congiunta dei dati di dispersione e H/V medio. a) Curva di dispersione (punti neri) e
relative barre di errore con in rosso la curva di dispersione teorica corrispondente al modello di velocità con minimo
misfit. b) Media H/V (punti neri) e relative barre di errore, in rosso funzione di ellitticità corrispondente al modello di
velocità con minimo misfit. La banda verticale grigia identifica il picco di frequenza media f0. c) Spazio dei modelli di
velocità dell’onda S delimitati dalle curve nere tratteggiate. In rosso il modello di velocità con minimo misfit.
183You can also read