Silverdale Business Land Assessment - 17 May 2018 -draft final - Auckland Council
←
→
Page content transcription
If your browser does not render page correctly, please read the page content below
Silverdale Business Land
Assessment

17 May 2018 –draft final
Silverdale Business Land Assessment

Prepared for
Auckland Council

Document reference:     ACL129.17
                        Incorporating feedback from AC Planning and Chief Economist Office
Date of this version: 17 May 2018
Report author(s): Derek Foy, Nadine Cronjé
Director approval: Douglas Fairgray

Disclaimer: Although every effort has been made to ensure accuracy and reliability of the information
contained in this report, neither Market Economics Limited nor any of its employees shall be held liable
for the information, opinions and forecasts expressed in this report.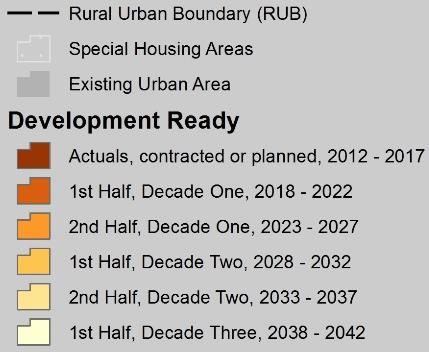
Contents
1     INTRODUCTION ...................................................................................................................... 1

1.1   BACKGROUND ............................................................................................................................ 1

1.2   OBJECTIVE .................................................................................................................................1

2     METHODOLOGY ..................................................................................................................... 2

2.1   BACKGROUND ............................................................................................................................ 2

2.2   CURRENT EMPLOYMENT DISTRIBUTION ............................................................................................ 2

2.3   VACANT BUSINESS LAND ASSESSMENT ............................................................................................. 3

2.4   EMPLOYMENT PROJECTIONS ..........................................................................................................3

2.5   LAND DEMAND PROJECTIONS.........................................................................................................4

2.6   GROWTH PROJECTIONS ................................................................................................................4

3     SILVERDALE BUSINESS LAND .................................................................................................. 5

3.1   BUSINESS LAND ZONING ...............................................................................................................5

3.2   FULSS .....................................................................................................................................6

3.3   SUPPORTING GROWTH PROJECT.....................................................................................................7

3.4   NPS URBAN DEVELOPMENT CAPACITY ........................................................................................... 9

4     BUSINESS LAND DEMAND .................................................................................................... 10

4.1   METHOD 1 (URBAN NORTH) ......................................................................................................10

4.2   METHOD 2 (CATCHMENT) ..........................................................................................................12

4.3   BUSINESS LAND REQUIREMENTS SUMMARY ....................................................................................21

4.4   NET ADDITIONAL LAND INCLUDING NON-INDUSTRIAL ACTIVITIES ......................................................... 21

5     CONCLUSION........................................................................................................................ 23

Figures
FIGURE 3.1: NORTH SHORE AND SOUTHERN RODNEY BUSINESS LAND STOCKS (HA, 2017)........................................ 5

FIGURE 3.2: SILVERDALE WAINUI DAIRY FLAT BUSINESS LAND (OPERATIVE AUP ZONING, AS AT JULY 2017)................ 6

FIGURE 3.3: FULSS FUTURE URBAN AREA SEQUENCING........................................................................................ 7

FIGURE 3.4: SUPPORTING GROWTH FUZ POTENTIAL LAND USES ............................................................................ 8

FIGURE 4.1: URBAN NORTH BUSINESS LAND GROWTH OVER 2016 (HA) ............................................................... 11

FIGURE 4.2: URBAN NORTH CATCHMENT VACANT BUSINESS LAND 2018 (HA)....................................................... 11

FIGURE 4.3: METHOD 1: URBAN NORTH CATCHMENT DEMAND SHORTFALL AT EACH TIME (HA, NET OF ROADS ETC,
INCLUDES UDS 15% BUFFER) ......................................................................................................................... 11

FIGURE 4.4: METHOD 1: URBAN NORTH CATCHMENT DEMAND SHORTFALL AT EACH TIME (HA, APPROXIMATE GROSS) 12

FIGURE 4.5: METHOD 2 CATCHMENTS ............................................................................................................. 12

FIGURE 4.6: CATCHMENT HOUSEHOLD COUNTS (2000-2016) ........................................................................... 13

FIGURE 4.7: CATCHMENT EMPLOYMENT COUNTS (2000-2016) ......................................................................... 14

FIGURE 4.8: HISTORIC TOTAL EMPLOYMENT AND EMPLOYMENT PER HOUSEHOLD (2000-2016) .............................. 14

FIGURE 4.9: HISTORIC INDUSTRIAL ZONE EMPLOYMENT AND EMPLOYMENT PER HOUSEHOLD (2000-2016) .............. 15

FIGURE 4.10: CATCHMENT INDUSTRIAL ZONES SHARE OF TOTAL EMPLOYMENT ...................................................... 16

FIGURE 4.11: AUCKLAND LIZ EMPLOYMENT (2016, SHARE OF MECS) ................................................................ 16

FIGURE 4.12: CATCHMENT HOUSEHOLD PROJECTIONS ....................................................................................... 17

FIGURE 4.13: CATCHMENT EMPLOYMENT PROJECTIONS (MECS, ALL SECTORS) ...................................................... 17

FIGURE 4.14: METHOD 2 INDUSTRIAL ZONE EMPLOYMENT PROJECTIONS.............................................................. 18

FIGURE 4.15: ADDITIONAL INDUSTRIAL LAND EMPLOYMENT BY SECTOR ................................................................. 19

FIGURE 4.16: SILVERDALE, WHANGAPARAOA AND NORTH SHORE VACANT BUSINESS LAND 2018 (HA) ..................... 19

FIGURE 4.17: CATCHMENT BUSINESS LAND GROWTH OVER 2016 (HA) ................................................................ 20

FIGURE 4.18: METHOD 2: URBAN NORTH CATCHMENT DEMAND SHORTFALL AT EACH TIME (HA, NET OF ROADS ETC,
INCLUDES UDS 15% BUFFER) ......................................................................................................................... 20

FIGURE 4.19: METHOD 2: URBAN NORTH CATCHMENT DEMAND SHORTFALL AT EACH TIME (HA, APPROXIMATE
GROSS) ........................................................................................................................................................ 21

FIGURE 4.20: SWDF BUSINESS LAND REQUIREMENTS (HA), NET OF ROADS ETC, AND INCLUDING 15% NPS BUFFER ... 21

FIGURE 4.21: SWDF TOTAL NET ADDITIONAL BUSINESS LAND REQUIRED TO 2048 (NET HA, EXCLUDES ROADS ETC.) ... 22
1          Introduction
Market Economics (M.E) was commissioned by Auckland Council to provide an assessment of the
business land requirements in the Silverdale Wainui Dairy Flat Future Urban Zone.

1.1        Background
Silverdale is a long-established community located at the entrance to the Whangaparaoa Peninsula, some
30 km north of the Auckland CBD. The area is now one of high growth, and recently a large retail centre
has developed adjacent to an existing small local centre, to provide for the needs of the growing
population in the area. To date that growth has been predominantly east of State Highway 1, but very
significant future growth will also occur to the west of the Highway, requiring a large amount of new
infrastructure, including retail and services space, and new local employment opportunities.

This assessment has been commissioned by Auckland Council to contribute to planning for that growth.
Just over 3,200ha of land in Silverdale Wainui Dairy Flat was zoned Future Urban Zone (FUZ), and just
over 300ha with live urban zonings, in the operative in part Auckland Unitary Plan (AUP) to accommodate
future growth in northern Auckland. That FUZ zoning indicates an intention that the land will in the future
change from the current rural use to some alternative (urban and business) use, and is therefore a
transitional zone. Conversion to use for urban activities can only occur following due process, which
involves preparation of a structure plan and subsequently a plan change to rezone the land for urban
purposes. That process requires consideration of the type and extent of the proposed urban activities,
including in the context of the surrounding urban environment.

Auckland Council (Council), Auckland Transport, and the NZ Transport Agency have undertaken a high-
level assessment of preferred land uses for the Silverdale Wainui Dairy Flat (SWDF) FUZ (the “Supporting
Growth” study), including residential, business land and centres, along with transport infrastructure.

1.2        Objective
The purpose of this report is to make independent recommendations as to the appropriate area required
in Silverdale Wainui Dairy Flat for and the location of current and future business land (defined for the
purposes of this assessment as land with a Light Industry or Heavy Industry zoning), with reference to
Council’s work. The recommendations are to take into account the Future Urban Zone in the area, the
neighbouring rural areas, the existing Hibiscus Coast and North Shore, along with the characteristics and
capacity of the area to accommodate growth.

Page | 1
2             Methodology
This section describes the methodology applied to project future demand for business land in SWDF.

2.1           Background
Demand for business (Light and Heavy Industry) land followed an approach applied for the AUP hearings
in 2016. For that work M.E was commissioned by Council to undertake an assessment of region-wide
business land demand. Subsequently M.E was asked by the Hearings Panel to undertake a detailed
assessment (the ‘IHP work’) to address several key matters of interest.

The approach applied for that assessment was to:

              •     Define six sub-regional catchments, four urban catchments (North, South, Central and
                    West) and two rural catchments (North and South).

              •     Quantify current employment, and project future employment in each catchment, and in
                    each of 48 economic sectors.

              •     Establish a relationship between employment in each of the 48 sectors and the zone in
                    which it locates.

              •     Apply an estimate of the workspace ratio (WSR) required to accommodate each
                    employee. This is a measure of floorspace per employee.

              •     Convert floorspace estimates to land area estimates, using floor area ratios (FAR1).

The assessment was undertaken for all business zones (Light and Heavy Industry, Mixed Use, General
Business etc.) separately, using detailed land use survey data relating to employment density and built
form. For this project the same approach was applied, although with some specific consideration of
employment distributions in southern Rodney, as described below, and limited to the LIZ and HIZ.

The IHP work has now been updated as part of the Council’s National Policy Statement on Urban
Development Capacity (the “NPS”). The results changed relatively little from the IHP work, given that the
large mass of commercial supply that has not changed since the IHP work. Background to the NPS work is
provided in section 3.4.

2.2           Current employment distribution
The first stage in the assessment of business land demand is quantifying current employment by location
within south Rodney, which was done as follows:

1A measure of development intensity which is a ratio of a building's total floor area to the land area the building occupies. If the
building is single level, a FAR of 0.4 indicates the building footprint takes up 40% of the site. A two-level building which occupies
40% of the site would have a FAR of 0.8.

Page | 2
• Define catchments relevant to assessing demand for Silverdale’s business land, using as a
base the Urban North catchment used in the IHP/NPS work, and then including smaller
subcatchments for Method 2 of this project, as described in section 4.2.1.
• Source Statistics NZ Business Directory data (2016) for total employment in each
meshblock by ANZSIC industry sector.
• Source GIS zoning files from Council, and quantify meshblocks’ zoned area by zone type.
• Allocate each employment sector (ANZSIC) to the type of zone it is most likely to occupy.
For example, in a meshblock where there is an area zoned residential, some rural land
and land zoned Light Industry, assume that manufacturing employment is located in the
Light Industry zone. In practice many meshblocks have only one or two zones, and so the
allocation of employment to zone is straight forward, and all instances of very large
employment meshblocks were checked manually to accurately allocate large employers
to the correct zone, using aerial photography. The output of this is total employment in
the catchment by meshblock and by zone. Of most relevance to this assessment, this
output yields total 2016 employment on Light Industry land in the study area, which is
the basis of the land demand projections.
This process was applied to calculate the distribution of employment in the Light Industry zone (LIZ), and
Heavy Industry zone (HIZ)
2.3 Vacant Business land assessment
An assessment of vacant land is in some cases subjective. Sometimes referred to as ‘vacant potential’,
land can be partly occupied but significantly underutilised for its zoned purpose. For example, several
buses parked on a large LIZ parcel next to a small shed indicates some degree of use, however with
potential for redevelopment. This type of land has been assessed as vacant for this study.
Subjectivity arises because not all low intensity uses indicate redevelopment potential. Many industrial
uses such as yards, depots and storage areas are required to support the function of industrial zones, but
are low intensity, and do not necessarily require buildings. These type of activities have been assessed as
not vacant for this study, because even though they might be low intensity, and therefore able to be
replaced by a more intensive use of land, they would then likely have to relocate to other business land
elsewhere. For this study every site in North Shore City and southern Rodney was reviewed individually,
using aerial photography from two sources and using Google Streetview and online searches to cross
check activity types and development changes. In some cases this resulted in changes to the vacant
capacity that was applied in the NPS.
2.4 Employment projections
The key output from the current employment distribution (2016 employment on business land in the
study area) is then used as the starting point for projections of future employment on SWDF’s business
zoned land. Three different scenarios were employed to project demand for future industrial land
(labelled as several employees per household):
Page | 3• Method 1 (Urban North): the IHP work divided the Auckland Region into six parts2, and
projected industrial land demand for each. The study area is within the Urban North area,
and so the employment and land projections for the Urban North are used to assess
potential demand for land in each business zone (LIZ and HIZ) in SWDF.
• Method 2 (Catchment): this method drives future demand for business land in the study
area by household growth in the area, so that the future employee per household ratio is
the same as current, and employment grows at the same rate as household growth.
Land demand projections present the range assessed under those scenarios.
2.5 Land demand projections
For each of the employment projections methods described above, the next step is to calculate the
floorspace and land area required to accommodate that employment. That process is the same as the
modelling undertaken for the AUP hearings, as follows:
• Apply an estimate of the workspace ratio (WSR) required to accommodate each
employee. This is a measure of floorspace per employee.
• Convert floorspace estimates to land area estimates, using floor area ratios (FAR).
For this assessment a key assumption is what density to assume for future employment. The AUP
assessment was undertaken for sub regional catchments (as described in section 2.6). As described
above, the IHP work was undertaken for six sub regional catchments, and the Urban North’s WSR and
FAR were applied for this assessment’s demand projections for land zoned LIZ and HIZ.
2.6 Growth projections
Household projections used in the assessment were derived from information supplied from Council’s
ART (Auckland Regional Transport) Model. The ART model produces a preferred set of projections, which
were adopted for this study, and the ART output used was “Scenario I Modified, Version 11”. In the FUZ,
the ART model understates the likely quantum of growth, and so the Future Urban Land Supply Strategy
(2017) (FULSS) was used to inform the ultimate number of households in the FUZ, and when they might
form. There is a high degree of uncertainty about that formation profile, given the relatively long time
until the area becomes development ready, however the important point is the ultimate capacity of the
area, as that is what will be the key driver of ultimate centre size.
Council’s ART Model growth projections have a 2046 horizon, and so to the 2048 estimates presented in
this report are extrapolated from the times series of ART projections. Some ART zones are projected to
have reached capacity by 2046, in which case nil additional growth is applied for them to 2048.
2 Four urban areas (Central, North, West and South) and two rural area (North and South)
Page | 43 Silverdale Business land
This section summarises the current distribution and amount of business land in the study area, and
provides a summary of the FULSS.
3.1 Business land zoning
This study has assessed existing live zoned areas in and around Silverdale to provide an indication of
current business land supply. Data from Auckland Council was sourced to quantify total vacant and vacant
potential land within each area, and that data was then checked using aerial photography to take into
account recent developments. Relevant to this study are four main areas of Business land at:
• North Shore (469ha LIZ, across all areas).
• the existing industrial area around Forge and Foundry Roads in Silverdale (57ha LIZ,
and 29ha HIZ).
• a small area of 11.3ha LIZ at Dairy Flat.
• a larger 30.3ha area of LIZ at the Highgate Business Park near Millwater, where most
sites have been sold and many are currently being built on, although all are recorded
as vacant for this assessment (Figure 3.1).
Figure 3.1: North Shore and Southern Rodney Business Land stocks (ha, 2017)
Total Zoned Area Vacant Vacant %
Light Heavy Light Heavy Light Heavy
Industry Industry Industry Industry Industry Industry
Zone Zone Zone Zone Zone Zone
North Shore City 469.1 - 8.8 - 2% 0%
Silverdale 57.3 28.6 18.1 2.5 32% 9%
Dairy Flat 11.3 - 6.6 - 58% 0%
Highgate 30.3 - 30.3 - 100% 0%
Total 568.0 28.6 63.8 2.5 11% 9%
In total across the four areas there is 568ha zoned for LIZ, and 29ha for HIZ, of which 64ha LIZ (11%) and
2.5ha HIZ (9%) are vacant land. In total 79% of the Business land across North Shore and Southern
Rodney is within North Shore, but only 13% of the vacant land (9ha) is there. This indicates that there is
already some pressure on Business land on the North Shore, and given the more mature nature of the
urban environment there, this implies that SWDF will accommodate most of the future growth in
Business land north of the Harbour Bridge.
The spatial distribution of that Business land is shown in Figure 3.2.
Page | 5Figure 3.2: Silverdale Wainui Dairy Flat Business land (operative AUP zoning, as at July 2017)
Highgate LIZ
Silverdale
LIZ and HIZ
Dairy Flat LIZ
North Shore LIZ
to the south
3.2 FULSS
The Future Urban Land Supply Strategy (2017) sets out the order in which FUZ land in Auckland is
expected to be made available for development over the next 30 years. Six areas within SWDF are
delineated in the FULSS, and are identified as to when they will be development ready:
• Upper Orewa resource consent area - ready for development now
• Wainui East – 2017, live zoned
• Silverdale Wainui Dairy Flat FUZ (Business) (2018-2022)
• Silverdale Wainui Dairy Flat FUZ (remainder) (2033-2037)
• Wainui East FUZ (remainder) (2033-2037)
• Upper Orewa FUZ (2033-2037).
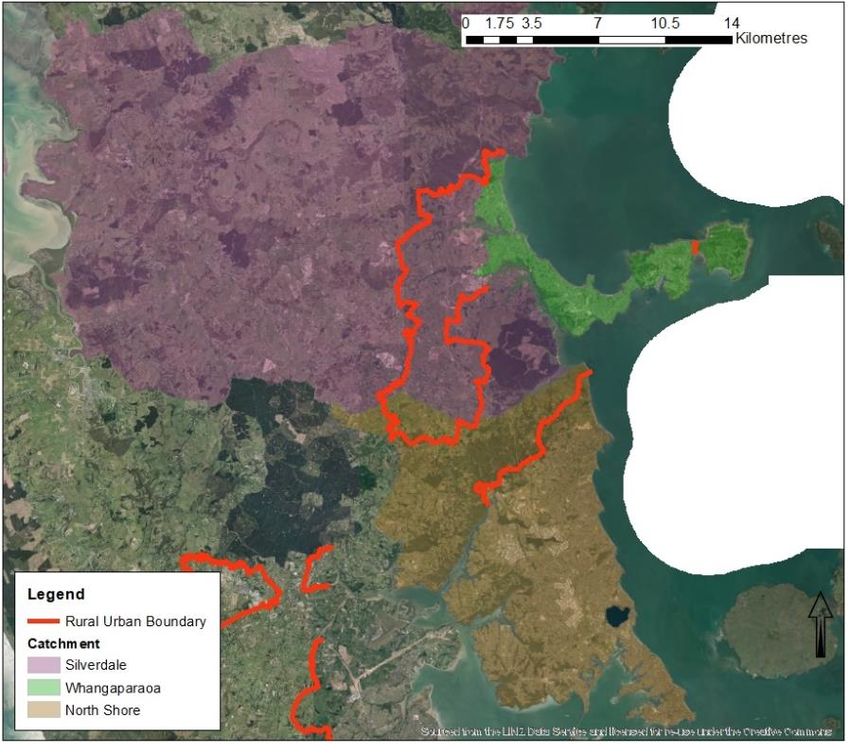
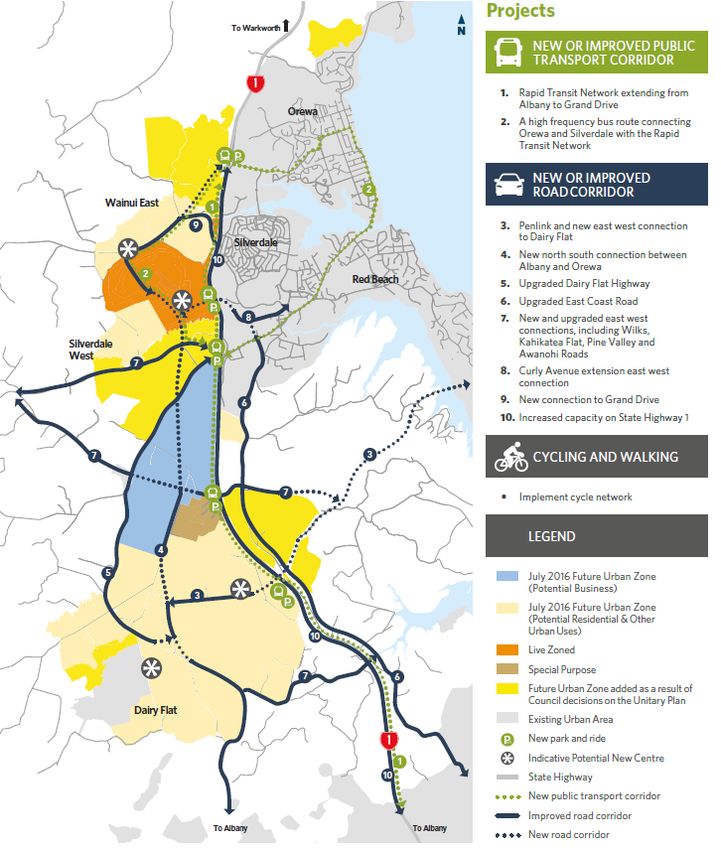
Page | 6Note that these timings are from the 2017 refresh of the FULSS, in which timings differ slightly from the initial 2015 version. The residential capacity of these areas is also identified, with capacity for 4,500 dwellings in Wainui East (live zoned part), 575 dwellings in Upper Orewa (consented), 20,400 dwellings in Silverdale Wainui Dairy Flat (remainder) and 7,400 in Wainui East (remainder). Upper Orewa’s capacity is included in the Wainui East capacity. The total dwelling capacity across all these areas identified in the FULSS is 32,875 dwellings. Note that this ‘development ready’ timing does not imply that development will actually start at that time, and certainly not that development will be complete at that time. Instead the dates indicate when development in the area could begin. In practice it will be many years before each of the areas is fully developed, with the development rate being influenced by market attractiveness, the owners/developers’ willingness to develop and underlying, regional growth trends. Figure 3.3: FULSS future urban area sequencing 3.3 Supporting Growth project As discussed above, the FUZ has not yet been split into different zones, other than the few small parts which were live zoned as a result of the AUP hearings, and some indications provided by the Supporting Growth project (Figure 3.4). The Supporting Growth indication is that over 600ha of the FUZ could potentially become future business land (the blue areas in Figure 3.4), although that is only an indication, and any zoning process will occur gradually and for different pieces of land, subject to the findings of reports such as this one, structure plans and finally plan changes. The Supporting Growth business land area provides some initial baseline for this assessment to report back against. The Supporting Growth work takes into consideration high level constraints about where Business land can establish. These will need to be considered in more detail when advancing plan changes to live zone Page | 7
the land, given the need for particular characteristics for Business land which usually include large, flat
sites that are located close to transport links, but not located too close to sensitive receiving zones
(especially residential). Those constraints will limit where Business land can be zoned, and the yield of
usable Business land from the initial gross area.

Figure 3.4: Supporting Growth FUZ potential land uses3

3   https://at.govt.nz/media/1973819/supporting-growth-full-brochure.pdf

Page | 8
3.4             NPS Urban Development Capacity
The NZ Government has produced a National Policy Statement on Urban Development Capacity (the
“NPS”). That document set out certain requirements for councils, particularly in high growth areas such as
Auckland, to provide evidence that they are providing adequate capacity for growth4. To meet its
obligations under the NPS, Auckland Council commissioned Market Economics to undertake an
assessment of demand and supply of business land across the region, including all centre zone types,
industrial zones and other businesses zones such as the Mixed Use and General Business zones.

Market Economics completed that assessment in late 2017, and the work is now being reviewed by the
Ministry of Business, Innovation and Employment, the government department with jurisdiction over NPS
matters. The work completed by Market Economics assessed that in the Urban North catchment there
would be demand for an additional 493,904m2 of floorspace in industrial zones by 20485. That floorspace
translates into an additional 164.6ha of industrial land needed by 2048 (assuming FAR of 0.3, as described
in the report).

That projection represents a single possible outcome of future land demand, and is based on a medium
growth economic outlook, as required by the NPS as a minimum threshold. The projection forms part of a
larger regional analysis that quantifies total regional economic growth, and distributes that growth
around the region. That sub-regional allocation is driven by an assessment of suitability for development
for each type of land use, using a Machine Learning Model (MLM) algorithm that takes into account
vacant land capacity, existing land uses, transport network accessibility, and proximity to other similar
activities.

A key characteristic of this modelling is that growth can only be allocated to a location in the NPS
assessment if there is adequate zoned vacant capacity available now, and so the model does not attempt
to allocate business activity to greenfields (e.g. FUZ) areas. Areas that are intended to be developed for
some business activity in the future, in line with regional planning strategies, are effectively excluded
from the NPS assessment. That means that the only growth in industrial activity anticipated in Silverdale
and elsewhere in the Urban North is on existing zoned land. The creation of more zoned industrial land,
such as might be expected in the Silverdale FUZ, would be significant as it would likely result in more
regional growth being allocated to Silverdale, and less to other locations (as shown in the NPS modelling).

The Method 2 (Catchment) approach applied in this study represents an alternative land demand future,
unconstrained by a lack of existing zoned land, and attempts to describe how much industrial land might
be required given the perpetuation of recent historic employment and labour force trends in the Urban
North.

4   Sufficient supply to match demand in the short (0-3 years), medium (3-10 years) and long (10-30 years) term.
5   http://www.knowledgeauckland.org.nz/publication/?mid=1781, p235 (Figure 3-8)

Page | 9
4            Business land demand
This section provides an assessment of the demand for business land in SWDF, and is intended to provide
a high-end estimate of future land requirements which then gives greater confidence that the future land
supply will meet demand. Demand assessed in this section covers the Light Industry zone (LIZ) and Heavy
Industry zone (HIZ). Not included are the General Business zone, Mixed-Use zone and centres, which fall
outside the scope of this work and may be addressed as the subject of a future study.

Those other zone types are more permissive to a wider range of business activity, including retail and
offices. While those zones could accommodate many of the same activities as the LIZ (given the activity
status of industrial activities in them) providing broad new areas of those zones would result in challenges
in the way of centres planning, and maintaining the centres hierarchy and focussing particular types of
activity in centres. Such zones will be provided for in other parts of the Future Urban zone and be subject
to structure planning for those areas. For those reasons it will appropriate to have a much smaller area of
those zones6, and for those to be the subject of a separate study.

To recap, two scenarios are presented here:

             •     Method 1 (Urban North): employment and land projections are driven by projected
                   growth in the Urban North part of Auckland (North Shore and Hibiscus Coast) from work
                   completed for the IHP.

             •     Method 2 (Catchment): employment and land projections are driven by household
                   growth in the area, and in a manner that is consistent with recent historical employment
                   and labour force trends, unconstrained by any predetermined land availability limits. The
                   merits of this approach are that a new industrial growth area can be created to fit with
                   regional and sub-regional planning objectives and policies, unlike Method 1 which reflects
                   the constraint that is created by current land zoning.

4.1          Method 1 (Urban North)
4.1.1        Business land demand
The IHP work (discussed in section 3) indicates that there will be demand for an additional 146ha of
business land by 2038, and 213ha by 2048, in the Urban North area7. That 2048 total will be dominated
by demand for LIZ land (207ha), with demand for only 6ha of HIZ. Those demands are driven by regional
economic growth outlooks and projected population growth and are influenced by the current
distribution of economic activity and zoned business land.

6 Or else to include precinct overlays with restrictions as to certain types of activities, so as to, for example, limit the total
quantum of retail activity that might locate in them.
7 North Shore and the southern part of Rodney, including Orewa, Whangaparaoa and Silverdale

Page | 10
Figure 4.1: Urban North Business land growth over 2016 (ha)
Zone 2016 2018 2028 2038 2048
Heavy Industry - 0.4 2.3 4.3 6.2
Light Industry - 12.9 77.6 142.2 206.9
Total - 13.3 79.9 146.5 213.1
4.1.2 Vacant land
Some of that projected growth will be able to establish on land that is currently vacant, or significantly
under-utilised (referred to as ‘vacant potential’), as described in sections 2.3 and 3.1. There is some 66ha
of vacant business land in the Urban North area now that would be available for development, including
64ha of LIZ, and nearly 3ha of HIZ (Figure 4.2).
Figure 4.2: Urban North catchment vacant Business land 2018 (ha)
Zone Vacant
Heavy Industry 2.5
Light Industry 63.8
Total 66.3
4.1.3 Silverdale Wainui Dairy Flat Additional Business land required
Given current vacant land in the Urban North, and projected demand growth, it will be some time before
additional zoned land is required in the area. At a projected average annual growth rate of 6.5ha per year
in the Urban North out to 2048, and current vacant business land of 66ha, further supply of LIZ land is not
expected to be needed until about 2025, and over 140ha of additional LIZ land (i.e. more than what is
currently zoned) would be needed by 2048, along with around 4ha of HIZ land (Figure 4.3).
Figure 4.3: Method 1: Urban North catchment demand shortfall at each time (ha, net of roads etc,
includes UDS 15% buffer)
Zone 2016 2018 2028 2038 2048
Heavy Industry - - - 1.8 3.7
Light Industry - - 13.8 78.4 143.1
Total - - 13.8 80.2 146.8
However, these projections are based on the assumption that existing demand patterns continue. If a
large quantum of new land were to be zoned in the Urban North, such as in the SWDF, that zoning would
potentially result in a redistribution of regional economic growth, making the Urban North a more
attractive LIZ location. That is essentially a case of “build it and they will come” (to some extent), and
would mean that the existing preferences which the IHP work is based on would change. That potential
change is taken account of in the Method 2 assessment below.
Page | 11The projections in Figure 4.3 are net of roads etc, and can be converted to gross numbers by applying an
assumed proportion that would be occupied by roads etc. The actual net to gross yield will be influenced
by topographic factors, the layout of the roading network etc., and could only accurately be determined
once appropriate land is chosen, and design work is completed. The important output from this
assessment is therefore the net figure, however we also present a gross estimate (Figure 4.4) by
assuming that business land will occupy 72.5% of the gross area, with the balance used for road reserves
etc. That 72.5% is only an approximate gross to net conversion factor, and is calculated as the mid-point
of 70% and 75%, both of which numbers are often applied as an indicative gross to net conversion factor.
Figure 4.4: Method 1: Urban North catchment demand shortfall at each time (ha, approximate gross)
Zone 2016 2018 2028 2038 2048
Heavy Industry - - - 2.4 5.1
Light Industry - - 19.0 108.2 197.4
Total - - 19.0 110.6 202.5
4.2 Method 2 (Catchment)
4.2.1 Catchment
The catchment used for Method 2 is defined with reference to how Silverdale will function as an
industrial area within Auckland. The catchment was defined to include all areas between the Harbour
Bridge and half way to Warkworth, and constrained by the presence of large future industrial areas in the
north-west (such as Whenuapai). The catchment applied is shown in Figure 4.5.
Figure 4.5: Method 2 catchments
Page | 12The North Shore subcatchment does not correspond exactly with the boundary of the former North
Shore City Council, rather the boundary was defined to be roughly half way between the existing
Silverdale industrial area and Albany.
4.2.2 Approach
This method differs to Method 1, as it assumes that future workforce growth will be driven by underlying
population growth, whereas Method 1 assumes a particular share of total regional economic growth. The
process used for Method 2 uses the following base data:
• Historic and current household counts in each subcatchment.
• Historic and current employment counts in each subcatchment, both in total across all
zones and on industrial zoned (LIZ and HIZ) land specifically.
• Household projections (per section 2.6).
That data is used to:
• Assess historic employment trends, including in per household terms, and the share of
all employment that has been based in industrial zones.
• Assess past trends to project forward potential future trends of employment per
household and industrial share of employment.
• Project forward total future employment (by applying assumed per household
employment ratios).
• Project forward future employment likely to be based in industrial zones.
• Allocate future industrial zone employment capacity across the catchment, with
reference to capacity constraints.
4.2.3 Input data
Historic employment per household
Silverdale has experienced more rapid growth than Whangaparaoa and North Shore since 2000, albeit off
a smaller base, and now comprises 6.3% of catchment households, up from 4.4% in 2000 (Figure 4.6).
Figure 4.6: Catchment household counts (2000-2016)
Whangap North
Year Silverdale Total
araoa Shore
2000 3,750 11,640 70,690 86,080
2004 4,200 13,160 74,990 92,350
2008 4,790 14,580 78,880 98,250
2012 5,560 15,830 82,290 103,680
2016 7,110 17,360 88,480 112,950
Page | 13North Shore is by far the dominant subcatchment in terms of both household numbers and employment,
both industrial and other. However, capacity constraints will result in Silverdale continuing to grow in
relative importance. Currently Silverdale accommodates 9.3% of the catchment’s employment located in
industrial areas (3,040 workers, or MECs8), and 4.5% of other employment (4,760) (Figure 4.7). North
Shore accommodates nearly 91% of industrial zone employment, and 85% of total catchment
employment.
Figure 4.7: Catchment employment counts (2000-2016)
Industrial Zone MECs Non-Industrial Zone MECs Total MECs
Whangap North Whangap North Whangap North
Year Silverdale Total Silverdale Total Silverdale Total
araoa Shore araoa Shore araoa Shore
2000 1,720 - 23,500 25,220 2,230 9,660 60,270 72,150 3,950 9,660 83,760 97,370
2004 2,040 - 29,630 31,670 2,990 10,600 65,610 79,210 5,030 10,600 95,240 110,880
2008 2,910 - 30,120 33,030 3,520 12,420 73,680 89,620 6,430 12,420 103,800 122,650
2012 2,640 - 26,530 29,170 3,630 11,540 78,100 93,270 6,270 11,540 104,640 122,450
2016 3,040 - 29,640 32,680 4,760 13,680 88,200 106,640 7,800 13,680 117,840 139,320
Combining the two datasets (households and employment) yields a description of trends in per
household employment. There are now 1.23 MECs per household across the whole catchment (both
industrial and non-industrial), and that figure has stayed within a range of 1.17-1.25 since 2004 (Figure
4.8). The Silverdale subcatchment has shown similar trends, although with slightly more variation, as a
result of the smaller employment base there.
Figure 4.8: Historic total employment and employment per household (2000-2016)
Employment in the catchment’s industrial zones has also been relatively stable, although the period of
stability is limited to more recent times. Although industrial zone employment per household is currently
at about the same level as in 2000, in the intervening period employment per capita was somewhat
higher, particularly immediately before the Global Financial Crisis (2004-2008) (Figure 4.9). The large
8 Modified employment count, a measure of employment incorporating paid employees and working proprietors
Page | 14North Shore employment base showed less volatility, and has remained at between 0.32 and 0.33 MECs employed on industrial land per household in every year between 2010 and 2016. Figure 4.9: Historic Industrial zone employment and employment per household (2000-2016) The conclusion from this assessment is that the current total employment per household (1.23) appears to be a reasonable base from which to project forward future employment numbers using household growth as the driver. Of that 1.23 MECs per household, 0.94 MECs were non-industrial MECs, and 0.29 were industrial MECs. Industrial zone employment trends The share of employment that is located in the catchment’s industrial zones has also remained relatively stable since 2000, with a slight decline in that share in both Silverdale (from 44% in 2000 to 39% in 2016) and North Shore (28% to 25%), although overall the share across the entire catchment has remained at either 23% or 24% every year since 2010, indicating a measure of stability in recent years (Figure 4.10). Page | 15
Figure 4.10: Catchment Industrial Zones share of total employment

An important observation about the industrial zones, and the LIZ in particular, is that they accommodate
a very wide range of activities, either because those activities are permitted, have been consented or
have existing use rights. Activities in industrial zones include those commonly thought of as industrial,
such as manufacturing (25% of LIZ employment in 2016) and transport businesses (7% of LIZ
employment), but also other activities such as wholesaling, retail trade (particularly trade retailers and
large hardware stores such as Bunnings and Mitre 10 Mega) and a wide range of service activities (Figure
4.11). Projecting forward future demand for industrial land needs to consider trends in all of these
sectors (many of which have been experiencing strong growth), and not only manufacturing (where
employment across all locations is declining).

Figure 4.11: Auckland LIZ employment (2016, share of MECs)

Household projections

There are currently 114,900 households resident in the three sub-catchments, with North Shore being by
far the largest (90,800). Silverdale is projected to accommodate 54% of the increase in households out to
2048, on the back of 600% growth (+42,500 households). North Shore households will increase by slightly
less (+33,400) in the same time (Figure 4.1).

Page | 16
Figure 4.12: Catchment household projections

                                                                         Growth 2016-48
   Catchment        2016      2018       2028       2038       2048
                                                                           n          %
Silverdale            7,110     8,100     13,900     28,100    49,600     42,490       598%
Whangaparaoa        17,360     16,000     17,600     18,700    19,700      2,340          13%
North Shore         88,480     90,800    102,400   111,500    121,900     33,420          38%
Total              112,950    114,900   133,900    158,300    191,200     78,250          69%

4.2.4        Employment projections
From this input data the assessment then extrapolates past trends to project potential future
employment. This is a reasonable approach given stability in employment per household and the share of
all employment that is in industrial zones. To take into account the slight decrease in the share of all
employment that is in the Silverdale industrial zone, the assessment makes allowance for that share to
decrease in the future across the entire catchment, and to decrease from 23.5% now to 22.5% in 2028,
and a further 1% in each of the next two decades.

Applying constant employment per household (1.23 MECs per household) forward, the current
catchment workforce of 139,000 MECs would increase to 236,000 by 2048, growth of 69%, or the same
rate of growth as is projected for catchment households (Figure 4.13).

Figure 4.13: Catchment employment projections (MECs, all sectors)

                                                                          Growth 2016-48
   Catchment        2016      2018       2028       2038       2048
                                                                           n          %
Total              139,300    141,700   165,200    195,300    235,900     96,600          69%

That is significantly more growth than indicated by Method 1, and would result in greater growth in
demand for business land. Even accounting for an assumed slight decrease in the share of that
employment that is based in industrial zones, there would then be expected to be, across all three
subcatchments in total, 37,200 MECs in industrial zones in 2028, 42,000 in 2038, and 48,400 in 2048
(numbers calculated in rows P, Q and R of Figure 4.14). That equates to growth of 15,700 MECs since
2016 (48%).

Our assessment of Council vacant land capacity indicates that there is a constraint to accommodating
that growth in North Shore. Our detailed 2018 assessment of that data, on a parcel by parcel basis,
indicates that there is only some 8.8ha of vacant land, even accounting for vacant potential land (land
that is underutilised and could be more efficiently used in the future). That land might accommodate only
around 320 MECs, assuming an average employment density of 36 MECs/ha. That constraint indicates
that the majority of the industrial zone employment in the catchment would have to be accommodated
elsewhere in the catchment, and Silverdale, as the greenfields growth area, is the natural location.

Page | 17
Figure 4.14: Method 2 Industrial Zone employment projections
Whangapar
Silverdale North Shore Total
aoa
Households
2016 a 7,110 17,360 88,480 112,950
2028 b 13,850 17,640 102,430 133,910
2038 c 28,130 18,660 111,550 158,340
2048 d 49,640 19,730 121,910 191,280
MECs/household
2016 e=f/a 1.10 0.79 1.33 1.23
MECs
2016 f 7,800 13,680 117,840 139,320
2028 g=e*b 15,190 13,900 136,420 165,180
2038 h=e*c 30,860 14,700 148,570 195,310
2048 i=e*d 54,450 15,550 162,370 235,940
Share of employment in industrial zone
2016 j 23.5%
2028 k 22.5%
2038 l 21.5%
2048 m 20.5%
Vacant employment capacity in industrial zone
2018 n n/a - 320
Employment in industrial zone
2016 o 3,040 - 29,640 32,680
2028 p=g*k 7,210 - 29,960 37,170
2038 q=h*l 12,030 - 29,960 41,990
2048 r=i*m 18,410 - 29,960 48,370
That would mean that 15,390 (18,410-3,040 from Figure 4.14) of the 15,690 MECs growth in industrial
zone employment could occur in the Silverdale subcatchment, with industrial employment in that
subcatchment then reaching 18,400 MECs by 2048 (Figure 4.14). The Silverdale subcatchment is an area
broader than the Silverdale Structure Plan area, however any increase in industrial employment in the
subcatchment would likely need to be accommodated inside the Structure Plan area, given most of the
subcatchment is outside the RUB.
Figure 4.15 provides a broad indication of how the additional employment projected for the future SWDF
LIZ/HIZ land might be comprised, by sector, assuming that the future distribution of LIZ and HIZ mirrors
the current distribution within all of Auckland (30.5% HIZ, 69.5% LIZ) and sectoral distribution of each
industrial zone mirror the current distribution across all of Auckland. This employment distribution is very
generalised, and is intended for input into Auckland Transport’s Integrated Transport Assessment for the
area.
Page | 18Figure 4.15: Additional industrial land employment by sector
Catchment 2016 2028 2038 2048
Manufacturing - 1,349 2,901 4,956
Wholesale Trade - 689 1,482 2,531
Construction - 483 1,040 1,776
Retail Trade - 221 476 812
Transport/Post/Warehouse - 339 730 1,247
Prof./Sci./Tech. Services - 251 540 923
Admin/Support Services - 209 450 769
Health Care - 102 220 376
All other sectors - 545 1,171 2,001
Total - 4,190 9,010 15,390
4.2.5 Vacant land
Some of that projected growth will be able to establish on land that is currently vacant. There is currently
some 66ha of vacant business land available for development in the three subcatchments together,
including 64ha of LIZ and 3ha of HIZ (Figure 4.16).
Figure 4.16: Silverdale, Whangaparaoa and North Shore vacant Business land 2018 (ha)
Zone Vacant
Heavy Industry 2.5
Light Industry 63.8
Total 66.3
4.2.6 Silverdale Wainui Dairy Flat Additional Business land required
That net growth in industrial employment in Silverdale (15,390 MECs, from the first row in Figure 4.179)
would then require land to operate from. Applying the same workspace and floor area ratios as for
Method 1, that employment would require 115ha by 2028, 248ha by 2038, and 423ha by 2048 (Figure
4.17). Taking into account vacant land, that growth would require an additional 56ha of industrial zoned
land by 2028, 209ha by 2028, and 410ha by 2048, including an allowance of 15% to adequately provide
for future needs per UDS requirements. This growth is influenced by ongoing residential growth in North
Shore and Whangaparaoa driving industrial growth, which is only able to be accommodated in Silverdale,
so Silverdale will play a sub-regional role in accommodating growth.
Because demand under this method is linked to catchment household counts, the rate of increase of
demand for business land would increase once the large areas of FUZ become development ready
9 That number is calculated as the growth from 3,040 MECs to 18,410 MECs in rows O and R of Error! Reference source not
found., although differs slightly due to rounding
Page | 19between 2033 and 2038. From that time, demand for additional business land (i.e. over and above
current zoned supply) would increase very quickly. Those demands are net of roads etc, and can be
converted to gross numbers by applying an assumed proportion that would be occupied by roads etc. A
72.5% net to gross conversion is applied here (as explained in section 4.1.3), although the rate achieved
will depend on the characteristics of the land zoned.
Figure 4.17: Catchment Business land growth over 2016 (ha)
2016 2028 2038 2048
Industrial zone employment - 4,190 9,010 15,390
Workspace ratio (sqm/MEC) 89
Industrial floorspace (sqm) 372,900 801,900 1,369,700
Floor area ratio (FAR) 0.32
Land area required (ha) 115 248 423
Additional land required (net, ha) 56 209 410
Additional land required (gross, ha) 77 288 566
This additional land required might be provided as either LIZ or HIZ, as both zones accommodate a similar
range of industrial activities. A main difference between the two zone types is that the range of non-
industrial activities (such as retail, childcare, offices) provided for in the HIZ is more limited than it is in
the LIZ. LIZ would likely be the largest component of that, although there is flexibility to accommodate
that growth using either zone type. If the future distribution of LIZ and HIZ mirrors the current
distribution within all of Auckland (30.5% HIZ, 69.5% LIZ), then by 2048 there would be a demand shortfall
of 125ha of HIZ, and 285ha of LIZ, for a total of 410ha, Figure 4.18 (and as shown in Figure 4.17).
Figure 4.18: Method 2: Urban North catchment demand shortfall at each time (ha, net of roads etc,
includes UDS 15% buffer)
Zone 2016 2018 2028 2038 2048
Heavy Industry 17.1 63.6 124.8
Light Industry 39.0 145.4 285.4
Total 56.0 209.0 410.2
Some of that demand may also be accommodated in other zones, such as the General Business Zone,
although the wider range of activities provided for in those zones (the GBZ in particular) would likely
result in many industrial activities finding it difficult securing space in those zones. Also, because a wide
range of retail and other activities are provided for as either permitted or discretionary activities, a more
widespread distribution of those zones could give rise to retail distribution effects on centres, absent any
precinct overlay controls on retail floorspace limits.
The projections in Figure 4.18 are net of roads etc, and can be converted to gross numbers by applying an
assumed proportion that would be occupied by roads etc. The actual net to gross yield will be influenced
by topographic factors, the layout of the roading network etc., and could only accurately be determined
once appropriate land is chosen, and design work is completed. The important output from this
Page | 20assessment is therefore the net figure, however we also present a gross estimate (Figure 4.19) by
assuming that business land will occupy 72.5% of the gross area, with the balance used for road reserves
etc. That 72.5% is only an approximate gross to net conversion factor, and is calculated as the mid-point
of 70% and 75%, both of which numbers are often applied as an indicative gross to net conversion factor.
Figure 4.19: Method 2: Urban North catchment demand shortfall at each time (ha, approximate gross)
Zone 2016 2018 2028 2038 2048
Heavy Industry 23.5 87.7 172.2
Light Industry 53.8 200.5 393.6
Total 77.3 288.3 565.8
4.3 Business land requirements summary
The ranges indicated by Methods 1 and 2 above are summarised in Figure 4.20. These projections show
considerable variation, driven by the underlying assumptions about the drivers of growth, and the supply
of land which will impact the share of regional growth that will be attracted to this northern part of
Auckland. The strong effect of rapid household growth is evident in the upper end of the ranges given,
and it is likely, given the imminent exhaustion of LIZ supply in the North Shore, that the focus for future
LIZ growth in the Urban North will become the SWDF area, because it is the next nearest LIZ location to
urban Auckland. A similar pattern is expected to be repeated in other parts of Auckland, as the FUZ in
Whenuapai attracts industrial activity in the north-west, and Drury attracts same in the south. The broad
range for HIZ is because Method 2 (the higher HIZ figure) assumes the current total Auckland LIZ/HIZ split
will apply to future SWDF industrial land. Method 1 is driven by regional economic growth outlooks and
are strongly influenced by the current distribution of economic activity and zoned business land. In
essence then, Method 2 assesses the LIZ/HIZ split in a way that is unconstrained by current zoned
business land, and assumes the Council have the flexibility to zone FUZ land in any split without being
constrained by the mix of current zoned land in the area, which should not constrain how the LIZ/HIZ split
is applied.
Figure 4.20: SWDF business land requirements (ha), net of roads etc, and including 15% NPS buffer
Zone 2028 2038 2048
Heavy Industry 0 - 17 2 - 64 4 - 125
Light Industry 14 - 39 78 - 145 143 - 285
Total 14 -56 80 - 209 147 - 410
4.4 Net additional land including non-industrial activities
Total business land required in SWDF will be comprised of land to provide for light and heavy industry,
including some allowance for non-industrial activities to support the retail and other business needs of
Page | 21the local workforce. Those supporting activities might be expected to occupy some 13ha of the LIZ in
SWDF, made up predominantly of automotive-based10 businesses (11ha), with some small allowance for
takeaway food outlets and some limited types of retail, such as are permitted activities in the zone (e.g.
trade retailers) (Figure 4.21). Together with the 147-410ha of land required for core business land
activities, up to 424ha of industrial zoned land would be required in SWDF by 2048. That is likely to be
dominated by LIZ, although there is the potential for a significant proportion of HIZ as well.
Figure 4.21: SWDF total net additional Business land required to 2048 (net ha, excludes roads etc.)
Retail and Business Range
Zone Upper end
services land indicated
Heavy Industry 0 4 - 125 4 - 125 125
Light Industry 13 143 - 285 156 - 299 299
Total 13 147 - 410 160 - 424 424
10 Classified as a quasi-retail activity in the underlying model, and so not included in the LIZ total otherwise
Page | 225 Conclusion Silverdale Wainui Dairy Flat will become one of Auckland’s key growth nodes in the next three decades, and that growth will require significant new provision of retail and services space and business land to accommodate employment and meet the future needs of the community. There are currently 7,100 households resident in the Silverdale subcatchment, and this is projected to increase to nearly 50,000 households by 2048. That equates to average annual growth of between 1,330 households out to 2048. Of that catchment growth, between 74% is expected to be in the FUZ area, and most of that (45% of total growth) will be in the southern part of FUZ. That large southern part of the FUZ will require a significant new retail and business land presence to accommodate the needs of the residential population. There will also be additional growth in neighbouring subcatchments at Whangaparaoa and North Shore, which will also support additional economic growth. Demand for Business Land (LIZ and HIZ) There will be demand for a significant amount of new business land given both projected population growth and SWDF’s proximity to North Shore, where vacant land is very limited. By 2048 this demand will amount to between 160 and 427ha of LIZ and HIZ (net of roads). That range shows considerable variation, due to the underlying assumptions about the supply of business land in the FUZ, businesses’ location preferences, regional economic growth and household employment generation. The SWDF is likely to become the focus for future LIZ growth in the Urban North due to the imminent exhaustion of LIZ supply in the North Shore, because it is the next nearest LIZ location to urban Auckland. The lower end industrial land projection (Method 1) represents a minimum point to meet the requirements of the NPS. This result does not represent a preferred or best outcome. It merely indicates the demand in a medium growth future and does not allow for any future changes in supply which are enabled by the FUZ, and instead assumes no zoning changes. However, if new zoned land is created through a conversion of FUZ into other zones, the distribution of economic growth in Auckland would be expected to change in response. Method 2 is a scenario in which the potential quantum of demand that might result from the quantum of development projected in the FUZ is taken into account, and provides higher estimates of industrial land demand. Because it is inevitable that there will be a conversion of FUZ land into land for other uses, future demand will likely be nearer the upper end of the range presented than the lower end, although demand may not quite reach the upper end of the range. Also, because there might tend to be a move towards higher density development over time, as Aucklanders become more accustomed to higher density living, the ultimate household yield from the area may be higher than is currently expected. If that eventuates, the current dwelling yield, and the employment and industrial land demand that it drives, could well be understated in Method 2 of this assessment. Although the upper end estimates are based on extrapolated recent trends of household employment generation and industrial sector growth patterns, these might not be sustained, given the proximity to North Shore, and especially Albany, which will accommodate a large workforce, especially in commercial activities. Page | 23
That upper end, however, better reflects the potential for changed locational preferences for business
land (especially LIZ) within Auckland, as driven by a substantial new area of LIZ land in SWDF, with all the
benefits that could offer to new businesses (cheaper land than in North Shore and Auckland isthmus,
agglomeration economies, co-location with other similar businesses, shared infrastructure etc.), and so
should be preferred to the lower end estimates.

In any case it would be prudent to plan to accommodate near the high end of that range given the
difficulties with finding more industrial land once other activities are in place. For example, were some
part of the FUZ to be zoned for a higher value land use (such as residential or local centre), it is highly
unlikely that the land would ever revert to a lower value land use (such as industrial, or rural). The fact
that many zones would create higher value land than industrial would indicates there is likely to be some
opposition to the creation of industrial zones in many areas, especially of sufficient size to accommodate
long term (30 years, per the NPS) growth. In the event of the higher growth in industrial land demand
(such as outlined in Method 2) it may be difficult to rezone sufficient land from a post-FUZ, but non-
industrial zone.

Land required for all purposes

Some centres-type activities will naturally locate on business (e.g. LIZ) land, to supply the needs of the
local workforce there, and because some of those activities will be either permitted in the business zones
or more suited there. In total up to 427ha of additional business land might be required in the SWDF
area, and that could be accommodated as any combination of LIZ and HIZ, although historically there has
been much more LIZ-type (and its predecessors) of land than HIZ, with a likely strong dominance of the
former.

That quantum of land is relatively similar to the indication from the Supporting Growth study, which was
600ha gross. Projecting demand for business land in a high growth area such as this, close to a large
established urban area, and when a large change from current economic structures is indicated (i.e. a
likely move of industry to the north) is challenging, however the ranges presented provide a solid
indication that a very significant amount for new centres and other business land will be required in
Silverdale Wainui Dairy Flat in the future.

Page | 24
You can also read