Single-shot electron imaging of dopant-induced nanoplasmas
←
→
Page content transcription
If your browser does not render page correctly, please read the page content below
PAPER • OPEN ACCESS

Single-shot electron imaging of dopant-induced nanoplasmas
To cite this article: C Medina et al 2021 New J. Phys. 23 053011

View the article online for updates and enhancements.

                               This content was downloaded from IP address 46.4.80.155 on 25/09/2021 at 15:11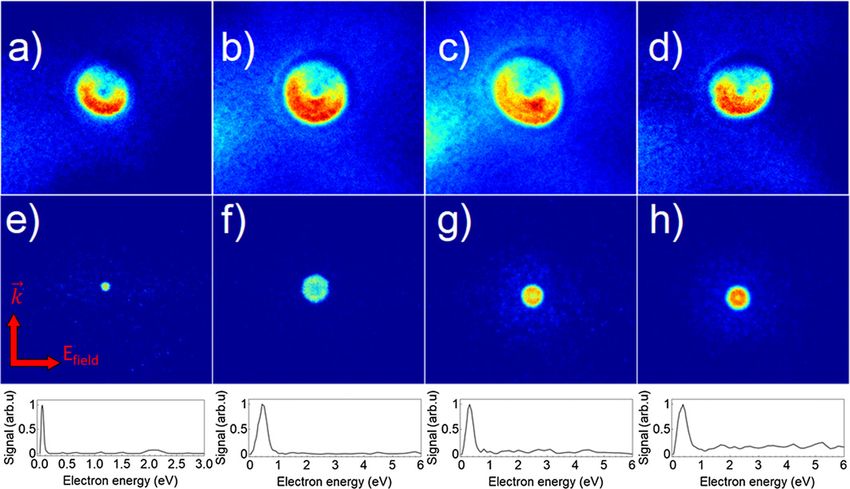
New J. Phys. 23 (2021) 053011                                                                https://doi.org/10.1088/1367-2630/abf7f9

                                 PAPER

                                 Single-shot electron imaging of dopant-induced nanoplasmas
O P E N AC C E S S

                                 C Medina1 , D Schomas1 , N Rendler1 , M Debatin1 , D Uhl1 , A Ngai1 , L Ben Ltaief2 ,
R E C E IVE D
22 February 2021                 M Dumergue3 , Z Filus3 , B Farkas3 , R Flender3 , L Haizer3 , B Kiss3 , M Kurucz3 ,
R E VISE D
                                 B Major3 , S Toth3 , F Stienkemeier1 , R Moshammer4 , T Pfeifer4 , S R Krishnan5 ,
5 April 2021                     A Heidenreich6 , 7 and M Mudrich2 , 8 , ∗
                                 1
AC C E PTE D FOR PUBL IC ATION       Physikalisches Institut, Universität Freiburg, 79104 Freiburg, Germany
14 April 2021                    2
                                     Department of Physics and Astronomy, Aarhus University, 8000 Aarhus C, Denmark
                                 3
PUBL ISHE D                          ELI-ALPS, ELI-HU Non-Profit Ltd., Wolfgang Sandner utca 3., Szeged, H-6728, Hungary
7 May 2021                       4
                                     Max-Plank-Institut für Kernphysik, 69117 Heidelberg, Germany
                                 5
                                     Department of Physics and QuCenDiEM-group, Indian Institute of Technology Madras, Chennai 600036, India
                                 6
Original content from
                                     Polimero eta Material Aurreratuak: Fisika, Kimika eta Teknologia, Kimika Fakultatea, Euskal Herriko Unibertsitatea UPV/EHU,
this work may be used                Donostia International Physics Center (DIPC), P.K. 1072, 20080 Donostia, Spain
                                 7
under the terms of the               IKERBASQUE, Basque Foundation for Science, 48011 Bilbao, Spain
Creative Commons                 8
                                     Indian Institute of Technology Madras, Chennai 600036, India
Attribution 4.0 licence.         ∗
                                     Author to whom any correspondence should be addressed.
Any further distribution
of this work must                E-mail: mudrich@phys.au.dk
maintain attribution to
the author(s) and the            Keywords: imaging, nanoplasma, helium nanodroplets, photoionization
title of the work, journal
citation and DOI.

                                 Abstract
                                 We present single-shot electron velocity-map images of nanoplasmas generated from doped
                                 helium nanodroplets and neon clusters by intense near-infrared and mid-infrared laser pulses. We
                                 report a large variety of signal types, most crucially depending on the cluster size. The common
                                 feature is a two-component distribution for each single-cluster event: a bright inner part with
                                 nearly circular shape corresponding to electron energies up to a few eV, surrounded by an
                                 extended background of more energetic electrons. The total counts and energy of the electrons in
                                 the inner part are strongly correlated and follow a simple power-law dependence. Deviations from
                                 the circular shape of the inner electrons observed for neon clusters and large helium nanodroplets
                                 indicate non-spherical shapes of the neutral clusters. The dependence of the measured electron
                                 energies on the extraction voltage of the spectrometer indicates that the evolution of the
                                 nanoplasma is significantly affected by the presence of an external electric field. This conjecture is
                                 confirmed by molecular dynamics simulations, which reproduce the salient features of the
                                 experimental electron spectra.

                                 1. Introduction

                                 The generation of nanoplasmas in clusters and nanoparticles by intense femtosecond laser pulses is being
                                 widely studied, both for exploring fundamental light–matter interactions under extreme conditions, and in
                                 view of potential applications. Nanoplasmas absorb laser light very efficiently and convert it into fast
                                 electrons [1], highly-charged ions [2], and energetic radiation [3, 4]. Therefore, nano- and microplasmas
                                 bear the potential to serve as sources of extreme-ultraviolet (XUV) and x-ray radiation [5], as compact
                                 accelerators for charged and neutral particles [4, 6], and for high-harmonic generation [7, 8].
                                     The ionization dynamics of clusters and nanodroplets induced by intense near-infrared (NIR) pulses is
                                 fairly well understood, owing to dedicated experiments and detailed model calculations [3, 4, 9, 10].
                                 Initiated by tunnel ionization (TI) [11], an ionization avalanche is launched within a few optical cycles
                                 mainly by electron-impact ionization, thereby releasing a large fraction of electrons from their parent atoms
                                 or ions (inner ionization) [12]. These quasi-free electrons remain trapped in the space-charge potential of
                                 the cluster and mainly determine the optical response of the resulting nanoplasma. Some electrons are
                                 directly emitted by the combined action of the laser and the Coulomb field of individual ions (outer
                                 ionization). Depending on the pulse duration or the delay between short pulses in a dual-pulse scheme,

                                 © 2021 The Author(s). Published by IOP Publishing Ltd on behalf of the Institute of Physics and Deutsche Physikalische Gesellschaft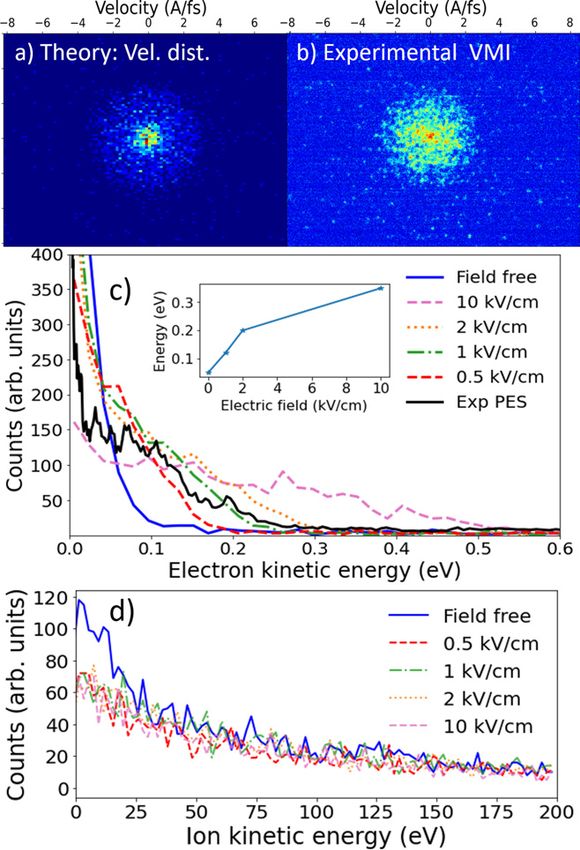
New J. Phys. 23 (2021) 053011                                                                      C Medina et al

resonant absorption occurs, thereby further enhancing the yield, charge state and kinetic energy of emitted
ions [13, 14]. As the nanoplasma heats and charges up, it starts expanding and electrons evaporate out of
the collective Coulomb potential of the cluster core. This leads to a thermal distribution of free electrons
characterized by an essentially exponential energy dependence [15–19]. Finally, slow electrons and ions
partly recombine in the course of the expansion. Highly excited neutral and ionic species formed during
this phase can decay by correlated electronic decay processes, as recently observed [18–21].
    Helium (He) nanodroplets are a special type of rare-gas clusters due to the extremely high ionization
energy of He atoms and the unique superfluid nature of He droplets [22]. When doping He droplets with
impurity atoms or molecules, the latter tend to aggregate inside the droplet or at the surface where they
form a cluster. Electrons emitted from this dopant cluster by TI then act as seeds to ignite a nanoplasma in
the entire He droplet [23, 24]. Thus, doping He droplets with various types of atoms or molecules in an
adjustable quantity offers an additional control knob to tune the susceptibility of the droplets to intense
NIR pulses [23–25]. In particular, the addition of a few dopant atoms with low ionization energy such as
xenon (Xe) can drastically reduce the intensity threshold for nanoplasma ignition [23–26]. Furthermore,
electron spectra of ionized He droplets are relatively simple to interpret due to the simple electronic
structure of He and the large spacing between atomic levels [19].
    Experimentally, He nanodroplets can be created in a wide range of sizes spanning many orders of
magnitude [27, 28]. Dopant clusters formed by aggregation are mostly located inside the nanodroplets, the
only exception being alkali metals which reside in dimple states at the droplet surface [26]. In contrast,
neon (Ne) clusters are solid nanocrystallites. The location of dopants picked up by Ne clusters inside or at
the surface of the clusters is less well defined [29, 30].
    He nanoplasmas have mainly been studied using ion detection techniques [24–26, 31]. Recently,
time-of-flight (TOF) spectroscopy of electrons has revealed additional details about the dynamics of He
nanoplasmas [19, 21, 32]. However, so far only averaged data over many laser shots and nanoplasma hits
have been reported. In this paper, we present for the first time single-shot electron images from individual
He nanoplasmas driven by intense NIR and mid-infrared (MIR) femtosecond laser pulses. We show typical
examples of individual velocity-map images (VMIs) recorded under different conditions, and we
systematically analyze large sets of VMIs to identify important trends and dependencies. By simultaneously
recording electron VMIs and ion TOF mass-over-charge spectra we find that electron and ion kinetic
energies are strongly correlated by a simple power law.
    The salient feature of the VMIs is a mostly centro-symmetric intensity distribution with greatly
fluctuating size and brightness for each plasma explosion. We show that this feature can be described by a
simple heuristic model based on a homogeneously charged spherical electron cloud. A more complete
classical molecular dynamics (MD) simulation shows that the external electric field applied in the VMI
spectrometer for extracting electrons and ions influences the electron energy distributions. Simulated
velocity distributions and electron spectra are compared with the experimental data.

2. Methods

2.1. Experimental setup
The nanodroplet apparatus resembles the one we have used previously [10, 14, 26]. The main novelty is the
implementation of a combined VMI and TOF detector, capable of detecting energetic electrons and ions,
see figure 1, [33]. The He nanodroplets, respectively Ne clusters, were produced by a supersonic expansion
at high stagnation pressure (p0 = 20–50, 10 bar) and low temperature (T0 = 9–15 K, 37–41 K) through a
thin-walled nozzle with a diameter of 5 μm for He and 20 μm for Ne. The size of He nanodroplets was
estimated based on literature data [27]; the Ne cluster size was calculated using Hagena’s scaling law [34].
Doping with Xe atoms is achieved by passing the clusters through a doping cell containing Xe gas at
adjustable pressure, see figure 1. The size of the Xe dopant cluster is estimated based on the Poissonian
pick-up statistics while taking into account the shrinkage of the He droplets induced by the aggregation of a
dopant cluster [35].
    NIR (800 nm) laser pulses of 35 fs duration (FWHM) with a repetition rate of 3 kHz are focused into
the cluster beam using a back-focusing mirror with a focal length of 75 mm. With a pulse energy of up to
200 μJ, the peak intensity ranges up to 1.5 × 10¹⁵ W cm−2 as inferred from the distribution of charge states
of strong-field ionized Xe atoms [36]. Most of the measurements presented in this work were measured at a
pulse energy of 80 μJ. A few experiments were carried out using a high-repetition-rate (100 kHz) MIR laser
centered at a wavelength of 3.2 μm which provides pulses with energy up to 100 μJ and a length of about 6
optical cycles (50 fs) [37], yielding peak intensities up to 4 × 10¹⁴ W cm−2 . This laser system was located at
the ELI-ALPS Research Institute in Szeged, Hungary.

                                             2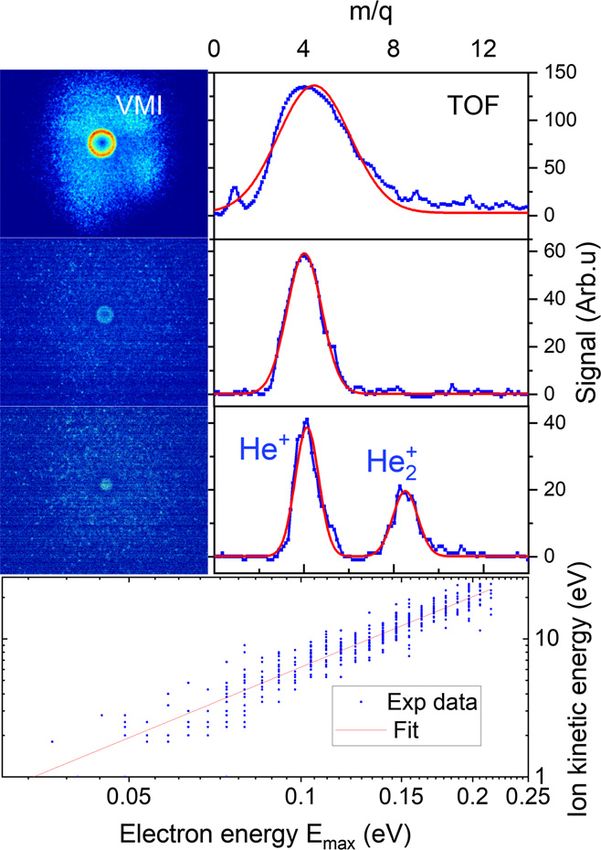
New J. Phys. 23 (2021) 053011                                                                                           C Medina et al

   Figure 1. Schematic illustration of the experimental setup. The He droplet source, doping cell and spectrometer are contained in
   differentially-pumped vacuum chambers separated by beam skimmers. Electrons are imaged on an imaging detector at the top of
   the spectrometer; ions are detected by a Daly type TOF detector at the bottom. The laser beam is back focused into the He
   droplet beam at right angles by a spherical mirror (f = 75 mm).

    The detector consists of a compact VMI spectrometer capable of detecting high-energy electrons [33],
and a TOF ion spectrometer placed on the opposite side which is based on a Daly type detector [38], see
figure 1. The VMI and TOF spectrometers were synchronized to the laser trigger using a delay generator.
One advantage of the single-shot VMI technique is that very short exposure times in the microsecond range
can be used, which reduces the background level. In most of the measurements we adjusted the
experimental parameters such that on average less than 10 % of the images contained a nanoplasma hit to
ensure that the rate of images containing two or more hits remained low. Given the tight focusing of the
laser beam and the low number density of doped He droplets in the interaction region, multiple hits
induced by the same laser pulse can be safely excluded.

2.2. Molecular dynamics simulations
The MD simulation method for the interaction of a cluster with the electric and magnetic field of a linearly
polarized NIR Gaussian laser pulse was described earlier [9, 26, 39]. Starting from neutral atoms, electrons
enter the MD simulation, when the criteria for TI, classical barrier suppression ionization or electron
impact ionization (EII) apply. This is checked at each atom in the course of the trajectory, using the local
electric field at the atoms as the sum of the external laser electric field and the contributions from all ions
and nanoplasma electrons. Instantaneous TI probabilities are calculated by the Ammosov–Delone–
Krainov formula [40], EII cross sections by the Lotz formula [41], calculating the ionization energy with
respect to the local atomic Coulomb barrier in the nanoplasma environment [42]. The electron dynamics is
treated relativistically. Three-body electron-ion recombination (TBR) is automatically accounted for in the
MD simulations.
    Ion–ion interactions are described by Coulomb potentials, ion–electron and electron–electron
interactions by smoothed Coulomb potentials. Interactions between neutral atoms and of neutral atoms
with cations are disregarded. Accordingly, the formation of He+   N cationic complexes as well as collisional
kinetic energy transfer between neutral atoms and between neutral atoms and cations is not accounted for.
The Pauli repulsive potential between electrons and neutral He atoms is taken as a sum of pairwise


forth-order Gaussian functions located at every neutral He atom, V rij = V0 exp −rij4 /σ 4 , where rij is
the He-electron distance, V0 = 1.1 eV [43], and the exponent σ = 1.2 Å is chosen such that the effective
range of Vij is about half of the He–He distance (3.6 Å) of the neutral droplet. The Xe–Xe distances are
4.33 Å (bulk), He–Xe distances 4.15 Å [44]. The simulations are carried out for He2171 Xe23 , NIR pulse peak
intensities I = 2 × 10¹⁴ W cm−2 , and a FWHM pulse duration of 35 fs. For these laser parameters, the He
droplet is nearly completely ionized; the ionization degree depends very little on the initial conditions of the
trajectories, so that averaging over a set of trajectories that is usually necessary in case of doped He droplets
[25, 26] is not needed.
    Simulations are carried out for static homogenous electric field strengths of 0.5, 1, 2 and 10 kV cm−1 . To
mimic the VMI detection, a plane is placed perpendicular to the direction of the static electric field, and the
Cartesian coordinates and velocities of the extracted electrons are recorded upon passing the plane. The
plane is placed in a sufficient distance (5 mm) from the droplet center to avoid that ions reach the plane
during nanoplasma expansion. To achieve simulation times of 10 ns and more, necessary for the electrons
(including latecomers) to reach the plane, each trajectory is subdivided into parts. The first 4 ps covering

                                                      3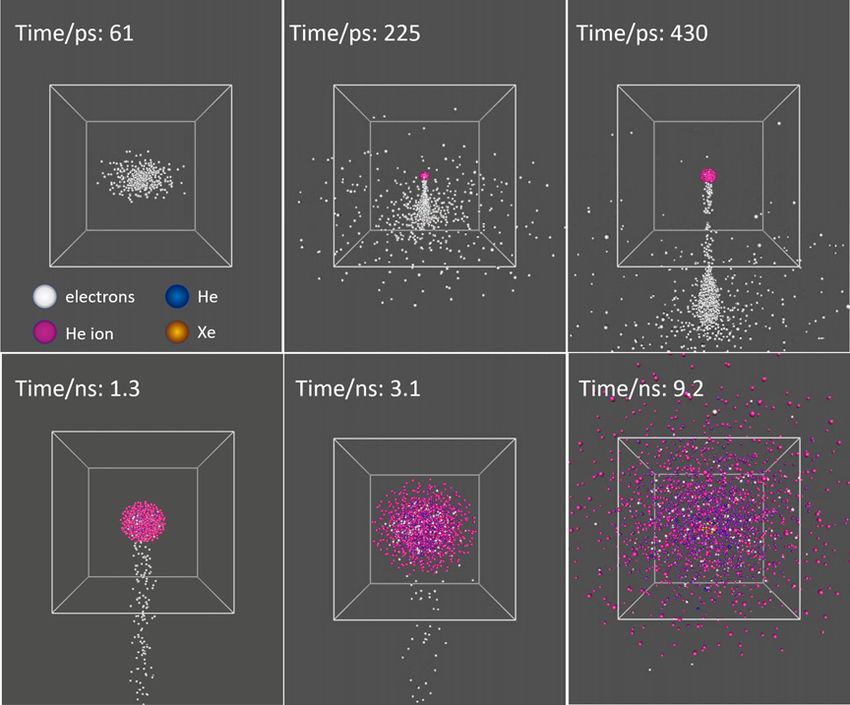
New J. Phys. 23 (2021) 053011 C Medina et al
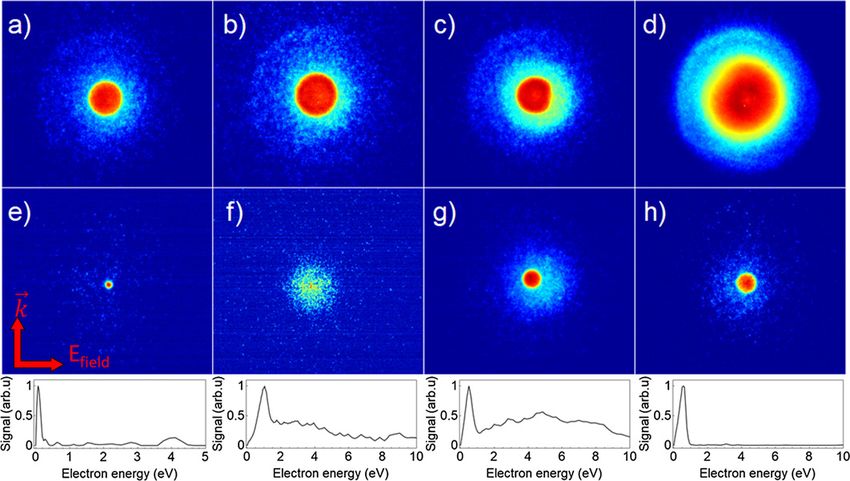
Figure 2. Selected single-shot electron VMIs of He nanoplasmas induced by intense NIR laser pulses. (a), (b) Typical VMIs for
large droplets consisting of 2 × 10⁵ He atoms doped with 40 Xe atoms. (e)–(h) Typical electron VMIs for smaller droplets
(2 × 10³ He and 8 Xe atoms). The arrows in (e) indicate the direction of propagation of the laser (k) and its polarization parallel
to the detector plane (Efield ). The He beam propagates parallel to Efield . The bottom row shows electron spectra inferred from the
small-droplet images (middle row).
the laser-cluster interaction, initial nanoplasma expansion and the vast majority of TBR is carried out with
a short time step of 10−4 fs. After this initial part, the recombined electrons are removed from the
simulation by unifying them with their corresponding host ions, reducing the ion charges accordingly. This
‘recombination step’ not only reduces the number of electrons to be further propagated but is also a
necessary prerequisite to increase the MD time step, since the recombined electrons with tight orbits around
their host ions and binding energies on the order of several eV would otherwise require to continue the
simulation with the small time step to guarantee energy conservation. In the subsequent parts of the
simulation, the MD time step is increased successively up to about 0.1 fs, as the interparticle distances
increase. Correlated electronic decay processes, which could transfer energy from excited He atoms and ions
to neighboring atoms or to quasi-free electrons on the picosecond–nanosecond timescale [21, 45] and
which could give rise to additional features in the electron kinetic energy spectrum, are not included in the
simulation.
3. Results
In usual photoionization experiments of atomic or molecular beams, the ionization probability per laser
shot is kept well below one to avoid blurring of electron VMIs and broadening of TOF peaks by
space-charge effects. In contrast, in this experiment a single laser pulse creates a large number of electrons
and ions when the nanoplasma is formed; consequently, we may expect that the detected electron
distributions are dominated by Coulomb repulsion between the electrons. Only electrons directly emitted
by outer ionization during the laser pulse produce an extended distribution that is not affected by the space
charge. Thus, we may expect to measure two main components in the electron VMIs; a dominant structure
at low energies due to the extraction of nanoplasma electrons by the static electric field, and a more
energetic one due to direct laser-induced outer ionization.
Indeed, all measured VMIs containing nanoplasma electrons feature a two-component distribution, as
shown in figure 2. It is important to note that the brightness and structure of the electron distributions
greatly vary from shot to shot. The top panels (a)–(d) show selected VMIs for large He droplets composed
of 2 × 10⁵ He atoms on average, whereas the middle panels (e)–(h) are for small droplets composed of
2 × 10³ He atoms. The bright inner circular spot mostly has a rather flat intensity profile and a well-defined
outer edge for the case of large droplets. The intensity level inside the inner spot is nearly constant
irrespective of the spot size, resulting in high total brightness for large spots.
For small droplets, a great shot-to-shot variation of the structure of the bright inner spot and the ratio
of inner spot vs the diffuse outer distribution is observed. This can be seen in the kinetic energy spectra
inferred from panels (e)–(h) by an inverse Abel transformation [46], see lower panels in figure 2. The peaks
4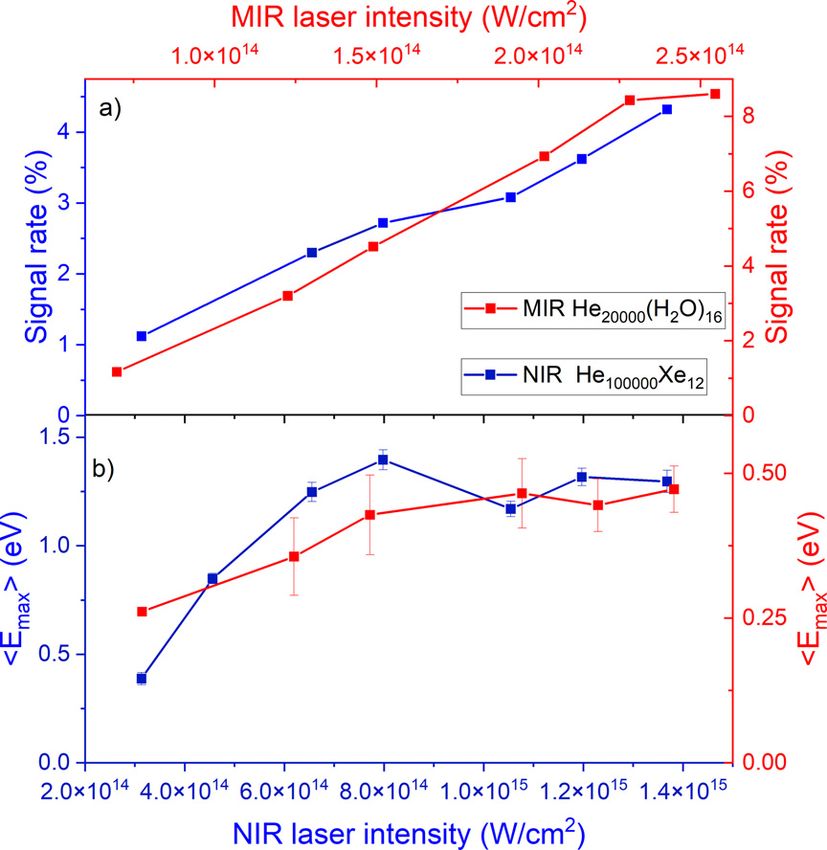
New J. Phys. 23 (2021) 053011                                                                                            C Medina et al

   Figure 3. Selected single-shot electron images of Ne clusters. (a)–(d) Large Ne clusters consisting of on average 6000 Ne atoms
   doped with 10 Xe atoms ionized by an MIR laser pulses. (e)–(h) Ne2000 Xe8 and their respective electron spectra (bottom row)
   ionized by NIR pulses.

at energies 1 eV result from the central spot, whereas the extended shoulder at 2 eV in the two spectra
in the middle is due to the scattered electrons around it. As the latter component is distributed over a large
area of the detector, it is notoriously difficult to unambiguously discriminate it from the noise. The VMI
technique is generally better suited for detecting low-energy charged particles than broad, high-energy
distributions, in contrast to field-free TOF methods [19, 21] and electrostatic analyzers. Therefore, in this
work we refrain from a detailed analysis of the diffuse energetic electron component. For large He droplets,
isolated events were observed where the inner spot deviated from a perfect circular shape, showing dents
(panels (c) and (d)) or slightly oval elongations. These distortions indicate that the shapes of large He
droplets deviate from the spherical symmetry, which is well-known from x-ray diffraction experiments [47,
48].
    Similar experiments were carried out with Xe-doped Ne clusters, see figure 3. In panels (a)–(d), Ne
clusters with an estimated mean size of NNe = 6 × 10³ atoms were irradiated by intense MIR laser pulses;
panels (e)–(h) show VMIs of Ne clusters of size NNe = 2 × 10³ irradiated by NIR pulses. The general
structure of the VMIs is very similar to that of He droplets: a bright inner spot surrounded by a diffuse
cloud of more energetic electrons with variable brightness and radius. While small Ne clusters mostly
generated circular inner spots, for large Ne clusters the inner feature tends to significantly deviate from the
circular shape. This is likely a direct manifestation of a non-spherical shape of the Ne clusters and should be
studied in more detail both experimentally and theoretically. The nonuniform shape of the diffuse cloud
around the inner spot in (a)–(d) is due to technical issues with the spectrometer present in these
measurements. Likewise, the low-brightness region in the upper part of the inner spot is due to a reduced
sensitivity of the detector. When bright nanoplasma VMIs are recorded at a high repetition rate,
degradation of the detector is a serious issue. The electron spectra inferred from the VMIs in (e)–(h),
shown in the bottom row, have a similar structure as the electron spectra of small He nanodroplets. This
indicates that single-shot VMIs of nanoplasma electrons are not particularly element specific but
rather reflect the generic dynamics of electron emission out of a nanometer-sized quasi-neutral expanding
plasma.
    Assuming that the VMI technique is in principle applicable to imaging of nanoplasma electrons, we can
convert the measured radial intensity profile into an electron kinetic energy distribution according to
electron-trajectory simulations validated by calibration measurements [33]. Figure 4 shows electron spectra
obtained in this way from averaged VMIs recorded for various mean sizes of He droplets and Ne clusters.
For every cluster size, around 100 images containing nanoplasma signals were averaged. As an example, the
inset displays the resulting average image for He droplets of mean size NHe = 3 × 10⁴ atoms.
    The electron spectra show a pronounced peak structure where the peak position shifts from 0.1 up to
3 eV as the mean He droplet size increases from NHe = 3 × 10³ to 2 × 10⁵ . The electron spectrum for Ne3000
clusters doped with on average 8 Xe atoms closely resembles the one of He3000 doped with 10 Xe atoms.

                                                      5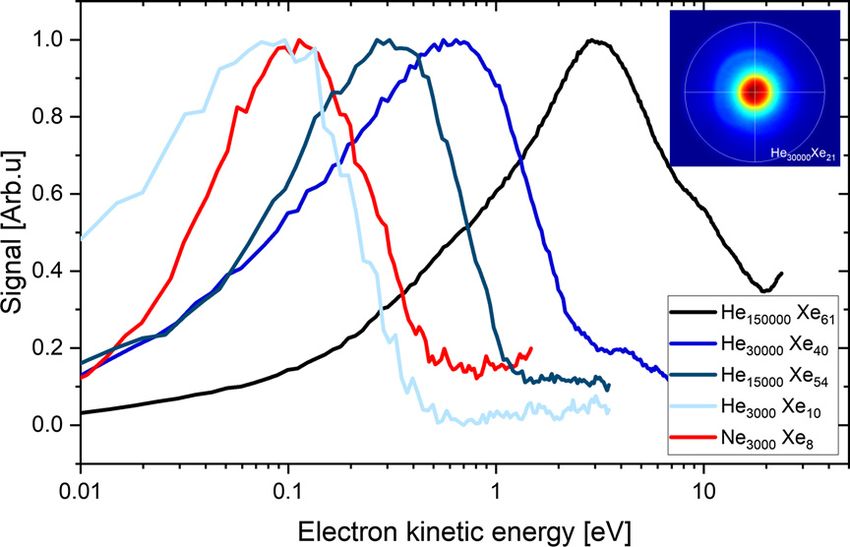
New J. Phys. 23 (2021) 053011                                                                                                C Medina et al

   Figure 4. Electron spectra of averaged VMIs for different He cluster sizes compared to Ne clusters. The inset shows an example
   of the averaged VMIs for He droplets of size 3 × 10⁴ He atoms doped with on average 40 Xe atoms. The outermost white circle
   indicates the edge of the imaging detector.

   Figure 5. (a) Histograms of the electron peak energies Emax of the single-shot VMIs that were averaged in figure 4. The data
   points are the energies for the different He and Ne clusters sizes. The solid lines are Gaussian fits. (b) Cluster size dependence of
   the mean peak energy for the He data shown in (a) including additional cluster sizes. The red line is a linear fit of the
   experimental data.

Thus, by varying the mean cluster size in the shown range, the kinetic energy of emitted nanoplasma
electrons shifts by more than a factor of 10.
    More detailed information should be obtained by analyzing the individual single-shot VMIs. This was
done in two steps. First, those images containing clear signals from nanoplasma electrons were identified by
integrating a small area around the center of the image and comparing the result with a fixed threshold
value. In most of the measurements, a maximum of 10 % of images contained hits and the rest contained
only small numbers of electrons emitted from the residual gas or from small He clusters in the size range

                                                        6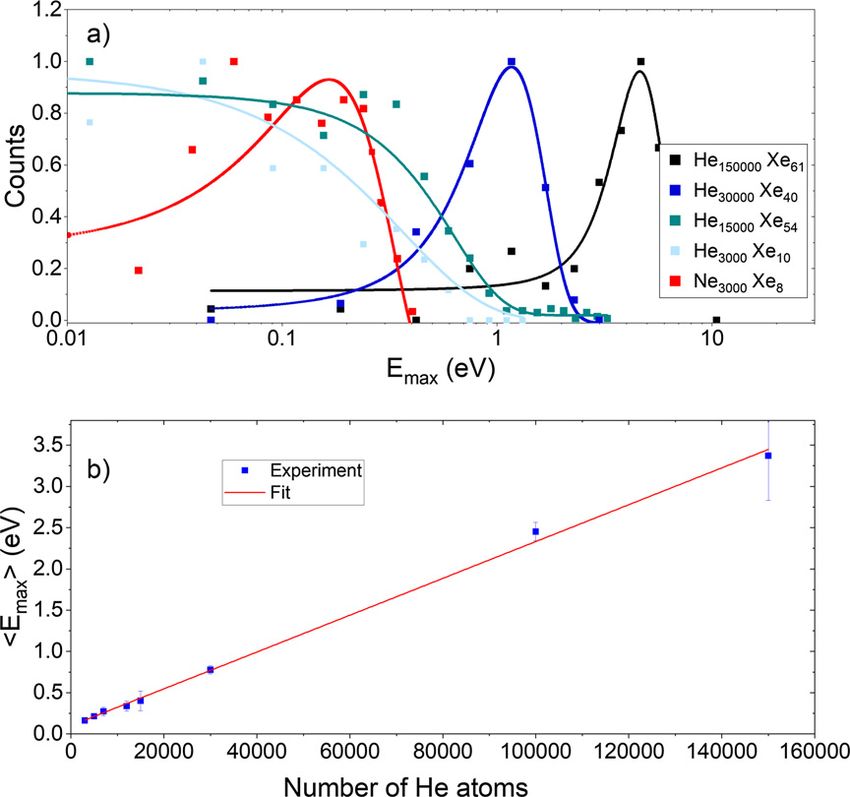
New J. Phys. 23 (2021) 053011                                                                                      C Medina et al

   Figure 6. Dependence on the number of dopant atoms. (a) Fraction of VMIs containing nanoplasma electrons for different He
   and Ne cluster sizes ionized by NIR pulse. (b) Mean electron peak energy. The blue symbols correspond to He droplets of
   different sizes, the red symbols correspond to Ne3000 .

100–1000 atoms. Second, the radius of the inner bright spot was determined by a simple algorithm that
computes the derivative of the radial intensity profile. The radius is then defined by the largest negative
value of the radial derivative. This radius value is directly converted into energy corresponding to the
maximum of the distribution, Emax . The integral of the area within the radius is converted into the total
number of electrons by analyzing the brightness of single electron hits on the detector measured in the
background images.
    Figure 5(a) shows the resulting histograms of Emax values for the individual shots used in figure 4. The
solid lines are fits by a Gaussian function. Overall, both analysis methods are in good agreement. For large
He droplets, the peaks in figure 5(a) are slightly narrower than those in figure 4. This is expected, as in the
histogram analysis (figure 5(a)), the peak width is solely determined by the scatter of Emax , whereas the
shape of each individual electron spectrum is not accounted for. For small clusters, the peaks extend further
towards low energies Emax < 0.1 eV, indicating that a large number of VMIs with small inner spots are
present, which contribute less to the averaged images (figure 4). The mean values of the Emax distributions
shown in (a) and from additional measurements are depicted as squares in figure 5(b). As shown by the
solid line, these mean values Emax  closely follow a linear dependence on the number of He atoms.
    When we apply the same procedure to VMIs recorded for varying Xe partial pressure in the doping cell,
we obtain the data shown in figure 6(b) for He and Ne clusters of different sizes. The data show no
significant variation of the nanoplasma electron energy as a function of the number of Xe dopant atoms
embedded into the clusters. Thus, the nanoplasma is primarily determined by the size of the He or Ne host
cluster, whereas the Xe dopant cluster only facilitates the ignition of the nanoplasma, as previously shown
[23–26]. For higher doping levels, scattering and destruction of the He droplets by multiple collisions with
Xe atoms in the doping cell reduces the signal rate [26]. A minimum of about 5 Xe atoms is needed to ignite
a He nanoplasma, whereas Ne nanoplasmas are measured even at the lowest doping levels of 1 Xe dopant
atom per cluster on average. This is due to the lower ionization energy of Ne, which makes pure Ne clusters
more prone to strong-field ionization as compared to He nanodroplets. The overall similar behavior of Ne
clusters and He nanodroplets with respect to their doping dependence of the nanoplasma ignition indicates
that the structure of the cluster (solid vs superfluid) is not decisive for the dopant-induced activation of a
nanoplasma.

                                                    7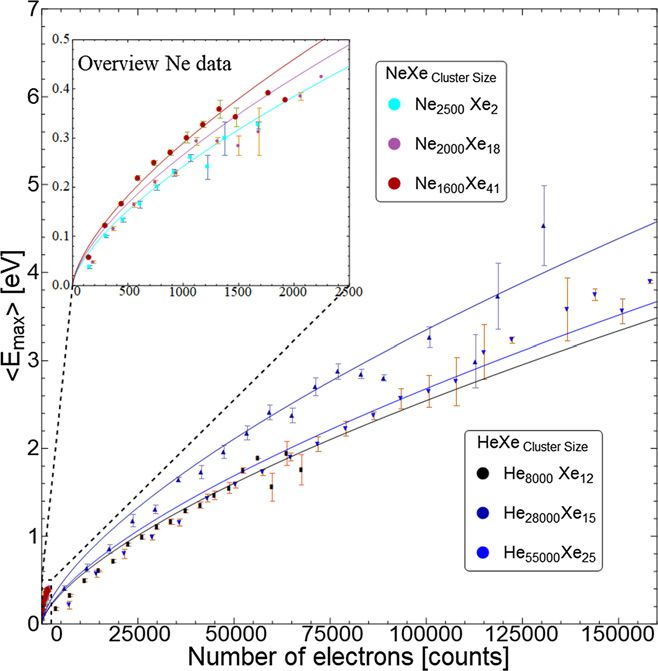
New J. Phys. 23 (2021) 053011                                                                                               C Medina et al

   Figure 7. Laser intensity dependence. (a) Nanoplasma hit rate for He droplets irradiated by NIR and MIR pulses at different
   intensities. (b) Electron peak energy for the two laser types. Notice that the blue axis (bottom and left) corresponds to the NIR
   data and the red (top and right) to the MIR data.

    Similar to the doping dependence, the intensity of the laser pulses significantly influences the abundance
of nanoplasma events, whereas the mean electron energy is only weakly affected. Figure 7 shows the
intensity dependence for He nanodroplets doped with Xe atoms exposed to NIR laser pulses and for He
droplets, doped with water, exposed to MIR pulses at different intensities (note the colored axes at the top
and bottom of the figure). In both cases, the signal rates follow a nearly linear rise with laser intensity.
However, the mean electron energy remains nearly constant within the experimental uncertainty. This is
due to intensity averaging over the volume of the laser focus; while a few droplets are hit by the laser in the
center of the focus and generate more energetic electrons at higher laser intensity, a large number of
droplets in the periphery of the focal volume experience a reduced local intensity, which may still be
sufficient for igniting a nanoplasma. These droplets lead to an enhanced signal rate with rising laser
intensity but contribute mostly with low electron energies. Owing to the single-shot method, we can select
only the brightest nanoplasma images thereby selecting events where the largest droplets are exposed to the
peak intensity. These selected images (not shown) clearly display enhanced electron numbers and energies
when the intensity increases.
    One advantage of the electron VMI technique is the possibility to combine it with ion detection. To
demonstrate this capability, we ignited He nanoplasmas from calcium-doped He nanodroplets with intense
MIR pulses and measured electron VMIs and ion TOF traces for every hit. The upper part of figure 8 shows
typical electron VMIs and correlated ion TOF traces. The bright feature in the VMIs (large number of
emitted electrons) clearly correlates with an intense and broadened He+ peak indicative of high ion kinetic
energies. Even fully ionized He atoms, He2+ , are visible as a small peak in the TOF spectrum shown in the
top right panel. The fact that it appears at a value of m/q slightly below 2 is due to the high He2+ kinetic
energy causing peak deformations [14, 24–26]. In contrast, low-intensity VMIs correlate with narrow He+
and He+ 2 peaks in the TOF traces, indicating low ion kinetic energies and incomplete fragmentation or ion
dimerization occurring in a nanodroplet that is only partly ionized (bottom VMIs panels). The red lines are
Gaussian fits to the peaks.
    The widths σ of the He+ peak fits are converted into ion kinetic energies Ei by the following procedure:
using the SIMION simulation software, TOF traces were simulated for a large number of discrete ion

                                                        8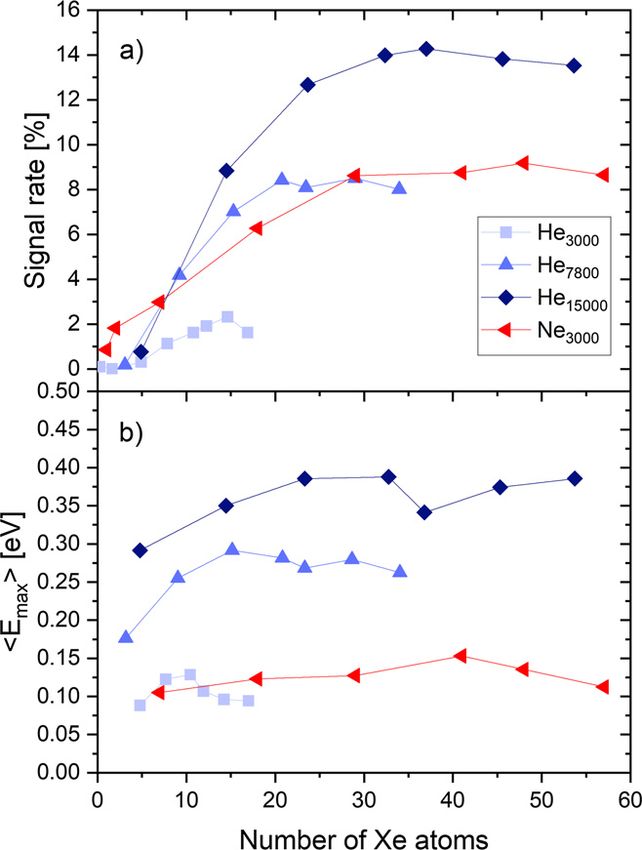
New J. Phys. 23 (2021) 053011                                                                                          C Medina et al

   Figure 8. Selected single-shot electron VMIs of He droplets of size 104 He atoms doped with calcium atoms, irradiated by MIR
   pulses, and ion TOF mass-over-charge spectra measured simultaneously. Blue lines are the experimental data, red lines are
   Gaussian fits. The bottom panel represents ion kinetic energies inferred from the fits vs electron peak energies for individual
   correlated single-shot electron VMIs and ion TOF traces. The red line is a power-law fit.

kinetic energies Ei in the range 0–30 eV following an exponential distribution ∝ exp(−Ei /τ ) (cf
figure 12(d)). At higher ion energies Ei > 25 eV, the efficiency of our detector significantly drops because
energetic ions tend to miss the sensitive area of the detector. Therefore, at Ei  10 eV the reported ion
energies have to be considered as lower bounds. The simulated He+ TOF distributions can be fitted to the
measured peaks, thereby providing an empirical relation between the TOF peak widths σ and τ ≡ Ei .
   The bottom panel of figure 8 shows Ei for He+ vs electron peak energies inferred from the
corresponding electron VMIs. Each blue dot represents one measurement of a correlated electron VMI and
ion TOF trace. The red line is a fit of the power law Emax ∝ Eix resulting in x = 1.65. This model predicts
Ei = 290 eV for Emax = 1 eV and Ei ∼ 104 eV for Emax = 10 eV.

4. Discussion

The evolution of a laser-induced nanoplasma is a complex dynamical phenomenon that involves various
processes of light–matter interactions and collisions on the length scale of atoms and of the cluster as a
whole. These include TI, inverse bremsstrahlung, electron-impact ionization, plasmon-enhanced resonant
absorption, three-body recombination, etc [3, 4]. Accordingly, sophisticated numerical model calculations,
such as MD simulations, are usually required to capture the most important aspects of the nanoplasma
dynamics.
    Nevertheless, we attempted to come up with a simple analytic model to reproduce the most pronounced
correlation visible in the VMIs despite their strong shot-to-shot variation, namely that of the size and the
brightness of the inner spot. This model is based on the expansion of a homogeneous spherical distribution
of charges of radius R (electrons in our case) driven by Coulomb repulsion. According to Islam et al [49],
the initial radial charge density distribution
                                                      dP  3r2
                                                         = 3 Θ(R − r)                                                              (1)
                                                      dr  R

                                                      9
New J. Phys. 23 (2021) 053011 C Medina et al
Figure 9. Peak electron energies as a function of the number of nanoplasma electrons. The data points represent the mean values
of the distributions of electron peak energies for different He and Ne cluster sizes. The solid lines represent the fits based on
equation (3). The inset shows a closeup of the low-energy region where the Ne data points are concentrated.
Figure 10. Dependence of the mean electron peak energy on the extractor voltage for He8000 Xe12 irradiated by NIR pulses. The
red line is a linear fit of the data.
transforms into a final kinetic energy distribution
dP 3 1 1√ E
= E·Θ 1− , (2)
dE 2 ER ER ER
where 1/3
e2 4
ER = πρ N 2/3 (3)
4π0 3
is the cut-off energy. Here, Θ is the Heaviside step function, N is the number of electrons in the sphere and
e is the elementary charge. In this way, we obtain a simple power law dependence ER ∝ N2/3 under the
assumption of a constant initial density ρ = 3N/(4πR3 ). Here, ER can be identified with Emax in the
experimental electron spectra and N is derived from the integrated brightness of the inner spot.
The correlation of Emax and N is represented in figure 9. The data points are obtained by binning Emax
and N values from a total of about 1000 VMIs for every He and Ne cluster size. The error bars indicate the
10New J. Phys. 23 (2021) 053011 C Medina et al
Figure 11. Theoretical time-evolution of a nanoplasma ignited by an intense NIR laser pulse in the presence of an external
homogeneous electric field (F = 1000 V cm−1 ). The laser polarization is horizontal and the electric field points upwards.
dispersion of the data within each bin, resulting from 10–200 VMI measurements per data point. The solid
lines are fits of equation (3) to the data. Surprisingly, despite of the simplicity of our model, the
experimental data for both He and Ne clusters are well reproduced by the fits. Due to the limited range of
sizes of Ne clusters accessible in the experiment, the Ne data were constrained to N 3 × 10³ . The inset
shows an overview of the data and fits at low energies.
The only free fit parameter is the prefactor in equation (3) which yields ρ = 0.05–0.2e μm−3 for He
nanodroplets, where e is the electron charge. The smallest value is obtained for small droplets at low NIR
intensity I ∼ 5 × 10¹⁴ W cm−2 , the largest value is obtained for large droplets and I 1015 W cm−2 . These
values are much smaller than the atom density of He nanodroplets, 0.022 Å−3 . This is expected in view of
our tentative interpretation that the relevant electron density responsible for the lower-energy component is
the one in the more dilute electron beam extracted by the external static electric field of the VMI
spectrometer, see below. In the hotter nanoplasma created by more intense pulses in large droplets, the
electrons appear to be extracted more easily, i.e. at an earlier stage of the nanoplasma expansion when the
electron density is higher. While the insight into the physics of nanoplasmas gained from this model
certainly is rather limited, it is still useful for predicting the energy of nanoplasma electrons merely based on
the detection of their yield.
Up to this point we have discussed our results assuming that the VMI technique applies when detecting
electrons emitted from a nanoplasma. However, we find indications that the evolution of a nanoplasma, in
particular the emission of electrons, is affected by the static electric field present in the VMI spectrometer.
Figure 10 shows the mean electron peak energies as a function of the voltage applied to the extractor
electrode of our spectrometer. The electric field (in V cm−1 ) in the interaction region is given by a factor 0.2
times the extractor voltage (in V). We see a clear trend of increasing detected electron energies for higher
electric fields, roughly following a linear dependence. The extrapolation toward zero electric field indicates a
finite value of the electron energy which is a factor of 0.7 lower than the values presented above, measured
at an extractor voltage of 1.9 kV. Thus, to compare with field-free measurements or simulations, the
reported energies should be scaled accordingly.
To get a better understanding of the impact of a static electric field on the evolution of a nanoplasma
and on the extraction of electrons out of it, we have carried out MD simulations with and without an
external homogeneous electric field. Figure 11 shows snapshots of the simulation at various times after the
maximum of the laser pulse. A NIR laser pulse of 35 fs duration (FWHM) and a maximum intensity of
2 × 10¹⁴ W cm−2 was applied to a He nanodroplet consisting of 2171 He atoms doped with 23 Xe atoms.
The polarization of the laser is horizontal, and the electric field F = 1000 V cm−1 points upwards.
Electrons, neutral He and Xe atoms as well as ions are represented by differently colored beads.
11New J. Phys. 23 (2021) 053011 C Medina et al
Figure 12. Comparison of theoretical and experimental results. (a) Simulated electron velocity distribution for a doped droplet,
He2171 Xe23 , exposed to an NIR pulse in an electric field of F = 1000 V cm−1 . (b) Selected experimental electron VMIs for
He8000 Xe20 ionized by NIR pulses in the presence of an electric field of 25 V cm−1 in the interaction region. (c) Electron kinetic
energy distributions from the simulation (colored lines) and the experiment (black line). (d) Corresponding simulated ion
kinetic energy distributions.
In the early stage t 430 ps (top frames), electrons (white dots) are emitted in two rather distinct
distributions; a diffuse and nearly isotropic cloud is created shortly after the laser pulse (see frame at 61 ps),
and one highly directional component of electrons is extracted downwards along the electric field axis at
t 100 ps. At t > 1 ns (bottom frames), the expanding cloud of ion cores (pink beads) slowly move
upwards along the electric field.
From these simulations we can extract both spatial and velocity coordinates of electrons as they pass
through a plane located 5 mm below the droplet. Since the electric field in the simulation is homogeneous,
the VMI condition is not fulfilled. Nevertheless, we can compare the distribution of velocity components
perpendicular to the electric field with the measured VMIs, see figure 12. The VMI shown in panel (b) is a
typical instance of a class of images where the bright central spot has a diffuse edge (cf figure 2(f)). Such
images make up about 5% of all hits. Indeed, the simulated distribution of transverse velocities, shown in
figure 12(a), resembles the experimental VMI in many respects. It shows two main components: A speckled
background of fast electrons, and a more compact circular cloud in the center. In addition, a small bright
dot in the center indicates a small contribution of electrons with nearly vanishing energy. Note that the
correspondence of simulated and measured distributions holds even in absolute terms, see the velocity
scales on the top of panels (a) and (b). We take this as a confirmation of our interpretation of the central
spot as resulting from the extraction of nanoplasma electrons by the external electric field. Figure 12(c)
shows the distributions of the simulated transverse electron kinetic energies for electric field strengths
F = 0, 0.5, 1, 2, and 10 kV cm−1 as colored lines. Clearly, an increasing electric field gives rise to a growing
shoulder structure extending up to 0.6 eV at F = 10 kV cm−1 (blue dashed line), which is not present
without electric field (red line). Electron energies inferred from this shoulder are depicted in the inset. The
black line depicts the electron spectrum obtained by Abel inversion of the average of 5 images of the same
type as that shown in panel (b), arbitrarily scaled in intensity. It qualitatively resembles the simulated
12New J. Phys. 23 (2021) 053011 C Medina et al
spectra at low electric field. However, the electron energies inferred from the simulated spectra fall
significantly below the average of experimentally determined electron energies (figure 10), despite the
higher electric fields used in the simulation. This deviation is likely related to the approximations made in
the MD simulations, cf section 2.2.
Figure 12(d) shows the ion kinetic energy distributions derived from the simulated ion velocity
components perpendicular to the electric field, for several values of F and for the field-free case. The energy
distribution of the field-free simulation (blue curve) is distinguished by a significantly stronger low-energy
component in the range 0–20 eV. A low-energy component in the ion kinetic energy usually indicates the
presence of an electron-rich nanoplasma core [50, 51]. The partial suppression of the low-energy
component in the ion energy spectra is consistent with the extraction of nanoplasma electrons by the static
electric field.
Clearly, this study should be further extended to fully characterize the electric-field dependence of
electron emission from a nanoplasma in various regimes of laser intensity and droplet size. The fact that the
simulated electron spectra do not reproduce the exact peak structure in most of the experimental spectra at
energies exceeding 1 eV (figures 2 and 3) is likely due to the relatively small size of the He droplet used in
the simulation (He2171 Xe23 ). Larger droplets emit larger amounts of electrons at higher densities which
likely give rise to a more pronounced shoulder in the spectra, eventually evolving into a peak.
Unfortunately, simulations of large He droplets are prohibitively costly for this work. Additionally, the
inhomogeneous electric field of the VMI spectrometer may cause distortions of the velocity distributions
due to the coupling of the extracted electrons’ longitudinal and transverse degrees of freedom with respect
to the electric field.
5. Conclusion
In conclusion, we have presented the first dedicated experimental study of single-shot VMI of electrons
emitted from He and Ne nanoplasmas induced by intense NIR and MIR laser pulses. The images are
characterized by large shot-to-shot fluctuations of the brightness and structure due to the large variation of
cluster sizes and of laser intensities seen by each cluster as it is hit at different positions within the laser
focus. This puts some demands on the data storage capacities, sorting and analysis methods to cope with
the large amount of image data. To clearly map systematic dependencies, typically a minimum of about 100
images have to be recorded per set of parameters. Despite the rather high intensities used to strong-field
ionize the clusters, the electron emission patterns are circularly symmetric to a high degree. Only slight
dents and elongations along the laser polarization were observed for the highest intensities 1015 W cm−2 .
The VMIs of both He and Ne clusters feature a generic two-component structure consisting of a central
bright spot and a diffuse cloud of electrons around it. Likewise, VMIs measured for MIR and NIR laser
pulses are very similar, which supports the concept that electron emission is mostly determined by the
intrinsic dynamics of the nanoplasma. The initial structure of the clusters (superfluid, solid) and the
characteristics of the laser pulses only play minor roles once the threshold for avalanche ionization is
reached. The most sensitive parameter that determines the yield and energy of emitted electrons is the
cluster size.
We have demonstrated the possibility to record electron VMIs and ion TOF traces simultaneously on a
shot-to-shot basis. Bright electron images clearly correlate with large yields of singly and doubly charged He
atomic ions, whereas low nanoplasma electron yields correlate with singly charged He+ and He+ 2 ions.
Electron and ion kinetic energy are found to be related by a simple power law. Despite the large
shot-to-shot variations, a clear correlation of the brightness (number of nanoplasma electrons) and size of
the inner spot (maximum electron energy) is found. It is consistent with a simple power law derived for an
expanding spherical cloud of electrons. A more realistic MD simulation including a static electric field
unravels the mechanism of electron extraction out of the expanding nanoplasma. It shows that the resulting
transverse kinetic energy distributions of electrons significantly differ from the electron spectrum obtained
in the case of field-free expansion in that they feature a shoulder structure around 0.5 eV. Thus, simulated
electron spectra reproduced the experimental spectra well for a certain class of events. The results of the
simulations are supported by VMI measurements at varying spectrometer voltages. The transverse electron
energy inferred from the electron images clearly depends on the spectrometer electric field, consistent with
the result of the simulation.
In general, the VMI technique has the advantage of collecting all electrons emitted into the full
solid-angle, which makes it sensitive enough that entire electron spectra can be measured for individual
clusters and nanodroplets. Moreover, with this technique, electrons and ions can be detected simultaneously
giving more insight into the ionization dynamics. However, the concept of extracting accurate kinetic
energies by inverse Abel transformation of the recorded images breaks down because the spectrometer field
13New J. Phys. 23 (2021) 053011 C Medina et al
interferes with the expansion dynamics of the nanoplasma. To what extent the measured electron
distributions can be reliably related to the field-free electron spectra or to other characteristics of the
nanoplasma (degree of inner ionization, electron temperature, initial cluster shape, etc.) remains to be
further investigated both experimentally and by means of simulations. Likewise, the effect of the
spectrometer field on the nanoplasma dynamics should be elucidated for different regimes of nanoplasma
formation such as XUV and x-ray cluster ionization [16, 17, 52, 53].
Acknowledgementstitle
The authors are grateful for financial support from the Deutsche Forschungsgemeinschaft (DFG) within the
project MU 2347/12-1 and STI 125/22-2 in the frame of the Priority Programme 1840 ‘Quantum Dynamics
in Tailored Intense Fields’, from the Carlsberg Foundation and the SPARC Programme, MHRD, India. The
ELI-ALPS Project (GINOP-2.3.6-15-2015-00001) is supported by the European Union and co-financed by
the European Regional Development Fund. AH is grateful for financial support from the Basque
Government (Project Reference No. IT1254-19) and from the Spanish Ministerio de Economia y
Competividad (Reference No. CTQ2015-67660-P). Computational and manpower support provided by
IZO-SGI SG Iker of UPV/EHU and European funding (EDRF and ESF) is gratefully acknowledged. We
would like to thank the MPIK and ELI-Alps teams for their assistance and support during experiments.
Data availability statement
The data that support the findings of this study are available upon reasonable request from the authors.
ORCID iDs
L Ben Ltaief https://orcid.org/0000-0002-6904-4648
R Flender https://orcid.org/0000-0001-6970-0716
B Major https://orcid.org/0000-0001-5981-340X
S Toth https://orcid.org/0000-0002-2161-316X
F Stienkemeier https://orcid.org/0000-0001-6014-8013
M Mudrich https://orcid.org/0000-0003-4959-5220
References
[1] Shao Y L, Ditmire T, Tisch J W G, Springate E, Marangos J P and Hutchinson M H R 1996 Phys. Rev. Lett. 77 3343
[2] Snyder E M, Buzza S A and Castleman A W Jr 1996 Phys. Rev. Lett. 77 3347
[3] Saalmann U, Siedschlag C and Rost J M 2006 J. Phys. B: At. Mol. Opt. Phys. 39 R39
[4] Fennel T, Meiwes-Broer K-H, Tiggesbäumker J, Reinhard P-G, Dinh P M and Suraud E 2010 Rev. Mod. Phys. 82 1793
[5] Masim F C P, Porta M, Hsu W-H, Nguyen M T, Yonezawa T, Balčytis A, Juodkazis S and Hatanaka K 2016 ACS Photonics 3 2184
[6] Rajeev R, Madhu Trivikram T, Rishad K P M, Narayanan V, Krishnakumar E and Krishnamurthy M 2013 Nat. Phys. 9 185
[7] Kundu M, Popruzhenko S V and Bauer D 2007 Phys. Rev. A 76 033201
[8] Vampa G, Hammond T J, Thiré N, Schmidt B E, Légaré F, McDonald C R, Brabec T and Corkum P B 2015 Nature 522 462
[9] Heidenreich A, Last I and Jortner J 2007 J. Chem. Phys. 127 074305
[10] Heidenreich A, Grüner B, Schomas D, Stienkemeier F, Krishnan S R and Mudrich M 2017 J. Mod. Opt. 64 1061
[11] Rose-Petruck C, Schafer K J, Wilson K R and Barty C P J 1997 Phys. Rev. A 55 1182
[12] Last I and Jortner J 2004 J. Chem. Phys. 120 1348
[13] Zweiback J, Ditmire T and Perry M D 1999 Phys. Rev. A 59 R3166
[14] Krishnan S R et al 2012 New J. Phys. 14 075016
[15] Pohl A, Reinhard P-G and Suraud E 2004 J. Phys. B: At. Mol. Opt. Phys. 37 3301
[16] Ovcharenko Y et al 2014 Phys. Rev. Lett. 112 073401
[17] Schütte B, Arbeiter M, Fennel T, Vrakking M J and Rouzée A 2014 Phys. Rev. Lett. 112 073003
[18] Schütte B, Arbeiter M, Fennel T, Jabbari G, Kuleff A I, Vrakking M J J and Rouzée A 2015 J. Phys.: Conf. Ser. 635 012025
[19] Kelbg M, Zabel M, Krebs B, Kazak L, Meiwes-Broer K-H and Tiggesbäumker J 2019 J. Chem. Phys. 150 204302
[20] Oelze T et al 2017 Sci. Rep. 7 40736
[21] Kelbg M, Zabel M, Krebs B, Kazak L, Meiwes-Broer K-H and Tiggesbäumker J 2020 Phys. Rev. Lett. 125 093202
[22] Mudrich M and Stienkemeier F 2014 Int. Rev. Phys. Chem. 33 301
[23] Mikaberidze A, Saalmann U and Rost J M 2009 Phys. Rev. Lett. 102 128102
[24] Krishnan S R et al 2011 Phys. Rev. Lett. 107 173402
[25] Heidenreich A, Schomas D and Mudrich M 2017 J. Phys. B: At. Mol. Opt. Phys. 50 244001
[26] Heidenreich A, Grüner B, Rometsch M, Krishnan S R, Stienkemeier F and Mudrich M 2016 New J. Phys. 18 073046
[27] Toennies J P and Vilesov A F 2004 Angew. Chem., Int. Ed. 43 2622
[28] Gomez L F, Loginov E, Sliter R and Vilesov A F 2011 J. Chem. Phys. 135 154201
14New J. Phys. 23 (2021) 053011 C Medina et al
[29] Buck U and Krohne R 1996 J. Chem. Phys. 105 5408
[30] Ltaief L B et al 2018 J. Phys. B: At. Mol. Opt. Phys. 51 065002
[31] Döppner T, Fennel T, Radcliffe P, Tiggesbäumker J and Meiwes-Broer K-H 2006 Phys. Rev. A 73 031202
[32] Kelbg M, Heidenreich A, Kazak L, Zabel M, Krebs B, Meiwes-Broer K-H and Tiggesbäumker J 2018 J. Phys. Chem. A 122 8107
[33] Schomas D, Rendler N, Krull J, Richter R and Mudrich M 2017 J. Chem. Phys. 147 013942
[34] Hagena O F 1992 Rev. Sci. Instrum. 63 2374
[35] Kuma S, Goto H, Slipchenko M N, Vilesov A F, Khramov A and Momose T 2007 J. Chem. Phys. 127 214301
[36] Augst S, Meyerhofer D D, Strickland D and Chint S L 1991 J. Opt. Soc. Am. B 8 858
[37] Thiré N et al 2018 Opt. Express 26 26907
[38] Daly N R 1960 Rev. Sci. Instrum. 31 264
[39] Heidenreich A, Last I and Jortner J 2007 Isr. J. Chem. 47 89
[40] Ammosov M V, Delone N B and Krainov V P 1987 Sov. Phys. JETP 64 1191
[41] Lotz W 1967 Z. Phys. 206 205
[42] Fennel T, Ramunno L and Brabec T 2007 Phys. Rev. Lett. 99 233401
[43] Buchenau H, Toennies J P and Northby J A 1991 J. Chem. Phys. 95 8134
[44] Chen C H, Siska P E and Lee Y T 1973 J. Chem. Phys. 59 601
[45] Ovcharenko Y et al 2020 New J. Phys. 22 083043
[46] Garcia G A, Nahon L and Powis I 2004 Rev. Sci. Instrum. 75 4989
[47] Gomez L F et al 2014 Science 345 906
[48] Langbehn B et al 2018 Phys. Rev. Lett. 121 255301
[49] Islam M R, Saalmann U and Rost J M 2006 Phys. Rev. A 73 041201
[50] Last I and Jortner J 2006 Phys. Rev. A 73 013202
[51] Heidenreich A, Infante I and Ugalde J M 2012 New J. Phys. 14 075017
[52] Schütte B, Oelze T, Krikunova M, Arbeiter M, Fennel T, Vrakking M J J and Rouzée A 2015 New J. Phys. 17 033043
[53] Kumagai Y et al 2021 J. Phys. B: At. Mol. Opt. Phys. 54 044001
15You can also read