SIPM CROSS-TALK IN LIQUID ARGON DETECTORS - ARXIV
←
→
Page content transcription
If your browser does not render page correctly, please read the page content below
Eur. Phys. J. C manuscript No.
                                                  (will be inserted by the editor)

                                                  SiPM cross-talk in liquid argon detectors
                                                  M. G. Boulay1,2 , V. Camillo1 , N. Canci1 , S. Choudhary3 , L. Consiglio1 ,
                                                  A. Flammini4 , C. Galbiati5,6 , C. Ghiano1 , A. Gola7,8 , S. Horikawa5 ,
                                                  P. Kachru5 , I. Kochanek1 , K. Kondo1 , G. Korga9,1 , M. Kuźniak3 ,
                                                  A. Mazzi7,8 , A. Moharana5 , G. Nieradka3 , G. Paternoster7,8 , A. Razeto1 ,
                                                  D. Sablone1 , T.N. Thorpe5,10 , C. Türkoğlu3 , H. Wang10 , M. Rescigno11 ,
                                                  S. Sanfilippo12
arXiv:2201.01632v1 [physics.ins-det] 5 Jan 2022

                                                  1
                                                     INFN Laboratori Nazionali del Gran Sasso, Assergi (AQ) 67100, Italya
                                                  2
                                                    Department of Physics, Carleton University, Ottawa, ON K1S 5B6, Canada
                                                  3
                                                    AstroCeNT, Nicolaus Copernicus Astronomical Center of the Polish Academy of Sciences, 00-614 Warsaw, Poland
                                                  4
                                                    INFN Bologna, Bologna 40126, Italy
                                                  5
                                                    Gran Sasso Science Institute, L’Aquila 67100, Italy
                                                  6
                                                    Physics Department, Princeton University, Princeton, NJ 08544, USA
                                                  7
                                                    Fondazione Bruno Kessler, Povo 38123, Italy
                                                  8
                                                    Trento Institute for Fundamental Physics and Applications, Povo 38123, Italy
                                                  9
                                                    Department of Physics, Royal Holloway University of London, Egham TW20 0EX, UK
                                                  10
                                                     Physics and Astronomy Department, University of California, Los Angeles, CA 90095, USA
                                                  11
                                                     INFN Sezione di Roma, Roma 00185, Italy
                                                  12
                                                     INFN Roma Tre, Roma 00146, Italy
                                                  the date of receipt and acceptance should be inserted later

                                                  Abstract SiPM-based readout is becoming the stan-              by SiPMs during the avalanche process [2]. If such a
                                                  dard for light detection in particle detectors given their     photon remains confined in the source SiPM and gener-
                                                  superior resolution and simplicity of use respect to vac-      ates another avalanche in a neighbouring cell, we speak
                                                  uum tube photo-multipliers. However, the presence of           of internal cross-talk (iCT). Alternatively, the gener-
                                                  detection noises such as the dark rate, the cross-talk         ated photon can escape the silicon bulk and reach other
                                                  and after-pulsing may impact significantly the perfor-         SiPM arrays in the setup. In this case we speak of exter-
                                                  mance. In this work, we document the development of            nal cross-talk (eCT). Finally, if the photon is reflected
                                                  highly reflective single-phase argon chambers capable          back and absorbed by the same SiPM array that emit-
                                                  of displaying light yields up to 32 photo-electrons per        ted it, we speak of feedback cross-talk (fCT). In general,
                                                  keV, out of which only about 12 are primary photo-             we define optical cross-talk (oCT) as the envelope which
                                                  electrons generated by the argon scintillation and the         includes the three effects just described. As will be de-
                                                  rest is accounted for by optical cross-talk. Furthermore,      scribed later, optical cross-talk generates a compound
                                                  the presence of compound processes yields a generalized        process that leads to the amplification of the initial sig-
                                                  Fano factor that reaches a value of 9 at higher over-          nal with a gain that is defined by G = 1/1−PoCT (where
                                                  voltages. As a bonus, we have the complete parame-             PoCT is the overall probability of optical cross-talk).
                                                  trization of the optical cross-talk for the FBK NUV-           Unfortunately, such processes are subject to fluctua-
                                                  HD-Cryo SiPMs at 87 K.                                         tions that affect the resolution of the measurement: in
                                                                                                                 Section 3.5 we will quantify a generalized Fano factor
                                                  Keywords Liquid Argon Detector · Light Yield ·                 that is significantly bigger than unity
                                                  Light Yield · SiPM · eCT
                                                                                                                     Most particle detectors are designed to collect very
                                                                                                                 faint light signals in highly reflective chambers that host
                                                  1 Introduction                                                 several thousand of photo-detectors, such as Borexino
                                                                                                                 and Super-Kamiokande [3, 4]. In these conditions, the
                                                  In 1955 it was observed that a silicon junction emits          oCT between the photo-detectors can have large con-
                                                  light when a bias is applied [1] across it. More recently, a   tributions to the physics output of the experiment. Ar-
                                                  number of works have documented the emission of light          gon is of particular interest for use as an active de-
                                                                                                                 tector medium because of its high scintillation yield;
                                                  a
                                                      Corresponding address: sarlabb7@lngs.infn.it               large particle detectors can be built with liquid argon
2
4 20
3 15
Gain [Me]
Gain [mV]
2 10
1 5
29 30 31 32 33 34 35 36 37 38
Bias [V]
Fig. 2 Gain in e− (black) and in peak amplitude (red) for
the SiPMs in use as a function of the applied bias. The lines
correspond to a linear regression that describe the experimen-
tal data at better than 1 % and 4 %, for charge and amplitude
respectively.
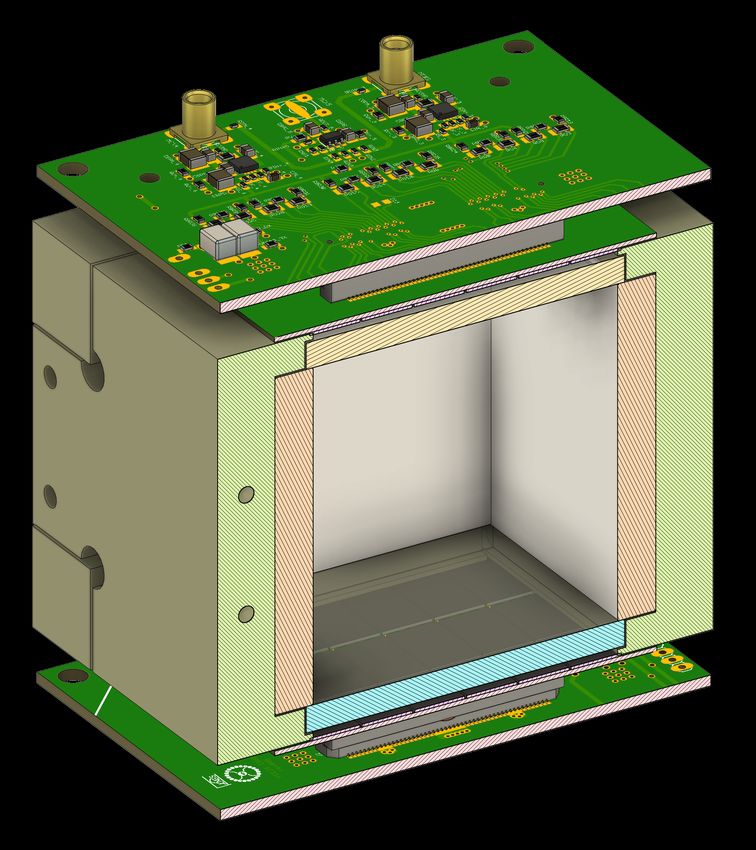
2.1 Cubic Chamber
Figure 1 reports the drawing of the cubical LAr cham-
ber in use. The chamber is made up of four identical
Fig. 1 Drawing of the cubical chamber with inner size
50 × 50 × 50.8 mm3 (l x w x h). High efficiency reflectors are walls machined from PEEK that can host different re-
installed on the walls. Two 24 cm2 SiPM tiles, with their read- flectors. The results that we report here refers to an en-
out boards, are facing UV-graded fused silica windows which hanced specular reflector (Vikuiti ESR) from 3M, since
are installed on the top and the bottom. All the inner surfaces it is more common in argon detectors. The top and bot-
are evaporated with TPB.
tom windows are 1λ fused silica 50 × 50 × 4 mm3 (from
Edmund Optics) providing a transmissivity in excess
of 95 % above 300 nm. All internal surfaces are coated
(LAr) [5–8]. In this work we have developed two high with TPB for wavelength shifting of the scintillation
efficiency LAr chambers that were operated at 87 K photons (128 nm) to the visible range.
to study the scintillation light produced by interaction
The visible photons are detected by two tiles of
with calibration sources, followed by the deconvolution
SiPMs installed on the top and bottom of the detector
of contributions from oCT components.
chamber. Each tile is made up of 24 SiPMs bonded on
a FR4 PCB with a cryo-graded epoxy [11]. The SiPMs
from the FBK NUV-HD-Cryo family have a large sur-
face area of 7.9 × 11.7 mm2 , with a cell size of 30 µm
and a quenching resistor of 5 MΩ at 87 K [12]. The fill-
2 Setup factor of the tile is 90 %, where most of the dead space
is left for the landing pad of the wire bonding.
The detectors were installed in a sealed dewar inside
a container filled with about 4 L of high purity argon,
within the STAR facility [9]. The system provides argon 2.2 Cylindrical Chamber
constantly purified by a getter (SAES PS4-MT3) in a
re-circulation loop with a flow of 5 sl/min. Additionally, a cylindrical chamber with inner dimen-
It is possible to inject in the re-circulation loop the sions 46 × 50 mm2 ( x h) was instrumented with the
metastable isotope of 83m Kr with an activity of few tens same photo-detectors of the cubic chamber. The cylin-
of becquerels: this source is used in several dark matter der is realized in acrylic, and internally lined with TPB-
detectors [10] since it is not filtered by the getter, has coated 3M reflector foil. In front of the SiPMs two
a half life of 1.83 hours, and provides a calibration line custom 1 mm TPB-coated fused silica windows are in-
at 41.5 keV. Additionally, an 241 Am source can be at- stalled.
tached to the external walls of the dewar: a total rate The cylindrical chamber is useful for verifying the
of several counts per second of 59.5 keV gammas reach consistency of the results and of the models developed
the active volume of the detector. for the cubic chamber.3
Run 0.6
30 Cubic − 241Am
PiCT [%]
Cubic − 83mKr 0.4
Cylindrical − 83mKr
Gross LY [pe/keV]
25
0.2
20 0.0 Model:
Gen. Fano Factor
Branching Poisson
4
Exp. Data
15
Geometric Chain
3
10
2
5
1
1 2 3 4 5 6 7 8 9 10 1 2 3 4 5 6 7 8 9 10 11
Overvoltage [V] Overvoltage [V]
Fig. 3 Gross photo-electron yield (without correcting for Fig. 4 iCT analysis for the SiPM in use: details in the text.
correlated noise) at different SiPM over-voltages for: cubi-
cal chamber using 83m Kr (green triangle) and 241 Am (red
circle) sources, and cylindrical chamber using 83m Kr source
(blue square). is emitted [14]. Delays introduced by the absorption
and re-emission of photons in the WLS and their op-
tical path length inside the detector have no effect in
2.3 Data Acquisition this time scale. The waveform normalization includes
removal of the baseline, calculated in the pre-trigger
Each tile is connected to a readout board where the sig- region, and scaling by the gain of the photo-detectors.
nals from the SiPMs are amplified by four cryo-grade The mean number of photo-electrons observed by both
low-noise trans-impedance amplifiers as discussed in [13]. photo-detectors is extracted by fitting the calibration
In this configuration, we achieve at 5 VoV a signal to peak with a Gaussian model [9].
noise ratio (SNR) larger than 7 for the unfiltered signal The gross light yield, referred to as LYOV here-
G
and a SNR larger than 30 for the charge in 1 µs. after, is given by the ratio between the number of de-
The waveforms are acquired by a V1720 Caen unit: tected photo-electrons and the energy deposited in the
each quadrant of a tile is fed into a channel of the dig- medium by the source in use. The gross energy resolu-
itizer. A copy of the signal from the SiPMs is sent to a tion (σGOV
/E) is determined by the standard deviation
set of NIM discriminators that form a trigger logic. The of the fitted Gaussian divided by its mean value.
trigger can be configured to act on a single tile or on
G for both chambers
In Figure 3 we report the LYOV
both, depending on the run conditions. The threshold
at different SiPM over-voltages. Very similar light yield
is set significantly below the region of interest.
values were obtained with both the cubical and the
Data were acquired individually for both 241 Am and
cylindrical chambers across the entire range of tested
83m
Kr, with the photo-detectors operated at the de-
over-voltages. The LYOVG within both chambers is con-
sired over-voltage values. Background data were also
sistent for both 241
Am and 83m Kr sources.
acquired at the same over-voltages to subtract the envi-
ronmental background and extract the calibration peak.
A laser pulse is delivered in the chambers to mon-
itor the behaviour of the photo-detectors: in Figure 2
we report the gain and the peak amplitude for one of 3.1 iCT and AP
the SiPMs in use. Both quantities are described at bet-
ter than a few percent by linear models, which predict In Figure 4 we report the iCT probability and the gen-
the break-down voltages as Vbd C
= (26.8 ± 0.1) V and eralized Fano factor for the SiPMs in use at 77 K. The
Vbd =(27.5 ± 0.1) V (respectively for charge and ampli-
A measurement was performed with single SiPMs of the
tude). For the rest of the document the over-voltage is same lot exposed to laser pulses in a stable, low noise
referred to by VbdA
. environment. In the analysis it was possible to identify
up to twenty photo-electron peaks with very high res-
olution. From the charge spectra (a.k.a. "finger plots")
3 Analysis we extracted the probability of each peak PnOV . As-
suming that the laser photons are detected with pois-
The data analysis involves integrating the normalized sonian distribution with mean (kept much smaller
waveforms on a gate of 7 µs following the NIM trig- than unity) and assuming that iCT photons are emit-
ger to obtain the photo-electron (PE) spectrum. On ted independently in a recursive process converging at
such a time scale, 99.5 % of the Ar scintillation light /1−PiCT , we can measure the following quantities:4
1.20
Detector:
Relative LYG of the Top Tile
Cubic
Cilyndrical
1.15 200
Counts [arb.]
1.10 150
1.05 100
1.00 50
0 1 2 3 4 5 6 7 8 9 10
0
Overvoltage [V]
−0.4 −0.2 0 0.2 0.4
Fig. 5 External cross-talk scan: in this plot we report the TBA
relative amount of light seen by the top photo-detector (at Fig. 6 Top-Bottom Asymmetry (TBA) for the 83m Kr source
8.5 VoV) for different over-voltages of the bottom photo- in the cubic detector: real-data at 8.5 VoV (green) with an
detector. The lines correspond to the tMC fit described in asymmetry below 1.5 % and simulation (blue).
Section 3.3. The small confidence intervals around the lines
comes from the statistical fluctuation of about 109 photons
in the simulation and not from the uncertainty of the fit pa- Vh =(5.4 ± 0.3) V, ξiCT =(53 ± 1)/kV, χ2 /d.o.f. = 9/8,
rameters.
α=−1.68 ± 0.01, δ=1.031 ± 0.008, χ2 /d.o.f. = 13/8.
In Figure 4 we have added the predictions of the
Vinogradov branching poisson (bp) and geometric chain
gc
ln(P0OV ) (gc) models. In the top panel we report the PiCT and
OV
PiCT =1+ bp
PiCT resulting from the fit of Pn with the correspond-
OV
hni
(1) ing Vinogradov PDF [15,16]. The generalized Fano fac-
Var [n]
OV
FiCT = tor (bottom panel of Figure 4) is calculated for the geo-
hni gc
metric chain (branching poisson) as FiCT = 1+PiCT/1−PiCT
bp
which represent the iCT probability and the general- (FiCT = /(1−PiCT ) ), as described by Vinogradov. Both
1 2
ized Fano factor for the experimental data as shown in models depart from data by more than 10 % at the high-
Figure 4. est over-voltages. A better approximation of our data
The measurement results were fitted with the fol- is provided by the sum of two independent geometric
lowing models: chains with probabilities 85%·PiCT and 15%·PiCT . The
accuracy of this model is better than 0.2 % for the re-
C
PiCT (V ) = ξiCT ·(V − Vbd )·PTh (V − Vbd
A
) (2) sulting mean number of iCT photo-electrons as well as
FiCT (V ) = δ·(1 − PiCT (V )) α
(3) for their generalized Fano factor. The two independent
chains probably describe different processes within the
where the two break-down voltages are fixed by the SiPMs: horizontal photons crossing the (partly) opaque
laser analysis as described in Section 2.3. The triggering trenches or photons reflected in the bulk and entering
probabilities for hole and electron initiated avalanches neighbouring cells.
are defined as: The after-pulse (AP) was studied in [9] and for the
OV over-voltage in use it doesn’t exceed 10 %. Therefore,
PTh (OV) = 1 − e −Vh to a first approximation, it can be neglected. The same
(4)
PTe (OV) = 1 − e −Ve
OV
applies to the primary dark rate (DCR), that does not
exceed 20 cps per photo-sensor in cryogenic conditions.
where Vh and Ve depend on temperature.
Equation 2 describes the iCT in terms of emission
and trigger probabilities. The model assumes that most 3.2 External cross-talk
of the iCT photons are in the red - infrared region,
see [2], because of which the avalanches are initiated by The eCT and fCT components can be estimated by
holes in the SiPMs in use. Therefore, only the hole trig- acquiring data at different over-voltages for one photo-
gering probability is used. The emission probability is detector (source), while keeping the other unit (target)
considered proportional to the total number of carriers at a constant bias.
extracted in the avalanche process: in Figure 2 we have In Figure 5 we report the gross light yield seen by
proved that V − Vbd C
describes the gain at better than the target photo-detector as a function of the over-
1 %. The fits converge at: voltage of the source photo-detector. Given the asym-5
Cubic Cylindric Units
Bias Asymmetric Symmetric Asymmetric Symmetric
Algorithm tMC Analytical Global tMC Analytical
pe
n̄ 13.0 ± 0.5 12.1 ± 0.3 13.0 ± 0.9 12.9 ± 0.9 13.0 ± 0.7 12 ± 2 pe/keV
ζ 0.34 ± 0.05 0.34 ± 0.10 0.34 ± 0.08 0.37 ± 0.08 0.34 ± 0.07 0.45 ± 0.34 -
Vh 5.4 5.4 5.4 ± 0.3 5.6 ± 0.3 5.4 5.3 ± 0.3 V
Ve 1.0 ± 0.1 1.0 ± 0.1 0.9 ± 0.2 1.0 ± 0.2 1 1.1 ± 0.6 V
ξiCT 53 53 53 53 53 53 kV−1
ξfCT 15 ± 1 15 15 15 17 ± 1 17 kV−1
ξeCT 7±1 7±1 8±2 10.2 ± 1.5 5±1 8±5 kV−1
α −1.71 ± 0.07 -
δ∗ 1.16 ± 0.01 -
χ2 /n.d.f. 4/5 3/6 1/5 13 / 13 11 / 6 2/5 -
Table 1 Results of the fit to the data for both the cubic and the cylindrical chambers. Asymmetric biasing refers to the
eCT scan where one photo-detector is kept at constant bias and the other is scanned in the range from 0 VoV to 10 VoV, see
Section 3.2. The symmetric biasing corresponds to the normal operation in which both photo-detectors are biased at the same
value. Both the tMC, the analytical model and the global fits are reported for the cubic chamber. The parameters without
errors are fixed while Vh (when not fixed) has a penalty in the χ2 at (5.4 ± 0.3) V (see text).
metric setup, the calibration peak can no longer be Under this hypothesis the following quantities can
modeled as a Gaussian. The LY of the target detec- be defined:
tor is estimated as the mean of the distribution with
the 83m Kr source after background subtraction. PPDE (V ) = ζ·PTe (V − Vbd
A
) + (1 − ζ)·PTh (V − Vbd
A
) (5)
Photons from eCT are peaked in the red and near C
PxCT (VS , VT ) = ξx ·(VS − Vbd )·PTh (VT − Vbd
A
) (6)
infrared band, see [2], where the reflectivity of the 3M
foil is reduced [17]. In the cubic chamber the reflectors
Equation 5 defines the probability of detecting a real
are held by stainless steel supports: the steel surfaces
photo-electron as function of the ζ probability of ma-
reflect the eCT photons back into the chamber. This ex-
terializing an electron or a hole with their relative trig-
plains the lower eCT for the cylindrical chamber (made
gering probabilities, Equation 4. Vh is fixed to the value
up of acrylic) where longer wavelengths are partially
found in Section 3.1. Equation 6 generalizes Equation 2,
lost.
modeling the probability of emission and detection of
Most of the feedback cross-talk happens at the bound-
cross-talk photo-electrons as function of the bias of both
aries of the fused silica windows in front of the SiPMs:
detectors (source and target). For iCT and fCT, VS and
the windows are deposited with TPB that acts as a dif-
VT coincide. The acceptance parameters are ξfCT , ξeCT
fusive layer, thus reflecting back a significant fraction
and ξiCT , the last of which is fixed to the value in Equa-
of cross-talk photons.
tion 2.
The χ2 minimization of the five free parameters
against the data of the over-voltage scan for the cu-
3.3 Toy MC
bic chamber leads to an average accuracy better than
To quantify the different oCT components as a func- 1.5 photo-electrons over about 500 photo-electrons. The
tion of the over-voltage, a toy Monte Carlo (tMC) was resulting parameters for both the cubic and the cylin-
developed. The tMC models the detection of real pho- drical chambers are reported in Table 1. The prediction
tons and all the intertwined cross-talk photo-electrons of tMC are shown in Figure 5.
with a poissonian recursive process, similar to the ge-
ometric compound process from Vinogradov [16]. Pho-
ton tracking is not part of the tMC: only overall ac- 3.4 Analytical model
ceptances (ξx ) for each sub-process (primary photo-
electrons, iCT, fCT and eCT) are used. The availability of the toy Monte Carlo is precious to
The tMC assumes a symmetric detector: this can test the analytical models described in this section, in
be verified in Figure 6 where the top-bottom asymme- a controlled procedure. A tested analytical model helps
try (TBA) is shown for the cubic detector. The TBA to understand the behaviour of the system much better
is defined, on event basis, as the difference in photo- than a Monte Carlo.
electrons seen by the top and bottom tiles normalized Equation 7 represents the mean number of photo-
by the total number of collected photo-electrons. electrons in presence of iCT and fCT for an event of6
35 Contribution 8 10
eCT
Generalized Fano Factor
9
30 fCT 7
iCT 8
Resolution [%]
25 PDE 6
LY [pe/keV]
7
20 5
6
4 Data 5
15
Fano Factor
Fit 4
10 3
Poissonian 3
5 2
2
1
0 1
1 2 3 4 5 6 7 8 9 10 1 2 3 4 5 6 7 8 9 10
Overvoltage [V] Overvoltage [V]
Fig. 7 Breakdown of the CT components from the analytical Fig. 8 Resolution of the cubic chamber for the 83m Kr source
model for the measured LYG for the cubical chamber with (data points in black): the blue line reports the prediction
83m
Kr, as a function of the over-voltage. from the resolution fit (see text). The green line displays
the pure poissonian resolution and the red shows the cal-
culated generalized Fano factor (relative to the axis scale on
energy E. the right).
N pe (V ) = n̄pe ·E·PPDE (V )·µ(V ) (7)
3.5 Resolution
where µ(V ) = contains the amplifi-
1/1−PiCT (V )−PfCT (V )
cation factor from the cross-talk on the same device A second quantity of primary importance for particle
(iCT and fCT) and the parameter n̄γ indicates the detectors is the energy resolution that, due to iCT, de-
asymptotic net light yield. parts from the poissonian limit with the introduction of
In presence of two photo-detectors Equation 7 can a generalized Fano factor larger than unity, Section 3.1.
be generalized to include the external cross-talk as: The presence of fCT and eCT increase this departure.
In analogy with Equation 3, we can define a global
generalized Fano factor from cross-talks as
N1pe (V1 , V2 ) = µ1 (V1 )·(n̄pe
1 ·E·PPDE1 (V1 )+
+ N2pe (V1 , V2 )·PeCT21 (V2 , V1 )) FoCT = δ ∗ ·(1 − PoCT )α (11)
(8)
N2pe (V1 , V2 ) = µ2 (V2 )·(n̄pe
2 ·E·PPDE2 (V1 )+ where α is the same as defined for the iCT only, in
+ N1pe (V1 , V2 )·PeCT12 (V1 , V2 )) Section 3.1. This leads to equation 12 that can be tested
on experimental data.
Assuming a symmetric chamber with the same bias s
for both photo-detectors, Equation 8 simplifies as if σG (E, V ) FoCT (V )
= (12)
there were only a single photo-detector with PoCT = E E·LYOVG
PiCT + PfCT + PeCT :
For the cubic chamber with 83m Kr we get a χ2 /n.d.f. =
PDE (V )
n̄pe/2·E·P 12/7 fixing Vh = 5.4 with a resulting ξoCT (the sum of
N1pe (V ) = = N2pe (V ) (9)
1 − PoCT (V ) the three CT acceptances) equal to (78.0 ± 0.3)/kV and
n̄pe ·PPDE (V ) δ ∗ =1.157 ± 0.006. Due to very low gain at 1 VoV, the
LYG (V ) = (10) resolution is dominated by electronic noise, and there-
1 − PiCT (V ) − PfCT (V ) − PeCT (V )
fore has been excluded from the fit. Figure 8 reports
Equation 10 can be fitted against the experimental the experimental points and the fit prediction.
data. It depends on seven parameters: n̄pe , ζ, Vh , Ve ,
ξiCT , ξfCT and ξeCT . Vh is bounded to the results ob-
tained in Section 3.1 with a penalty in the chi-squared. 3.6 Global fit
The fit to the symmetric setup is sensitive only to PoCT
and not to its component: therefore ξiCT and ξfCT are It is possible to combine the LYG and the resolution
fixed to the values found in Section 3.1 and 3.3. The re- fits in a global χ2 with the goal of reducing the uncer-
sults of the minimization are shown in Table 1. Figure 7 tainty on the results. In this case Equation 13 uses the
reports the fit to the gross light yield with the visual LYG (V ) predicted by the analytical model instead of
indication of the different cross-talk contributions. It the experimental data:
is interesting to note that above 7.7 VoV the contribu- s
σG (E, V ) FoCT (V )
tion from the optical cross-talk exceeds the number of = (13)
primary photo-electrons. E E·LYG (V )7
Component Fraction (%) jected to LAr medium [9]. These affect the aforemen-
SiPM (collection efficiency) 70 tioned light collection efficiency and hence we estimate
Dead spaces in the SiPM tile 6 a systematic error of ±5 % on the absolute value.
Reflectors & TPB 11 With the collection efficiency it is possible to predict
Detector mechanics (escape) 13
the LY of the system. Assuming that the PDE of the
Table 2 Fraction of simulated photons absorbed by differ- SiPM does not change more than 10 % with respect to
ent detector components. Absorption by SiPMs represents the measurements at room temperature [8] and assum-
the light collection efficiency of the system. Absorption by
detector mechanics implies the light escaping from the opti- ing a 100 % for the TPB VUV conversion efficiency [19],
cal system of the detector. the optics model predicts a net light yield of 11.7 ± 1.3
photo-electrons/keV at 6 VoV in agreement with the
value reported in Figure 7.
The results of the χ2 minimization are reported in Ta-
ble 1.
5 Conclusions
In this work we studied the light yield of two small
4 Optics LAr chambers equipped with large SiPM arrays and
we found that up to 12 ± 1 photo-electrons/keV net can
A dedicated Monte Carlo simulation software has been be obtained. This is one the best light yield obtained
developed based on Geant4 [18] with the main focus for a LAr setup: since all SiPMs from any vendor are
on tracking the photons in the detectors under study: affected by external cross-talk, previous results using
the simulation includes wavelength shifting, reflection, silicon readout should be re-evaluated with a similar
refraction and absorption. It also incorporates the LAr analysis. Furthermore, despite the high net light yield,
scintillation process originating from particle interac- the optical cross-talk of the SiPMs becomes dominant
tions in LAr. The inner surface of the active LAr volume above 7.7 VoV, significantly deteriorating the energy
is almost entirely covered with TPB and the wavelength- resolution of detectors.
shifting efficiency of TPB is set to unity in the model. On the bright side, the over-voltage dependence of
A full model of the system is implemented along the oCT is described with high accuracy providing the
with the surrounding LAr buffer and the detector ge- models of the avalanche triggering probabilities at cryo-
ometry. Optical properties, such as refractive index, at- genic temperature. Thanks to the optical model of the
tenuation length and surface properties, of all the opti- chamber, we can re-scale the acceptances of the external
cal components, including LAr, TPB, ESR foil, fused- and feedback cross-talk: ξfCT+eCT = 0.59 ± 0.07 ξiCT .
silica window and SiPM, are described with adequate
approximations. While some of the parameters were
taken from literature, some were measured in dedicated Acknowledgements
setups, in particular measurements of the wavelength-
dependent reflectivity of the TPB-coated ESR foil (ap- We acknowledge support from the Istituto Nazionale
prox. 96%) and of the SiPM surface (approx. 17%), di Fisica Nucleare (Italy) and Laboratori Nazionali del
which are reported elsewhere [9]. Gran Sasso (Italy) of INFN, from NSF (US, Grant
To estimate the light collection efficiency of the de- PHY-1314507 for Princeton University), from the Royal
tector under test, 41.5 keV electrons were generated Society UK and the Science and Technology Facilities
uniformly over the active volume, simulating the energy Council (STFC), part of the United Kingdom Research
deposition from the 83m Kr isotopes. Table 2 summarises and Innovation, from the European Union’s Horizon
the fraction of visible photons absorbed by different 2020 research and innovation programme under grant
parts of the detector: the light collection is affected only agreement No 962480 (DarkWave project), and from
by the fraction of light absorbed by the SiPM tiles. In the International Research Agenda Programme Astro-
Figure 6 we compare the simulated top-down asymme- CeNT (MAB/2018/7) funded by the Foundation for
try with the measured one. Polish Science (FNP) from the European Regional De-
There are several issues on the modeling of the op- velopment Fund.
tics, among which the most important ones are: (1) the
nature of the optical interface between the fused-silica
References
window and TPB is not well understood and (2) the
reflectivity of the SiPM, which has a multi-layer anti- 1. R. Newman, Phys. Rev. 100, 700 (1955). DOI 10.1103/
reflective coating, has been measured in air and pro- PhysRev.100.7008
2. R. Mirzoyan, R. Kosyra H.G. Moser, Nucl. Instrum.
Methods Phys. Res. A 610(1), 98 (2009). DOI 10.1016/
j.nima.2009.05.081
3. M. Agostini et al., Nature 562(7728), 505 (2018). DOI
10.1038/s41586-018-0624-y
4. E. Richard et al., Phys. Rev. D 94(5), 052001 (2016).
DOI 10.1103/PhysRevD.94.052001
5. S. Amerio et al., Nucl. Instrum. Meth. A 527, 329 (2004).
DOI 10.1016/j.nima.2004.02.044
6. B. Abi et al., Eur. Phys. J. C 81(4), 322 (2021). DOI
10.1140/epjc/s10052-021-09007-w
7. R. Ajaj, P.A. Amaudruz, G.R. Araujo et al., Phys. Rev. D
100, 022004 (2019). DOI 10.1103/PhysRevD.100.022004
8. C.E. Aalseth et al., Eur. Phys. J. Plus 133(3) (2018).
DOI 10.1140/epjp/i2018-11973-4
9. Boulay, M. G., Camillo, V., Canci, N. et al., Eur.
Phys. J. C 81(12), 1099 (2021). DOI 10.1140/epjc/
s10052-021-09870-7
10. P. Agnes, T. Alexander, A. Alton et al., Physics Letters
B 743, 456 (2015). DOI 10.1016/j.physletb.2015.03.012
11. I. Kochanek, Nucl. Instrum. Methods Phys. Res. A 980,
164487 (2020). DOI 10.1016/j.nima.2020.164487
12. A. Gola, F. Acerbi, M. Capasso et al., Sensors 19(2)
(2019). DOI 10.3390/s19020308
13. M. D’Incecco, C. Galbiati, G.K. Giovanetti et al., IEEE
Trans. Nucl. Sci. 65(1), 591 (2018). DOI 10.1109/TNS.
2017.2774779
14. P. Adhikari, R. Ajaj, G. Araujo et al., Eur. Phys. J. C
80(4), 303 (2020). DOI 10.1140/epjc/s10052-020-7789-x
15. S. Vinogradov, Nucl. Instrum. Methods Phys. Res. A
695, 247 (2012). DOI 10.1016/j.nima.2011.11.086
16. S. Vinogradov, T. Vinogradova, V. Shubin et al., in 2009
IEEE Nuclear Science Symposium Conference Record
(NSS/MIC) (2009), pp. 1496–1500. DOI 10.1109/
NSSMIC.2009.5402300
17. F. Padera. Measurement of Enhanced Specular Reflector
(ESR) Films Using a LAMBDA 1050+ UV/Vis/NIR
Spectrometer and URA Accessory. https://resources.
perkinelmer.com/lab-solutions/resources/docs/FAR_
Measurement-of-Enhanced-Specular-Reflector-Films-Using-LAMBDA-1050-and-URA-Accessory-012190_
01.pdf
18. J. Allison et al., Nucl. Instrum. Methods Phys. Res. A
835, 186 (2016). DOI 10.1016/j.nima.2016.06.125
19. M. Kuźniak A.M. Szelc, Instruments 5(1) (2021). DOI
10.3390/instruments5010004You can also read