Sizing Solar Energy Harvesters for Wireless Sensor Networks - Application Note M1002
←
→
Page content transcription
If your browser does not render page correctly, please read the page content below
Sizing Solar Energy
Harvesters for Wireless
   Sensor Networks
    Application Note M1002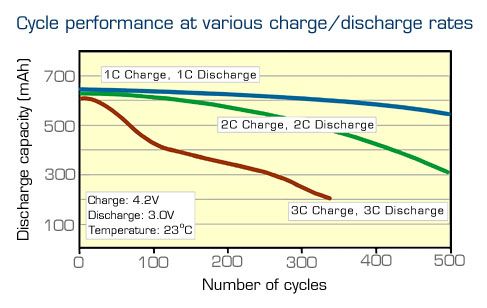
Why use Energy Harvesting?

A Wireless Sensing Network (WSN) is basically a wireless network that monitors or controls
some remotely‐located variable. A WSN can be as simple as the remote thermometer outside of
your house wirelessly sending temperature data to an LCD display unit inside. It could also be as
complex as a thousand‐unit system composed of wireless sensors sending well‐head data from
an oilfield back to the head‐end at a central office.

One problem common to most of these WSNs is lack of reliable power for the remote devices in
the network. Even in cases where power might be available, the cost and difficulty of wiring the
WSN remote to the existing power mains many times proves to be prohibitive. Many WSNs are
installed some years after the original installation of the system to be monitored. Power may be
available, but it’s simply too difficult to connect to the WSN after the fact.

Practically speaking, this means that most WSN devices out in the field are (primary) battery
powered. This is old news and wireless engineers have become quite adept over the years at
squeezing the last coulomb out of every new battery technology – Lead Acid, NiCad, Nickel‐
Metal Hydride and now Lithium Ion – to power these systems. Millions of battery powered,
wireless water and gas meters operating all over the planet are a testament to the ability of
standard battery technology to power WSN devices.

There is a limitation to using primary batteries to power WSNs though ‐ capacity. The current
consumption requirements for some WSN applications will be such that sizing a battery for the
proverbial 5‐year lifetime would require a 65 pound, 12 volt deep‐discharge cell for a primary
source. Sometimes that will work, sometimes it won’t.

If the 5‐year cell is too large, you could specify a shorter time between battery change‐out and
use a smaller cell. However this isn’t possible in many situations. With some WSN nodes, it’s
simply too hard to replace the battery. Think of monitoring devices atop a 1000 foot tower or on
the superstructure of a long bridge. Extreme examples, but you get the point.

It is in these special situations that energy harvesting shines. The term “Energy harvesting” is
fairly self‐explanatory. We extract some form of energy from the ambient environment to
power the WSN device. The system is self‐replenishing and alleviates the problem of providing
sufficient battery reserve to last many years of operation. Energy harvesting has its own set of
problems, but many of those can be mitigated with careful design. It goes without saying that an
energy harvesting system must be able to extract more energy than the WSN consumes (usually
substantially more). Past that limitation though, there are a number of ways to make this work.

How much energy is available?

Many interesting (and quirky) techniques to harvest ambient energy have been suggested over
the past few years. Practically speaking though, there are really only four choices: Temperature
Differential, Vibration Light (indoor and out) and RF Energy.

© 2010 RF Monolithics, Inc.                AN‐M1002                                       1 of 10
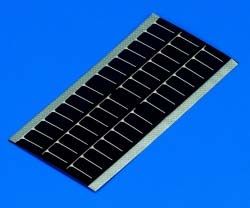
Table 11 shows estimated levels of available ambient energy from the four sources mentioned.

Table 1

    Energy Source                Harvested Power Levels
    Vibration/Motion
    Human                        4uW/cm2
    Industrial                   100uW/ cm2
    Temperature Differential
    Human                        25uW/ cm2
    Industrial                   1‐10 mW/ cm2
    Light
    Indoor                       10uW/cm2
    Outdoor                      10mW/cm2
    RF Energy
    GSM                          0.1uW/cm2
    Wi‐Fi                        1uW/cm2

Each of these sources is worth discussion on its own but for now we’ll focus on the highest
performer. Putting the high‐end estimate for Temperature Differential aside, you can see that
outdoor lighting provides an order of magnitude more energy than the other available options.

In fact, a commonly quoted textbook value for the amount of solar energy falling in 1 square
meter is 1000 watts. That’s an impressive amount of energy. This fact explains the tremendous
interest in finding commercially viable means to convert this free energy to electricity.

Again, this is old news. Most remote road signs, call boxes and environmental monitoring
stations have used Solar (Photovoltaic or PV) energy for years to supply their needs. Generally
speaking though, PV technology was used in high‐value products that could support the
additional cost of the Solar cells. As the prices of these PV cells continues to fall, the ability to
put basic energy harvesting technology into everyday WSNs becomes a real possibility.

Choice of PV Cells

PV cells come in too many flavors to count and the list of exotic, high‐efficiency materials grows
longer every month. The differences in technology usually center on efficiency – the ability of
the cell to convert photons to electrons – and/or production volume cost. From an electrical
standpoint, all PV cells look pretty much the same; a light‐controlled current source in parallel
with a diode. Output current is a function of the physical size and efficiency of the cell. Output
voltage per cell is essentially one diode drop; roughly 0.5 to 0.6 volts. Higher voltage cells are
composed of stacks of series cells.

1
   Energy Harvesting: ULP meets Energy Harvesting, Texas Instruments Whitepaper:
http://www.ti.com/corp/docs/landing/cc430/graphics/slyy018_20081031.pdf

© 2010 RF Monolithics, Inc.                   AN‐M1002                                          2 of 10
We investigated two common types of PV cell for our energy harvesting work: Crystalline Silicon
and Thin Film. We’ll discuss those two in a little more detail.
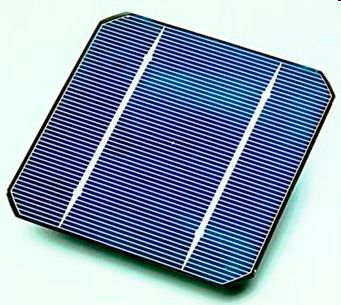
Crystalline Silicon cells (shown below in figure 1) are instantly recognizable as these are used in
most portable equipment. The portable emergency road sign sitting next to the interstate
highway is usually powered by a collection of these cells. These cells are moderately‐to‐
expensively priced and provide light‐to‐electrical power efficiencies of 10% to 20%.
Figure 1 Crystalline Silicon PV Cell
Thin film PV cells (figure 2) are much less efficient than the Crystalline versions but are usually
cheaper and offer some mechanical flexibility. The latter feature can be very useful for
applications requiring the cells to cover a curved surface. Efficiencies for these cells hover in the
3% to 5% range. While this isn’t great, it can be a decent tradeoff versus the lower price.
Figure 2 Thin Film PV Cell (courtesy PowerFilm®)
How Much Energy can I Extract?
Figure Three2 shows a map of incident solar radiation for the USA for the month of January. This
plot is taken the National Renewable Energy Laboratory website. This data is an average taken
2
http://rredc.nrel.gov/solar/old_data/nsrdb/redbook/atlas/
© 2010 RF Monolithics, Inc. AN‐M1002 3 of 10over almost 30 years and represents the best data we were able to find. The NREL web page shows solar radiation for every month at peak, average and minimum levels and at every possible orientation of PV cell relative to the sun. For this exercise, we chose minimum values for the month of January with a PV cell orientation facing due south angled up at latitude. Figure 3 NREL Minimum Solar Radiation data for January, USA Incident solar radiation is sometimes referred to as Insolation (Incident Solar Radiation). The values in the lower right hand corner of Figure 3 show that the Minimum Insolation level for Atlanta Georgia in January is 2.5 kWh/m2/day. This unit of measurement ‐ kWh/m2/day – is confusing to say the least. It represents the amount of energy (measured in kW‐hours) accumulated over 1 square meter in a 24 hour period. Of course, there is no sunlight each evening so the values correspond to the energy absorbed during daylight hours. Dimensional analysis shows that this value corresponds to: 2500W * 3600s / hour = 9 Megajoules of energy falling on an area of 1 m2 over the period of one day. That’s a lot of energy. Now that we know the Insolation for a given area, we can calculate how much of that energy can be converted to electrical form using the following equation: Eelectrical = Esolar * Effective _ area * PVefficiency Esolar is the power available from the sun. Effective area is the surface area in the cell actually absorbing photons and is measured in m2. PV efficiency quantifies the PV cell’s ability to convert light energy to current. For the purposes of this white paper, we’ll assume 3% efficiency for © 2010 RF Monolithics, Inc. AN‐M1002 4 of 10
Thin‐Film cells and 15% for Crystalline Silicon cells. The following calculation shows the energy
extracted by a typical, low cost Thin‐Film PV cell while operating under January’s dim sunlight.

MP3‐25 Thin film cell from PowerFilm
Insolation Energy = 9 Megajoules/m2 (typical January in Atlanta Georgia, taken from calculations
above)
Effective aperture = 25 mm by 100 mm = 0.0025 m2,
Efficiency = 3%

Eelectrical = 9Megajoules / m 2 * 0.0025m 2 * 0.03 = 675 Joules

If your WSN remote device is in Atlanta and if 675 joules isn’t enough to power the application
(we’ll get to that calculation in a minute), you’ll have to use more PV cells or cells with a larger
area. From an electrical standpoint, PV cells are essentially current sources and easily combine
in parallel. To double the output power, simply double the number of cells. More about this
concept later on.

Energy Storage

For outdoor, solar‐powered WSNs, we must deal with the obvious fact that sunlight isn’t
available all the time. Unless the WSN device is designed to operate only under full sun, the
harvesting circuits must have some type of energy storage to maintain power throughout the
night and during cloudy days. There are two options for power storage: Supercaps and
rechargeable (secondary) Batteries.

Supercaps

Supercaps are aptly named. They’re nothing more than very (!) large value capacitors.
Capacitance values of up to 50 Farads are not unheard of. Working voltages are usually limited
to 2.5 volts so Supercaps are many times stacked in series to handle the voltages needed to
power the WSN device circuitry (3.3 volts to 5.0 volts).

A capacitor is capable of storing joules of energy. A 50‐Farad, 2.5 volt device can store at much
as 156.25 joules of energy. This is not a particularly large value compared to a AA Li‐Ion battery
at 31,000 joules, but the Supercap has some advantages nonetheless. Most important is the
number of charge cycles. The energy storage device in a solar powered WSN will be charged and
discharged daily (if not more often) because of day/night cycles. Three years of operation will
result in over 1000 charge/discharge cycles. This can cause problems for many battery families
because they are limited to 500‐1000 charge/discharge cycles before significantly losing
capacity. Supercaps have no such limitation and can be charged/discharged millions of times.

Supercaps can also provide higher peak currents to a load than can many battery families. The
AA Li‐Ion battery mentioned above can provide about 1 Amp of peak current. Contrast that to
the HS206 ‐ a low‐ESR 600 mF Supercap from Cap‐XX ‐ that can produce up to 22 Amps of peak
current.

© 2010 RF Monolithics, Inc.                  AN‐M1002                                          5 of 10
Batteries

For any given volume, a Battery can store far more joules of energy than can a Supercap.
Generally speaking, a battery will be required to store the requisite power for most any WSN
Remote device. We found that a combination of the two worked best in our prototypes. We
used the battery as the main reservoir and the Supercap to provide peak currents.

Practically speaking, there are four rechargeable battery technologies available for use: Lead‐
Acid, Ni‐Cad, Nickel‐Metal Hydride (NiMH) and Li‐Ion. As with every technology, each has
advantages and disadvantages. Lead‐Acid and Ni‐Cad are reasonably priced, easily available and
time‐tested but are becoming increasingly unattractive because of environmental problems
with their Lead and Cadmium content. That leaves Nickel‐Metal Hydride and Li‐Ion. Of those
two, Li‐Ion has the major advantage of operating at 3.6 volts versus 1.2 volts for the NiMH.
Usually, one Li‐Ion battery will suffice to directly power most WSN electronics whereas it would
take 3 of the NiMH in series to do the same.

How Much Energy Storage and Harvesting capacity is Needed?

Now it’s time to talk about the demand side of the energy balance equation. In order to
conserve energy, most WSN Remote devices spend 99% of their lives in a very low‐current timer
sleep mode, waking regularly to interface with a sensor/controller and then transmit a
telemetry signal back to the head‐end. The current consumption profile for a typical WSN device
with a 5 minute wake cycle might look like the following diagram.

 WSN                                      Active
 CurrentConsumption                       current:
 profile                                  200mA

                         Sleep (timer)
                         current: 5uA

                                Sleep
                                period;     Wake period; 500 ms
                                4.992
                                minutes

The real‐time clock in the WSN device consumes 5 uA for 4 minutes and 59.5 seconds. The
device wakes up at the 4.992 minute mark, measures some quantity or performs some task and
then transmits and/or receives a signal from the head end. This activity lasts a total of 500 ms
and draws 200 mA in the process. The device then goes back to timer sleep and the cycle begins
again.

With this example, we need to note both peak and average current when calculating the energy
storage and harvesting requirements. First make sure that the storage device can handle the
200 mA peak requirement. A typical AA, rechargeable Li‐Ion battery can source over an amp of
peak current so this usually isn’t a limitation.

© 2010 RF Monolithics, Inc.                AN‐M1002                                      6 of 10
Average current for the above example is calculated as:
Iave = 5uA * (299.5s / 300s) + 200mA * (0.5s / 300s ) = 4.99uA + 334uA = 339uA
Over a 24 hour period, the total current consumed amounts to:
339uA * 24hours = 8.14mA _ hours
If we assume a 3.6 volt Li‐Ion battery is used to power the WSN, then the energy consumed over
24 hours will be:
3.6V * 8.14mA _ hours * 3600s / hours = 105.5 Joules
Depending on the location of the WSN device, there can be many consecutive days of inclement
weather when the PV cells will not collect much useful energy. The battery must store sufficient
energy to cover those days as well. Just how many dark days you should accommodate with
your design is a hard question to answer. The numbers are all over the map.
This NOAA site3 gives the number of cloudy days per month for most major US cities. Values
range from 4 cloudy days for Phoenix in July to 26 cloudy days for December in Portland Oregon.
Unfortunately, the NOAA table doesn’t show whether or not those cloudy days are consecutive
or spread apart. That’s crucial for Portland in December because you’ve got to make up for the
energy loss incurred over 26 dark days with only 5 well‐lit days. The more consecutive cloudy
days you make allowance for, the larger your battery must be and the more solar cells you must
use. That adds cost, weight and size to the WSN design.
As it turns out, Milwaukee and Green Bay Wisconsin currently hold the dubious NOAA
distinction4 for most consecutive cloudy days at 17. Using that as a maximum, the WSN device
described above would require a battery with at least:
8.14mA _ hours / day *17days = 138.4mA _ hours of capacity.
One final consideration when sizing batteries for the harvesting application is depth of
discharge. In the section on Supercaps, we mentioned the limitations in the number of
charge/discharge cycles for rechargeable batteries. Li‐Ion cells exhibit as good, if not slightly
better, resilience than most other battery types and were chosen for that reason for our
investigation. Standard quoted lifetime values range between 500‐1000 cycles.
Conversations with engineers at PowerStream Batteries along with information from the Battery
University website5 lead us to believe that these oft‐quoted lifetime limitations assume that the
battery has been deeply charged and discharged every cycle. Our limited research indicates that
3
http://lwf.ncdc.noaa.gov/oa/climate/online/ccd/cldy.html
4
http://www.ncdc.noaa.gov/oa/climate/research/2006/jan/januaryext2006.html
5
http://www.batteryuniversity.com/parttwo-34.htm
© 2010 RF Monolithics, Inc. AN‐M1002 7 of 10sipping rather than gulping from the Li‐Ion battery is the best course to take and will greatly lengthen the battery's life. Figure 5. (courtesy of BatteryUniversity.com) The data shown in Figure 5 from the BatteryUniveristy website corroborates this theory. For a given capacity, decreasing the charge and discharge rates by a factor of two extends the cycle lifetime of the battery by roughly the same factor. In theory, this trend continues as shallower charge/discharge depths are used. This points to using a larger capacity battery than is strictly required by the energy storage requirements in order to extend the lifetime of the battery. For instance, in the hypothetical Green Bay/Milwaukee example requiring 138 mA‐hours of capacity, we might use a 750 mA‐ hour capacity battery. This would reduce the charge/discharge depth to 138/750 at most (0.184 C) and greatly extend the cycle life of the battery. Example System Calculation With the basics covered, we'll now run through a system‐level calculation. This amounts to nothing more than a simple energy‐balance equation. The calculated energy coming in from the ambient environment must be greater than the calculated energy consumed by the WSN. Assume that a WSN device consumes an average current of 500 uA, requires a peak current of 200 mA, operates in Atlanta Georgia in January, and is designed to handle up to 1 week of overcast weather before running out of power. Here's how we size the system. The current discharged from the battery over a 1 week period is: 500uA * 24hours / day * 7days = 84mA _ hours Therefore, our battery must have at least 84 mA_hours of capacity. To extend battery life (and to provide sufficient margin for aging, internal resistance, production tolerance, etc.) we'll chose a battery with higher capacity. A standard, rechargeable AA Lithium‐Ion battery rated at 750 mA*hours would provide plenty of margin. The 84/750 (0.112 C) discharge to capacity ratio suggests that the battery should last over many thousands of cycles. The AA sized cell will © 2010 RF Monolithics, Inc. AN‐M1002 8 of 10
produce peak currents of over an amp so our peak current requirement of 200 mA is not a
problem either.

Now to size the harvesting circuitry. Worst case, you could assume that you must recharge the
battery completely in one day to be ready for the next 7 day stint of low sunlight. In practice
though, the battery will continue to operate the WSN device even if not fully charged in a day so
the designer has considerable leeway when sizing the harvester.

84 mA*hours of capacity at 3.6 volts equates to a stored energy value of:

84mA _ hours * 3.6V * 3600s / hour = 1089 Joules

Worst case, our harvester must provide at least that amount of energy in one day to refill the
battery. Using the MP3‐25 PV cell efficiency and size information plus the Insolation values for
January in Atlanta on page 4, we get the following:

MP3‐25 Energy Output in one day = 675 joules (calculated on page 4)

Number _ of _ Cells = 1089 Joules / 675 Joules = 1.6cells

We'd need at least two of these thin film PV cells to fully recharge the battery in one day.

Correspondingly, a Crystalline PV cell with the same area and 15% efficiency would produce
3375 joules in one day and require only 1 cell to fully recharge the battery.

Note that this calculation produces a very optimistic number. First, the circuitry needed to
transfer the power from the PV cells to your WSN device will waste a portion of the gathered
energy. PV cell voltages can be very low – on the order of 0.5 volts per cell – and the boost
circuitry needed to bring that up to useable levels can be inefficient. Second, the Insolation
values used in our calculations are averaged over 30 years. Actual light levels can be lower than
the averages. The calculations above just provide a starting point. Our advice is to design in
more PV cells than absolutely necessary.

We constructed two solar harvesting WSN prototypes as part of our investigation. We used five
Thin Film PV cells in one unit and two Crystalline cells in the other. Both survived a very dark and
rainy Atlanta January with many successive cloudy days. This was certainly no demonstration of
worst case operation but it gives some evidence that our harvesting circuitry was sized about
right.

Note that while there is may be some leeway in determining how much harvesting capacity to
put into place, the storage battery capacity must be adequate to cover the maximum number of
dark days you intend to support without recharge. There's no getting around that number.

Summary

Energy harvesting techniques can have a definite role in powering remote WSN devices. Solar
power, in particular, can be a very useful source because of its high energy density and

© 2010 RF Monolithics, Inc.                 AN‐M1002                                           9 of 10
availability around the globe, PV cell technology continues to improve and costs continue to
drop. All of these factors make solar energy harvesting a viable option for long‐term powering of
remote WSN devices.

As evidenced by this paper; however, care must be taken when designing a solar energy
harvester to make sure it will meet the needs of customers in all locations. There are inherent
tradeoffs that must be made to deliver a product with sufficient run time in the absence of
sunlight yet meets ever more demanding cost targets. Fortunately, both costs and efficiencies of
solar cells are improving making solar energy appropriate for a larger population of wireless
sensor network applications.

See Also:

Solar Energy Harvester for Wireless Sensor Networks, RF Monolithics, AN‐M1001

© 2010 RF Monolithics, Inc.                AN‐M1002                                      10 of 10
You can also read