Smartphone Time Machine: Tech-Supported Improvements in Time Perspective and Wellbeing Measures - Frontiers
←
→
Page content transcription
If your browser does not render page correctly, please read the page content below
ORIGINAL RESEARCH
                                                                                                                                        published: 03 November 2021
                                                                                                                                      doi: 10.3389/fpsyg.2021.744209

                                            Smartphone Time Machine:
                                            Tech-Supported Improvements in
                                            Time Perspective and Wellbeing
                                            Measures
                                            Julia Mossbridge 1,2,3* , Khari Johnson 1 , Polly Washburn 1 , Amber Williams 1 and
                                            Michael Sapiro 1
                                            1
                                             TILT: The Institute for Love and Time, Sebastopol, CA, United States, 2 University of San Diego, San Diego, CA,
                                            United States, 3 Institute of Noetic Sciences, Petaluma, CA, United States

                                            Individuals with a balanced time perspective, which includes good thoughts about the
                                            past, awareness of present constraints and adaptive planning for a positive future,
                                            are more likely to report optimal wellbeing. However, people who have had traumas
                                            such as adverse childhood experiences (ACEs) are likely to have less balanced time
                                            perspectives and lower overall wellbeing when compared to those with fewer or no
                                            ACEs. Time perspective can be improved via time-travel narratives that support people
                                            in feeling connected to a wise and loving future version of themselves, an approach that
                           Edited by:
                      Everton Maraldi,
                                            has until now only been provided in counseling contexts. Our team used an iterative
  Pontifical Catholic University of São     inclusive design process to shape a scalable time-travel narrative tool – a responsive
                          Paulo, Brazil
                                            and progressive web application called Time Machine. Among other functionalities,
                       Reviewed by:
                                            Time Machine allowed people to record and listen to messages as if they were from
                      James Houran,
 Integrated Knowledge Systems, Inc.,        and to their past and future selves. Using pre-planned as well as post-hoc analyses,
                        United States       we analyzed quantitative and qualitative data from 96 paid design partners (participants)
                    David H. V. Vogel,
     Jülich Research Centre, Germany
                                            who were taken through a 26-day pilot study of the technology. Among other effects, the
                *Correspondence:
                                            results revealed: (1) high engagement throughout the design process, (2) improvements
                    Julia Mossbridge        in self-reported time perspective and overall wellbeing scores that were greater for those
          jmossbridge@sandiego.edu
                                            using Time Machine during an optional-use period, (3) twice as much improvement in
                   Specialty section:
                                            overall wellbeing scores for design partners with high ACEs (16%) versus low ACEs (8%),
         This article was submitted to      and (4) feelings of unconditional love apparently mediating the relationship between
                    Health Psychology,
                                            scores on time perspective and overall wellbeing measures. We discuss the limitations
               a section of the journal
               Frontiers in Psychology      of these results as well as implications for the future role of spiritually informed scalable
            Received: 20 July 2021          time-travel narrative technologies in healthcare and wellness.
        Accepted: 08 October 2021
      Published: 03 November 2021           Keywords: time perspective, wellbeing, transcendence technology, adverse childhood experiences, mental time
                                            travel, hope, unconditional love, prospection
                             Citation:
            Mossbridge J, Johnson K,
Washburn P, Williams A and Sapiro M
  (2021) Smartphone Time Machine:
                                            INTRODUCTION
       Tech-Supported Improvements
   in Time Perspective and Wellbeing
                                            The ideal time perspective has been a topic of popular discussion for centuries. For instance, two
                            Measures.       forms of time were personified by the Greeks: Kronos vs. Kairos; these are similar in meaning to two
           Front. Psychol. 12:744209.       Hindu words for time, Kala vs. Ritu (e.g., Makridakis, 2012; Lindley et al., 2013; Valentine, 2020).
     doi: 10.3389/fpsyg.2021.744209         According to these accounts, Kronos/kala both refer to the externally measured chronological

Frontiers in Psychology | www.frontiersin.org                                      1                                      November 2021 | Volume 12 | Article 744209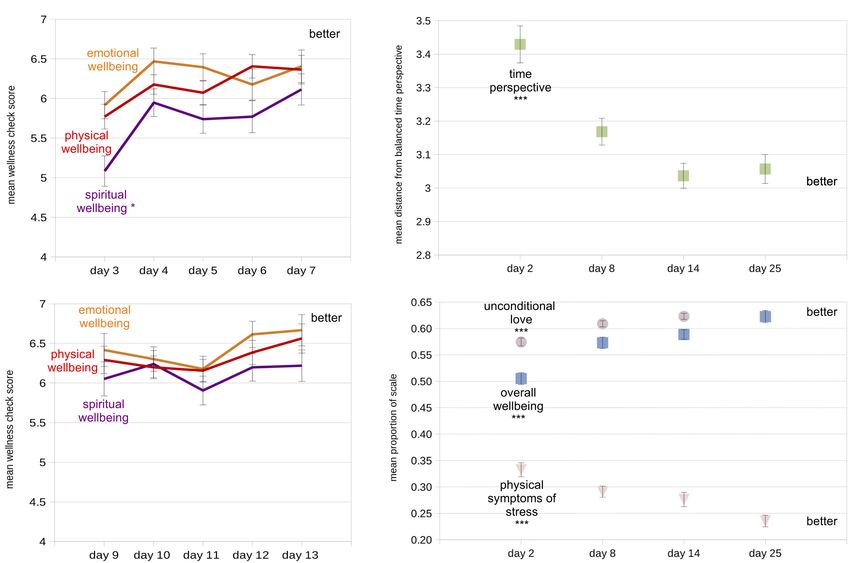
Mossbridge et al.                                                                                                       Smartphone Time Machine

aspect of events, while Kairos/ritu both refer to the internally               Not surprisingly, our time perspectives are informed by
measured, subjectively experienced aspect of events. Meanwhile             our experiences. For example, in one study, people with post-
in recent academic philosophy, an argument has emerged in                  traumatic stress disorder from a car accident experience had
which some philosophers state that a fully rational human would            levels of PTSD that were partially remediated by having a
have no temporal bias; for instance, a rational human would have           more balanced time perspective (Stolarski and Cyniak-Cieciura,
no preference to have the bad things in life behind us and the             2016). Further, in an examination of lifetime exposure to trauma
good things ahead of us, because we are always the same person             and optimism for the future, deviations from a balanced time
having the experience (Sullivan, 2018). Another philosophical              perspective partially mediated the relationship between more
camp states that it is both reasonable and common to have                  trauma exposure and less optimism (Tomich and Tolich, 2021).
temporal biases such as these, or in any case that such temporal           The broader implication of such studies is that those of us who
biases can be rationalized (Greene et al., 2021).                          have experienced trauma but have balanced time perspectives
    Beyond these philosophical speculations, recent interest in            may be more likely to report higher overall wellbeing than
the impact of time perspective on human wellbeing has                      those who have experienced trauma but have a time perspective
been rekindled by empirical investigations motivated by the                that deviates greatly from optimal balance. Thus interventions
recognition that subjective wellbeing and positive affect are              that move people toward a balanced time perspective could be
related to one’s relationship to the temporal features of one’s            beneficial, especially for those who have experienced trauma.
own life (Zimbardo and Boyd, 1999; Boniwell et al., 2010; Zhang                Time perspective does seem amenable to intervention,
et al., 2013a; Stolarski, 2016; Cordonnier et al., 2018; Salgado           sometimes leading to increases in wellbeing or other positive
and Berntsen, 2018; Sanson et al., 2018; Jankowski et al., 2020).          correlates of a balanced time perspective. Research in positive
For instance, “mental time travel” can be used to prospectively            psychology has shown that a narrative approach can be an
“pre-live” events based on templates from past experiences,                empowering tool for positive change (White and Epston, 1990;
and in fact such future-focused mental time travel has been                Zimmerman and Dickerson, 1996; Sheldon and Vansteenkiste,
found to be generally more positive and evocative than mentally            2006). Some practitioners and researchers have used what we
visiting past events to direct behavior (Sanson et al., 2018).             call “time-travel narratives,” in which people are coached to use
This could be due to a positivity bias when it comes to near-              ideas about past and future versions of themselves to create
term future prospection (Salgado and Berntsen, 2018), which                more balanced time perspectives and achieve positive behavioral
may arise because memories of actual events constrain our re-              changes, both within therapeutic contexts (Newsome, 2004; Kress
representations of the past, but not the future (Cordonnier                et al., 2008, 2011; Hoffman et al., 2010; Palgi and Ben-Ezra,
et al., 2018). What has been called a “balanced time perspective”          2010; Madden et al., 2011; Palgi et al., 2014) and outside of
represents an intricate interplay between realistic and positive           them (Hall and Fong, 2003; Schuitema et al., 2014; Snider
awareness of the past and present combined with willingness                et al., 2016). However, research on the efficacy of time travel
to hope and plan for a realistically positive future. Those with           narratives as an independent intervention not accompanied by
more positive and less negative thoughts about the past, non-              other coaching or therapies is in its infancy, probably because it
fatalistic thoughts about the present, and a greater frequency             is expensive to target in-person interventions to a large number
of future-engaged thoughts are more likely to rank themselves              of appropriate individuals.
as optimally functioning, having greater wellbeing, experiencing               Following the recent trend of making evidence-based positive
less negative affect and more life satisfaction than those who             psychology tools available via scalable mobile and internet
do not share this balanced time perspective (for review, see               applications (Mossbridge, 2016; Diefenbach, 2018; Kitson et al.,
Jankowski et al., 2020).                                                   2018; Miller and Polson, 2019), we set out to create an
    For depressed adolescents and adults, realistic optimism and           affordable, accessible, evidence-based, self-administered, time-
strong future orientation have been associated with decreased              travel narrative technology designed to balance time perspectives
depressive and suicidal symptoms (Puskar et al., 1999; Gillham             and potentially improve wellbeing. We define a time-travel
and Reivich, 2004; Hirsch et al., 2006, 2007, 2009; Chang et al.,          narrative technology as any scalable tool that helps people
2019). Among under-resourced youth, violence decreases as                  build the habit of working to heal negative memories of the
future orientation improves over time (Stoddard et al., 2011),             past and weaving an engaged present into their hopes and
robust future orientation has been considered a protective factor          goals for a positive future. We were especially focused on
in high-violence communities (So et al., 2018), and among                  co-designing the technology with those who had experienced
abused youth, future orientation improves as resources improve             trauma, including abuse, addiction, poverty, incarceration, and
(Oshri et al., 2018). Further, future time perspective predicted the       neglect. This is because in our previous experience with evidence-
success of inmates in a vocational training program (Chubick               based technology development, we had become acquainted
et al., 1999). But a balanced time perspective is not isolated             with the principle that when technology is not designed by
to the future. For instance, research on daydreaming indicates             the intended beneficiaries, the technology ends up not being
that dreams of a very positive future that do not match at                 beneficial (McGuinness and Schank, 2021). Thus we had two
all our present circumstances — as in “I’m sick with cancer                aims for this pilot study: (1) create an inclusive design process
now but tomorrow I’ll be well,” — actually increase depression,            to support the creation of a prototype time-travel narrative tool,
even though the fantasies seem to induce some happiness in us              and (2) test the efficacy of this prototype. Our primary research
(Oettingen et al., 2016).                                                  questions were whether our inclusively designed prototype could

Frontiers in Psychology | www.frontiersin.org                          2                                November 2021 | Volume 12 | Article 744209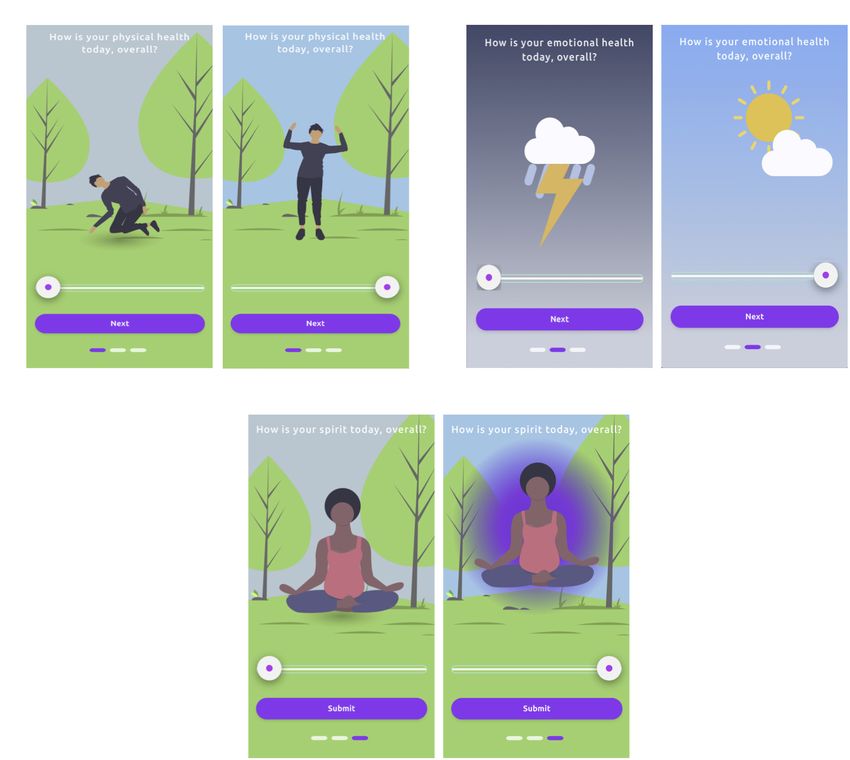
Mossbridge et al.                                                                                                        Smartphone Time Machine

support people in balancing their time perspectives, increasing           This allowed us to respond to feedback from design partners
feelings of unconditional love [as defined in Mossbridge et al.           about features they would like to see in future iterations of the
(2021); see Methods “Recurring Assessments (Study Days 2, 8, 14,          technology. This “Time Machine” technology used a “dashboard”
25)”], and improving measures of physical and overall wellbeing.          approach to present four components to our design partners:
Here we offer an overview of the inclusive design process as              efficacy tracking, the recording task, the quote task, and wellness
well as quantitative and qualitative results that shed light on           checks. All three were timed as “to-do” items on the dashboard,
these questions.                                                          and all followed the study schedule. Design partners could
                                                                          skip days and put the study on hold for up to 4 months,
                                                                          but the technology required them to complete all 10 days
MATERIALS AND METHODS                                                     of the experimental and control conditions and all required
                                                                          surveys if they chose to remain in the study. Each component
Procedure                                                                 was presented to the user at the required time, according to
Focus Groups and Demographics Survey Completion                           the study timeline (Figure 1). Each of these components are
To reach our first aim of creating an inclusive software design           described below.
and testing process, we invited all screened and consented
participants to a ∼1.5-hour online (Zoom) focus group. The                Efficacy Tracking
first and last authors (JM and MS) facilitated each focus group.          To measure the efficacy of the technology, we used a between-
During the first 30 min of each focus group, the first author             groups crossover design. The Time Machine software randomly
briefed the participants on the scientific background, the overall        assigned design partners to one of two groups: recording-first
study design, and their important role as design partners. Then           group (N = 52) or quote-first group (N = 44; Figure 1). The
we gave the design partners a link to an online demographics              experimental condition was the recording task (see below) and
survey and the Adverse Childhood Experiences Survey (ACES;                the control condition was the quote task (see below). The four
Felitti et al., 1998). After these surveys, the last author led the       dependent variables were the linear deviation from a balanced
design partners in a 15–20 min time travel narrative meditation,          time perspective (see section “Data Analysis”) and responses
in which they were encouraged to imagine visiting a past and a            to questions related to physical symptoms of stress, feelings of
future version of themselves, and were especially encouraged to           unconditional love, and overall wellbeing (see Surveys). These
imagine being loved by their future self. After this meditation,          variables were calculated from responses to each of the four
both facilitators shared how time travel narratives like this one         recurring assessment surveys administered on days 2, 8, 14, and
have helped them. Finally, we opened up the meeting for a                 25 (see surveys, below), which were administered on a HIPAA-
20- to 30-min period during which design partners debriefed               enabled survey site (FormSite) launched from the dashboard of
from their experiences and asked questions about the technology           the Time Machine. The independent variables were the ACES
and the study. During the entire focus group, we supported the            score taken from the survey administered during the focus group
sharing of private information only when design partners left             (day 1; see Surveys), group (task order), and the number of logins
their video and audio feeds off, created anonymous screen names,          to the Time Machine during the 10-day unpaid optional period of
and knew how to privately communicate via the chat window to              the study. To ensure private and accurate storage of information
the two facilitators. When the debriefing seemed complete and             pertinent to each design partner, FormSite received a hashed
all questions were answered, our design partners were reminded            version of the design partner’s identity via the URL used to launch
of the payment schedule, the fact that they could drop out at any         the survey site, and passed back to Time Machine a confirmation
time and receive prorated payment for the work they had already           that the design partner had completed a survey. However, no
done, and the fact that they could take as long as they like (up to       survey responses were stored within the Firebase database.
5 months) to complete the 26 days of the study.
                                                                          Recording Task
Technology Development                                                    The recording task was a self-guided scalable replication of a
Our second aim was to design, build and test accessible and               time-travel narrative. Design partners were asked to record a
scalable software to engage our population in a time travel               message to their past and future selves, and then send the message
narrative task (“recording task”) and compare the benefits of             into their time machine. The next day, design partners were given
engaging in that task, if any, with benefits derived from a control       access to the previous day’s message from the time machine and
task (“quote task”; Figure 1 and below). We chose a browser-              asked to listen to their message with love for themselves. They
based progressive web application coded in JavaScript, CSS and            were not instructed how to do this, but were asked to try to
HTML 5+ with a Firebase backend; we decided not to create                 imagine doing so. The aim of the recording task was to help give
a pre-packaged mobile app so the technology could eventually              our design partners a daily reminder that they are continuously
become available to incarcerated people who are more likely               existing entities, that they are getting through each day and
to have access to the internet without access to mobile apps.             moving onto the next, and that they can develop a positive
Our design, development, and project management leads (AW,                relationship to their internal representations of their future selves.
KJ, and PW, respectively) created and executed an iterative               During the focus group, this task was described as the task that
roll-out process that allowed us to continually update design             was most like the guided meditation conducted during the focus
and functionality throughout the study without altering any of            group, so our design partners were aware that this task was of
the primary scientifically important aspects of the technology.           most interest to us (i.e., they were not blind to the study design).

Frontiers in Psychology | www.frontiersin.org                         3                                  November 2021 | Volume 12 | Article 744209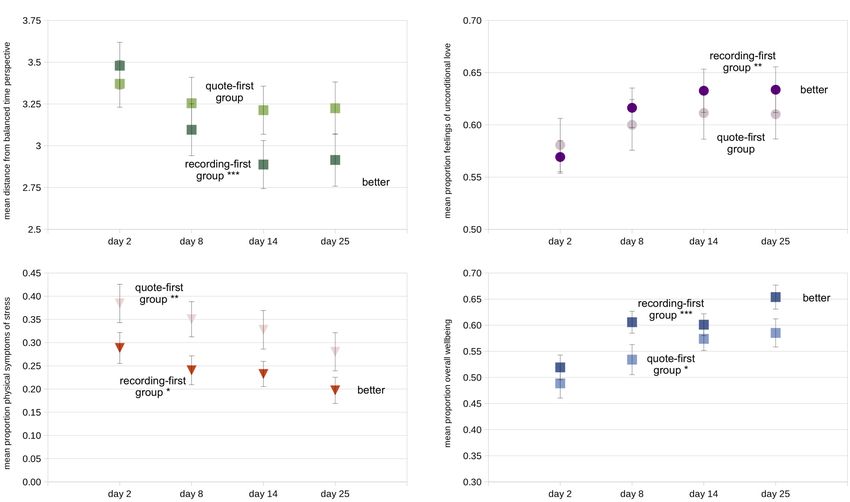
Mossbridge et al.                                                                                                                           Smartphone Time Machine

  FIGURE 1 | Schematic of study design. We used a crossover design comparing two task orders (recording-first, quote-first). All 96 design partners engaged in all
  required (paid) days, spread over as few as 26 days (shortest time frame) to 5 months (longest time frame). ACES = Adverse childhood experiences study.

After the first recording was made, no advancement in the study                       Hypotheses
was allowed without playing the previous day’s recording and                          We tested five hypotheses in this pilot study. All tests of these
pressing a button stating “I’m Done.”                                                 hypotheses were pre-planned.
Quote Task                                                                               Hypothesis 1. Measures of time perspective, physical
In the quote task, design partners were encouraged to listen with                        symptoms of stress, unconditional love, and overall wellbeing
love to randomly selected recording of one of our project staff                          (i.e., all dependent variables) will improve from the first to last
reading an inspirational quote. The quote being read was also                            days of the study for participants who use the Time Machine
shown on the screen. This task was meant to be as close to the                           technology for the required study period.
recording task as possible without presenting the design partner
with their own voice and without relating to past or future selves.                      Hypothesis 2. Individuals who perform the recording task
In this way, it controlled for the act of being encouraged to listen                     prior to the quote task will show greater improvement from
to positive words with love. No advancement in the study was                             the first to last days of the study in all dependent variables than
allowed without playing the recording and pressing a button                              participants who perform the tasks in the reverse order.
stating “I’m Done.”                                                                      Hypothesis 3. All dependent variables will initially be better
Experimental Wellness Checks                                                             (more adaptive) for individuals who report relatively lower
Wellness checks consisted of three animated sliders presented in                         versus higher numbers of ACES.
this order: physical, emotional, and spiritual wellness. To boost                        Hypothesis 4. Individuals with lower numbers of ACES will
engagement, we allowed design partners to discover that moving                           report greater improvement from the first to last days of the
the sliders to the right (highest score: 10) produced animated                           study in all dependent variables than individuals with higher
positive changes in the graphics for each slider, while moving the                       numbers of ACES.
sliders to the left (lowest score: 0) produced animated negative
changes (Figure 2). These wellness checks were presented right                           Hypothesis 5. Improvements from the first to last days of the
after design partners completed their recording or quote task on                         study in all dependent variables will be greater with greater use
any non-survey day. No advancement in the study was allowed                              of the technology during the optional study period.
without completing the wellness checks for that day; the default
position for each slider was in the middle of the screen. Because                     Design Partners (Participants)
of the experimental nature of the wellness checks, responses were                     All design partners were asked to read and sign an online consent
not included as part of the formal set of dependent variables,                        form. No design partner was invited to the online focus group
but we present analyses of the data they produced regardless (see                     or given access to the time travel narrative technology unless they
section “Results”).                                                                   consented. Human subjects protocols and consent processes were

Frontiers in Psychology | www.frontiersin.org                                     4                                       November 2021 | Volume 12 | Article 744209
Mossbridge et al.                                                                                                                              Smartphone Time Machine

  FIGURE 2 | Wellness check sliders showing discoverable animations indicating meaning of slider positions; left = low rating and right = high rating in all cases.
  (A) physical, (B) emotional, (C) spiritual. Three rectangles at the bottom of the screen indicate slider progress. All three sliders were required to be moved before a
  task day (or non-survey day) was considered complete; default position was center. We analyzed data from these wellness checks, though they were not among the
  formally defined dependent variables.

approved by the Institute of Noetic Sciences Institutional Review                       days were optional. Each design partner who finished the entire
Board under approval number MOSJ_2020_01. From August                                   experiment received $180. No design partner chose to withdraw
1, 2020-Dec 15, 2020 we enrolled 104 design partners in the                             from the study and receive prorated payment.
study. Nineteen were recruited as a result of social workers and
addiction counselors distributing our flier, the remaining were                         Efficacy Tracking Surveys
pre-screened with a survey advertised on Amazon Mechanical                              Figure 1 gives a schematized version of the efficacy tracking
Turk (mTurk) and Turker Nation, the Slack community for                                 timeline and study design; here we briefly describe each survey.
“Turkers” (workers on mTurk). The pre-screening included all
the demographics and ACEs questionnaire information that was                            Focus Group and Demographics (Study Day 1)
also requested on day 1 of the study (see below). The pre-                              On the first study day, design partners attended the 90-min focus
screening screened out non-native English speakers as well as                           group, completed a modified ACES inventory {described in Felitti
participants who reported neither adverse childhood experiences                         et al. (1998), validated in Murphy et al. (2014) [Chronbach’s
nor belonging to any traditionally under-resourced group                                alpha = 0.88]} with non-required responses asking permission to
(non-white, LGBTQ+, disabilities, incarceration, United States                          ask questions about a particular form of abuse prior to providing
military service). All participants were over age 18, but beyond                        those questions, as well as: “What is your race/ethnicity?” (open
that cutoff requirement no further age information was requested                        text field), “What is your gender?” (open text field), “Do you
from participants. Participants in the pilot study participated                         identify as LGBTQ+?” (yes/no), “Do you have disabilities that
in 3–4 total engagement hours over 26 days, with 16 days in                             have affected your life?” (yes/no), “Do you have a history
which engagement was required. The remaining 10 engagement                              of incarceration?” (yes/no/somewhere in between [“somewhere

Frontiers in Psychology | www.frontiersin.org                                       5                                        November 2021 | Volume 12 | Article 744209
Mossbridge et al. Smartphone Time Machine
in between” scored as yes]), “Have you ever served in the to these two measures as “measures” or “scores” rather than
United States military?” (yes/no). directly inferring that they represent actual reflections of physical
symptoms of stress and overall wellbeing.
Recurring Assessments (Study Days 2, 8, 14, 25)
The recurring assessment was performed four times during the Qualitative Feedback Survey (Study Day 26)
course of the study, and contained four measures: This survey asked the following questions to elicit feedback on
the study and the technology. “write about your experience of this
(1) The brief Zimbardo time perspective inventory [as pilot study over the past 26 days” (open text field), “let us know at
described and validated in Zhang et al. (2013b); test- least one thing you thought was good about how this study was
retest validity 0.73, mean 0.78 correlation with longer conducted” (open text field), “let us know anything you thought
Zimbardo measure]. Scores on this measure were used to we could have done better” (open text field), “in the future, would
calculate the deviation from a balanced time perspective you be interested in using technology like the technology you
(see Data Analysis, below). In the present study, test-retest used in this study?” (Yes/No), “if Yes, why?” (open text field), “if
validity averaged 0.70. No, why not?” (open text field), “What would you do to change
(2) A physical symptoms of stress scale with time frame over the technology so it would be easier to use, more interesting, more
the past 3 days [as used and described in Lee et al. engaging, or more positive for you as a user?” (open text field),
(2010) and originally developed by Patchen (1970) but “What would you suggest we do to reach more people with an
not validated]. As in Lee et al. (2010), physical symptoms improved version of this technology?” (open text field).
of stress were: headache, upset stomach, gas or bloated
feeling, and trouble getting to sleep. Participants used a 4-
Data Analysis
part scale to rate the occurrences of each symptom (0, 1, 2,
Quantitative Analyses
or 3+ times), and the sum of the occurrences (with 3 points
All quantitative analyses were performed using Libre Office
for 3+ times) was used as the score. In the present study,
Calc, R 4.1.0, Matlab R2018b, and the mediation bootstrapping
test-retest validity averaged 0.67.
program for R with 1000 simulations per model (Tingley et al.,
(3) A feelings of unconditional love scale with time frame
2014). We had no hypothesis about the linearity (or lack thereof)
over the past 3 days [as used and validated in Mossbridge
of the changes in the dependent variables over time, so instead of
et al. (2021); test-retest validity mean of 0.87, correlation
using one-way repeated measures ANOVAs, we compared final
with unvalidated love questionnaire mean of 0.67].
(day 25) and initial (day 2) values for each of the dependent
The definition of unconditional love was given as
variables, at times creating a difference score (first-to-last value;
“Unconditional love is the heartfelt benevolent desire
day 25 minus day 2). We compared initial and final values
that everyone and everything—ourselves, others, and all
with paired t-tests and compared differences between means of
that exists in the universe—reaches their greatest possible
separate groups with independent t-tests. We did not perform
fulfillment, whatever that may prove to be. This love is
Bonferroni correction of statistical tests on dependent variables
freely given, with no consideration of merit, with no strings
used to test the hypotheses, as all of these comparisons were
attached, with no expectation of return, and it is a love
planned. Alpha was set at 0.05 for significance testing, and while
that motivates supportive action in the one who loves.”
all tests were performed on raw (not scaled) data, the scaling
Following this definition, we asked participants to use a
factor was linear and would not have changed the results of the
five-point scale (from “never” to “a great deal” [0 to 5
statistical tests used. Scaling (dividing each score by the highest
points]) with a sixth possibility of “not applicable” (worth
possible score) was only used in tables and graphs for ease of
0 points) to respond to four questions: “To what extent
comparison between non-calculated dependent variables [i.e.,
do you feel unconditional love toward yourself?,” “...toward
scaling was used for all dependent variables except the deviation
other humans?,” “...toward animals?,” “...toward the device
from balanced time perspective (dBTP) measure (Jankowski
on which you are completing this survey?” The total score
et al., 2020)].
was the sum of the scores for all questions. In the present
Most analyses were straightforward, but the deviation from
study, test-retest validity averaged 0.72.
balanced time perspective (dBTP) measure was taken from a
(4) An overall wellbeing question (“How would you rate your
recent analysis indicating that the time perspective most closely
overall physical, emotional, and spiritual wellbeing over
associated with wellbeing is one described by this equation,
the past 3 days?” with a five-point scale: “worst I’ve ever
dubbed by the authors the Deviation from Balanced Time
felt,” “pretty bad,” “fair,” “really good,” “best I’ve ever felt.”
Perspective-revised, though we generally refer to this measure as
Scores were 1 (“worst”) to 5 (“best”). This is the first
dBTP:
usage of this measure and it is not yet validated relative to
q
other wellbeing measures. In the present study, test-retest
[1 − PN]2 [5 − PP]2 [1 − PF]2 [5 − F]2
dBTP-r_noPH =
validity averaged 0.51.
(1)
Calculated scores on these four surveys comprised our PN and PP indicate each participant’s past negative and past
dependent variables; note that two of them (physical symptoms of positive scores (respectively), PF and F indicate each participant’s
stress scale and the overall wellbeing measure) are not validated present fatalistic and future scores (respectively). The numbers
with respect to other measures. Thus we refer to results related 1 and 5 indicate the most adaptive (“balanced”) score for each
Frontiers in Psychology | www.frontiersin.org 6 November 2021 | Volume 12 | Article 744209Mossbridge et al. Smartphone Time Machine
time perspective factor (example: it is most adaptive for overall (93% completion rate). Of these, only 6 design partners took
wellbeing to think very few negative thoughts about the past longer than 30 days to complete the study, with the longest
[PN = 1] and many positive thoughts about the past [PP = 5]). time frame being 36 days. The remaining design partners did
Note that DBTP-r_noPH = 8 for a participant with the least not ask for partial payment or communicate with us to say
adaptive time perspective (all values as the four factors are at they dropped out, even after we contacted them to remind
the extreme end of the spectrum relative to the desired values), them they could receive partial payment. Our analyses included
and will be zero for a participant with a “perfectly balanced” time 96 of these design partners because values from one design
perspective. We choose to remove present hedonic (PH) values partner did not register in the database due to a technical error.
as a factor, due to their non-linear and apparently inconsistent Demographics for the 96 included design partners are shown in
relationship with overall wellbeing (Jankowski et al., 2020). We Table 1. We did not reach our goal of at least 50% BIPOC design
indicate this in equation 1 by adding “_noPH” to the signifier at partners; in fact, 74% of our design partners were white. We did
the left of the equation. reach our goal of finding a group of design partners with life
experiences related to LGBTQ+ identification (24%), disabilities
Qualitative Analyses (26%), incarceration (8.3%), military service (4.2%), and adverse
We used a thematic analysis approach. Coding and theme childhood events (64%).
extraction was performed by two experienced researchers skilled
in assessing qualitative data, but of course bias will be present in Unpaid (Optional) Engagements
terms of which ideas, feedback, and experiences are reported as During the 10 days following the required task days, 86 of our
examples, and how codes and themes are selected. To mitigate 96 design partners (90%) chose to engage with Time Machine
the impact of this bias, where possible, any quantitative results during this unpaid optional period of the study. For those who
obtained from the qualitative feedback survey are also provided chose to engage with the technology, the mean number of days
in table form. Further, all raw data are available on request. of engagement was 5.8 days. Two early participants engaged in
the recording task during the optional period for longer than
10 days (11 and 14 days) before we realized there was a bug in the
RESULTS software that did not let them know the optional period was over;
we included their data in all analyses regardless of this deviation
COVID Pivot from the study plan.
Our original plan was to facilitate 10 in-person focus groups
across the United States and Canada throughout 2020, integrate Experimental Wellness Sliders
feedback from those groups into iterative designs, and create We examined responses to the experimental wellness sliders
a blueprint for developers to write software. To find our (Figure 2) registered within the app during the two 5-day
design partners, we reached out to 26 clinicians working with required task periods and their relationship to other study
populations at the intersection of addiction, abuse, incarceration, variables. First, we found increases in measures of physical and
poverty and trauma across the United States and Canada, spiritual wellness over time; significant self-reported increases
including leaders in the Latino Social Workers Organization occurred only during the first 5-day period (Figures 3A,B; 1st
and the National Association of Black Social Workers. Our 5 days: physical: t 95 = 2.07, p < 0.045, d = 0.21; emotional:
intention was to schedule in-person paid focus groups with their t 95 = 1.60, p < 0.113, d = 0.16; spiritual: t 95 = 3.38, p < 0.002,
populations; 13 of these mental health professionals showed d = 0.35; 2nd 5 days: all p-values > 0.30). As these were not our
sustained interest. planned analyses, we performed Bonferroni correction on these
However, soon travel and physical proximity restrictions results, after which only the data from the spiritual wellness slider
imposed by COVID-19 resulted in a need to pivot our plans. We can be considered significant (cutoff = p < 0.008). Thus it appears
moved most of our participant recruitment online to an online that measures of whatever design partners defined as spiritual
work provider allowing pre-screening for desired demographics. health increased over the course of the first 5 required task days.
We streamlined our approach and conducted a beta-test online Note that the mean test-retest reliability of the spiritual wellbeing
focus group with unpaid beta testers and seven formal online slider was moderate-to-good: 0.48 over the first five days, and 0.41
focus groups. These focus groups introduced participants to over the second five days.
the study and the motivations behind it. As a result of this Because we were using these sliders to solicit responses for the
change we were able to reach vulnerable populations with a first time, we were curious whether the data reported using these
potentially useful intervention and also provide extra income sliders would correlate with data from the dependent variables
(up to $180 for full participation, see “Materials and Methods”). assessed with the recurring assessments, as a way of validating
We refer to the participants who completed the 26-day study as the sliders. To perform these correlations, we first considered
design partners, because their feedback helped us iterate Time which day or days would be appropriate to compare – especially
Machine’s design. given that questions on the recurring assessments asked design
partners to consider the most recent 3 days (including the survey
Design Partner Demographics day) in their responses, while the sliders asked only about the
By March 3, 2021, of 104 design partners enrolled, 97 design current day. Because of this consideration, we determined that
partners completed the study and were paid the full amount the average scores on the last 2 days of slider responses would be
Frontiers in Psychology | www.frontiersin.org 7 November 2021 | Volume 12 | Article 744209Mossbridge et al. Smartphone Time Machine TABLE 1 | Demographics for the 96 design partners in the study. Self-reported race/ethnicity Total Women LGBTQ+ Disabilities Incarceration Served in United States military ACES score 2+ Asian 3 1 1 0 0 0 3 Native American/ White 2 2 0 1 0 0 2 Black 9 4 2 0 0 0 5 Black/LatinX 3 0 0 1 0 0 1 LatinX 4 3 1 2 0 1 2 Mixed 2 0 0 1 1 0 2 South Asian 2 0 0 1 0 0 2 White 71 50 19 19 7 3 44 Total 96 60 23 25 8 4 61 Note that the questions on the demographic survey that asked about race/ethnicity and gender provided an open text field for responses, so individuals could self-identify. Zero individuals self-described as non-binary or transgender, but it is possible that some of those who self-identified as women or men are also other genders. FIGURE 3 | Mean values of wellbeing measures at all measurement times (N = 96). “Better” label indicates the area of the plots indicating improvement (higher or lower values, depending on measure). (A) Mean responses from experimental within-app wellness checks (1 = worst, 10 = best) for the first five task days. (B) Same as (A), but for the second five task days. (C) Mean distance from balanced time perspective (dBTP) on each of the four recurring assessments. (D) Mean proportion of the total scale used for the unconditional love (violet circles), overall wellbeing (blue squares), and physical symptoms of stress (pink triangle) measures. Lighter colors are used so small error bars inside the symbols can be seen. Also note that the day 25 value for unconditional love is the same as the overall wellbeing value (also see Table 2), so one symbol occludes the other. Error bars in each figure represent +/- 1 standard error of the mean (S.E.M), calculated within participants. For first-vs.-last measure comparison statistics (paired t-tests), *p < 0.05; ***p < 0.0001. most appropriate to compare to the responses on the recurring Overall, many of these correlations were significant, and a assessments. Thus we used Pearson correlations to compare clear pattern emerged indicating that design partners were, for the average of each slider’s responses for the 2 days prior to the most part, giving the three sliders equivalent meanings recurring assessment 2 (given on study day 8) and recurring (Table 2). Averages of the two slider responses prior to the assessment 3 (given on study day 14) with the four dependent recurring assessments were significantly negatively correlated variables calculated from recurring assessment responses on with dBTP and physical symptoms of stress scores on the study days 8 and 14. recurring assessments. Correlations between slider responses Frontiers in Psychology | www.frontiersin.org 8 November 2021 | Volume 12 | Article 744209
Mossbridge et al.                                                                                                                     Smartphone Time Machine

and overall wellbeing were strong and positive, with a slight                           on each of the four dependent variables, generally favoring
shift toward a higher correlation with emotional wellbeing                              the recording-first group in partial support of Hypothesis 2
for data from the third repeated assessment. Interestingly,                             (Figures 4A–D and Table 3B). Note that we did not combine
the odd dependent variable out was the unconditional love                               data across groups for each of the required tasks because of
variable – there were no significant correlations between average                       the clear indication, discussed above, that the first 5 days
responses on any of the three sliders and repeated assessment                           showed the most improvement in most measures regardless of
measures of unconditional love. The lack of correlations between                        the nature of the task. The improvements in time perspective
reported feelings of unconditional love and responses on the                            from the first to last assessment were significantly larger in the
three sliders suggests that design partners did not feel that the                       recording-first versus the quote-first group (day 25 minus day
unconditional love measure had any consistent relationship to                           2: t 94 = 2.46, p < 0.016, d = 0.51), as predicted. Overall, the
physical, emotional, or spiritual wellness; thus the feelings of                        recording-first group significantly improved on the dBTP first-
unconditional love questions on the repeated assessments seem                           to-last measure from the first to the last assessment, while the
to address a unique variable. Further, it appears that responses on                     quote-first group did not (day 2 to day 25: recording-first group
the three sliders were for the most part consistently tied to time                      t 51 = 4.78, p < 0.0001, d = 0.66; quote-first group p > 0.231;
perspective, physical symptoms of stress, and overall wellbeing.                        Figure 4A). Meanwhile, the physical symptoms of stress measure
These results also indicate that design partners were relatively                        was quantitatively lower for the recording-first group throughout
intentional in their responses both within (sliders) and outside                        the study. Because on day 2 participants were told which group
of (recurring assessments) the Time Machine technology.                                 they were to be placed in prior to taking the survey, it is possible
                                                                                        that this influenced some participants in the quote-first group
Pre-planned Hypothesis Tests on                                                         to be particularly aware of their physical symptoms of stress in
Dependent Variables                                                                     response to not being able to perform the time-travel process
All four dependent variables evidenced significant improvement                          first. While there was no significant difference in improvement
from the initial (day 2) to final (day 25) values (Table 3A and                         on the physical symptoms of stress measure between the
Figures 3C,D), supporting Hypothesis 1 (Methods). The most                              groups (p > 0.75), both groups improved significantly, showing
impressive results were a 12% improvement in the measure of                             reductions in physical symptoms of stress from first-to-last
overall wellbeing from the first to last assessment, and a near                         assessment (recording-first group t 51 = 3.15, p < 0.003, d = 0.44;
10% drop in the measure of physical symptoms of stress during                           quote-first group t 43 = 3.63, p < 0.0008, d = 0.55; Figure 4B).
the same time period. For all four dependent variables, the most                        Improvements in feelings of unconditional love from pre-to-post
quantitative improvement in mean values occurred between the                            assessment were not significantly different between the groups
first and second assessments, although for the physical symptoms                        either (p > 0.15). Nevertheless, the recording-first group showed
of stress measure, the improvements at the beginning and end                            quantitatively greater improvement while improvement in the
of the study were roughly equivalent (improvement of 0.385                              quote-first group was only borderline significant (recording-
from the first to second assessment, and 0.376 from the third                           first improvement = 1.29, t 51 = 3.67, p < 0.0006, d = 0.49;
to last assessment), hinting at a potentially different mechanism                       quote-first improvement = 0.59, t 43 = 1.96, p < 0.057, d = 0.29;
underlying changes in scores on this measure.                                           Figure 4C). Finally, the overall wellbeing measure was also
    Examining the same data split according to task order (group)                       not significantly different between groups (p > 0.31). Both
provides evidence that the order of the tasks had some influence                        groups improved significantly on the overall wellbeing measure
                                                                                        between the first and last assessments (recording-first group
                                                                                        t 51 = 5.34, p < 0.0001, d = 0.71; quote-first group t 43 = 3.40,
TABLE 2 | R values for Pearson correlations between slider responses (average of        p < 0.002, d = 0.51; Figure 4D). Critically, participants were
the 2 days of responses prior to repeated assessments) vs. dependent variables          not assigned by the experimenters to a particular task order,
on repeated assessments 2 and 3.
                                                                                        but were instead randomly assigned by the software and there
Measure                           vs. physical   vs. emotional    vs. spiritual         were no significant differences between the groups on any
                                                                                        dependent variable on the initial assessment or ACES scores (all
dBTP                                                                                    ps > 0.070). Overall, these results suggest that recording-first
day 8/RA2                            −0.255         −0.301           −0.210
day 14/RA3                           −0.308         −0.371           −0.337
                                                                                        participants had a slight advantage in that their improvements
PSS
                                                                                        were more impressive than the improvements of quote-first
day 8/RA2                            −0.392         −0.351           −0.327             participants. Particularly for dBTP and feelings of unconditional
day 14/RA3                           −0.351         −0.233           −0.260             love significant improvements from the first to last assessments
UL                                                                                      were absent or borderline for the quote-first group, while
day 8/RA2                             0.139          0.129            0.157             they were robust for the recording-first group. However, these
day 14/RA3                            0.110          0.176            0.135
                                                                                        results can only be seen as partial support for Hypothesis 2,
Overall
day 8/RA2                             0.617          0.596            0.561
                                                                                        which asserted that all dependent variables would show more
day 14/RA3                            0.517          0.575            0.534             improvement amongst participants in the recording-first group.
                                                                                            Because all of our data were based on some type of self-
RA, repeated assessment; dBTP, distance from balanced time perspective; PSS,
physical symptoms of stress; UL, feelings of unconditional love; overall, overall       report, we were especially interested in whether the number
wellbeing. Bolded values are significant.                                               of reported adverse childhood experiences on the ACES survey

Frontiers in Psychology | www.frontiersin.org                                       9                                 November 2021 | Volume 12 | Article 744209
Mossbridge et al. Smartphone Time Machine
TABLE 3 | Mean (SD) values for each of the raw dependent variables on all four assessments as well as statistics for paired t-tests comparing values on first and last
assessments within participants.
Measure Day 2 Day 8 Day 14 Day 25 First-to-last change t p
RA 1 RA 2 RA 3 RA 4 RA 4 – RA 1
(A) Data from 96 participants taken together.
dBTP 3.43 (1.04) 3.17 (1.02) 3.04 (0.99) 3.06 (1.10) −0.37 (0.85) t95 = 4.29Mossbridge et al. Smartphone Time Machine
FIGURE 4 | Mean values of all four dependent variables split according to task order (darker symbols = recording-first group; lighter symbols = quote-first group).
(A) Mean distance from balanced time perspective (dBTP) on each of the four recurring assessments. (B) Mean proportion of the total scale used for the physical
symptoms of stress measure, (C) the unconditional love measure, and (D) the overall wellbeing measure. Error bars in each figure represent +/- 1 S.E.M, calculated
across participants. For first-vs.-last measure comparison statistics (paired t-tests), *p < 0.05; **p < 0.01; ***p < 0.0001.
in support of Hypothesis 3. In our most striking quantitative relate to greater improvement in all dependent variables, we
result, this difference disappeared during the study period, with examined the relationships between three independent variables
both groups sharing very similar mean scores on the overall and changes in our dependent variables. To this end, we
wellbeing measure on the day of the final recurring assessment, performed linear regressions on differences calculated between
such that design partners with lower ACES improved significantly the first and last repeated assessment day for each dependent
less (half as much on average) on their overall wellbeing scores variable as predicted by all three independent variables (ACES
than design partners with higher ACES (t 94 = 2.23, p < 0.028, score, group, number of optional logins). These four multiple
d = 0.46). While both groups showed significant improvement linear regressions yielded significant results for the dBTP and
on the overall wellbeing measure (higher ACES: t 44 = 6.36, overall wellbeing measures only (Table 4). In the reduced models,
p < 0.001, d = 0.95; lower ACES: t 50 = 2.94, p < 0.005, d = 0.41), improvement in dBTP (i.e., a reduction in value) was positively
those with higher ACES reported a 16% improvement on the predicted by inclusion in the recording-first group and a greater
overall wellbeing measure over the course of the study, the number of optional logins, while the improvement in overall
largest change we recorded. There were no significant differences wellbeing was positively predicted by those same independent
in improvement for any other dependent variable. Thus the variables as well as a higher ACES score. The number of
results from the time perspective and overall wellbeing measures optional logins was included in both reduced models, providing
support Hypothesis 3, while the results from the overall wellbeing additional evidence that the recording and wellness check tasks
measure provide strong evidence against Hypothesis 4 – which available in the optional period of the study influenced both time
was that individuals with lower ACES scores would report greater perspective and wellbeing scores positively. Thus these results
improvement on all four dependent variables. In addition to partially support Hypothesis 5, at least for improvements in time
addressing our hypotheses, the varying patterns of these results perspective and the overall wellbeing measure.
support two additional ideas: (1) our design partners were for
the most part accurately recording their experiences, and (2)
something about the study improved all four dependent variables
for individuals with both lower and higher ACES scores, with Post-hoc Analyses of Dependent
striking improvement on the overall wellbeing measure for those Variables
with lower ACES scores. The pre-planned tests of our five hypotheses revealed a
To investigate Hypothesis 5, which predicted that greater pattern of results that warranted further examination. Because
use of the technology during the study period would positively improvements in time perspective and scores on the overall
Frontiers in Psychology | www.frontiersin.org 11 November 2021 | Volume 12 | Article 744209Mossbridge et al. Smartphone Time Machine FIGURE 5 | Mean values of all four dependent variables split according to median split on ACES inventory score (darker symbols = ACES score ≥ 3; lighter symbols = ACES score < 3). (A) Mean distance from balanced time perspective (dBTP) on each of the four recurring assessments. (B) Mean proportion of the total scale used for the physical symptoms of stress measure, (C) the unconditional love measure, and (D) the overall wellbeing measure. Error bars in each figure represent +/- 1 S.E.M. calculated across participants. For first-vs.-last measure comparison statistics (paired t-tests), *p < 0.05; **p < 0.01; ***p < 0.0001. wellbeing measure were the only dependent variables that were [UL3-1], optional logins, and their interaction: adj. R2 = 0.098, related to the use of the technology during the non-required p < 0.004 for overall wellbeing change; adj. R2 = 0.075, p < 0.01 period, we first focused on determining whether changes in the for dBPT change; moderation by number of optional logins: other dependent variables occurring during the required portion p < 0.04 for overall wellbeing change; p > 0.10 for dBPT change). of the study would predict first-to-last changes in dBTP and These results suggest that changes in unconditional love in the the overall wellbeing measure. Thus we used as predictors the required portion of the study predict study-long changes in both difference between scores on days 14 and 2 (i.e., day 14 minus dBTP and overall wellbeing scores, and for overall wellbeing day 2) for the physical symptoms of stress and unconditional this relationship was stronger for individuals who logged in love measures. Full models for each were significant (dBTP: more often during the optional period. While this result lends adj. R2 = 0.051, p < 0.04; overall wellbeing: adj. R2 = 0.058, validity to both the overall wellbeing measure as well as the p < 0.03). Reduced models only included a single factor – value of the recording task performed during the optional period, changes in feelings of unconditional love. In both cases increases it is worth noting that there is no implied causality with any in unconditional love were predictive of improvement in both moderation effect. dBTP (i.e., reduction in dBTP; adj. R2 = 0.060, p < 0.01) and To examine potentially causal relationships between the the overall wellbeing measure (i.e., increase in overall wellbeing three apparently related dependent variables – feelings of scores; adj. R2 = 0.063, p < 0.008). If the relationships between unconditional love, dBTP and overall wellbeing scores – we changes in feelings of unconditional love and both dependent performed four mediation analyses. For each, overall wellbeing variables were moderated by the number of optional logins on the fourth assessment (day 25) was the dependent variable, the between the third and fourth repeated assessments, this would be unconditional love score on the third repeated assessment (day a further indication that the tasks performed during the optional 14) was the mediator, and the treatment was either the physical logins (recording/listening to messages and performing wellness symptom of stress (PSS) score or the dBTP score calculated from checks) were related to improvements in time perspective and the third or second repeated assessments (both the dBTP and PSS overall wellbeing scores. In fact, moderation analyses indicated factors from a given assessment time were included in the model, that increases in overall wellbeing scores were significantly but only one was the treatment in each of the mediation analyses). positively moderated by the number of optional logins, while Scores on given days were selected instead of change scores decreases in dBTP values were not moderated by the same because for mediation analysis to suggest a causal relationship, (model included unconditional love score day 3 minus day 1 the treatment and the mediator should be measured prior to Frontiers in Psychology | www.frontiersin.org 12 November 2021 | Volume 12 | Article 744209
Mossbridge et al. Smartphone Time Machine
TABLE 4 | Results from multiple linear regressions predicting changes (RA4 value the treatment factor the dBTP measure on the first recurring
minus RA1 value) in the four dependent variables.
assessment. We found the mediation was not present (ACME
dBTP change PSS change UL change overall p > 0.311), even though dBTP on the first assessment strongly
change predicted the final overall wellbeing score (adj. R2 = 0.078,
p < 0.004). Thus these results support the idea that the mediation
Full model adj. R2 = 0.084 adj. R2 = −0.021 adj. R2 = 0.01 adj.
effect was driven by changes in the relationship between dBTP,
p < 0.012 p > 0.800 p > 0.274 R2 = 0.108
p < 0.004 unconditional love, and overall wellbeing scores that occurred
ACES 0.106 during the time of the study. Overall, these mediation analyses
score results point to a causal relationship in which unconditional
Group −0.464 0.251 love feelings apparently influenced the relationship between time
Optional −0.050 0.051 perspective and overall wellbeing scores.
logins
Reduced adj. R2 = 0.085 same as full
model p < 0.006 model Qualitative Findings
Predictors are independent variables (across top). RA, repeated assessment; dBTP, Inclusive Design Process
distance from balanced time perspective; PSS, physical symptoms of stress; UL, In our unique study design, we held the study and technology
feelings of unconditional love; overall, overall wellbeing. Bold adjusted R2 values
indicate significance. Estimates for each participating factor in the reduced model
features described above (Methods) constant while we
are shown, bolded estimates indicate independent significance for the given factor. incorporated aesthetic enhancements requested by our design
Rows marked “reduced model” give results for the reduced model as a whole, partners. We based these enhancements on early feedback from
where the full model was significant. Shaded cells indicate the factor was not attendees at an unpaid focus group as well as feedback from paid
included in the reduced model because the adjusted R2 improved when the given
factor was removed, or that a reduced model was not created due to insignificance focus group participants who met within the first month of the
of the full model. Note that group was coded as 0 (for quote-first group) and 1 study (September 2020). As a result of this early feedback, we
(for recording-first group), so a positive estimate indicates that higher values of the altered the software to include: a recording playback button (due
dependent variable were correlated with the recording-first group. Also note that for
dBTP and PSS, negative changes between RA1 and RA4 indicated improvement,
to background noise and privacy issues, many design partners
while the reverse is true for UL and overall change measures. were whispering and wanted to make sure their recordings were
audible; added after 34 participants had started), the ability to
cancel recordings (in case they wanted to re-think their message;
the outcome variable, and change scores required measurement added after 34 participants had started), a countdown timer for
on the first assessment day (day 2). Unconditional love was recordings (so they could time their recording to the 1-min limit;
selected as the mediating variable because it showed a clear added after 34 participants had started), better daily notifications
relationship with overall wellbeing scores (see above), and prior (some were not being received; added after 46 participants had
research indicated that self-transcendent emotions can mediate started), a study-day tracker to remind people where they were in
wellbeing (Vieten et al., 2014). Starting with scores on the third the study (so they knew when each study stage would start/end;
assessment (following the required portion of the study), there added after 46 participants had started), and a table showing
was no mediation by the unconditional love measure for the previous “wellness check” responses (because design partners
model with physical symptoms of stress measure as the treatment wanted to track their changes in wellness over time; added after
(average causal mediation effect [ACME] p > 0.929 for PSS on 46 participants had started). While none of these enhancements
third assessment), but for the model with the dBTP measure impacted whether design partners could perform the study tasks,
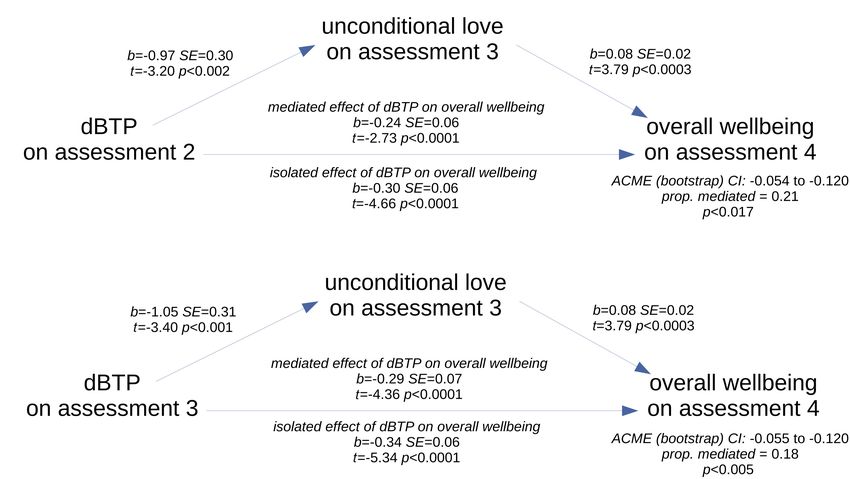
as the treatment, there was significant partial mediation by the we do think they enhanced the technology and also reminded our
unconditional love measure (ACME 95% CI −0.055, −0.120; design partners of their role as key team members in improving
p < 0.005, est. prop. mediated 0.182). Note that the negative the technology. The impact of this engagement is not to be
value for the ACME arose because lower values of dBTP (more underestimated as a potential factor in the overall results (see
balanced time perspective) on the third assessment (day 14) section “Discussion”).
positively predicted both greater feelings of unconditional love This level of engagement seemed to be contagious. For
on the third assessment as well as greater overall wellbeing scores example, one Turker, known for organizing other Turkers, went
on the final assessment (day 25), while the unconditional love out of their way to recruit others for this study because they
measure positively predicted scores on the wellbeing measure were so impressed by their own experience in it. Further, three
(Figure 6A). Further, the same was true for dBTP on the second sets of Turkers requested unscheduled and impromptu focus
recurring assessment (Figure 6B; ACME 95% CI −0.054, −0.120; groups following the close of their paid participation. When
p < 0.017, est. prop. mediated 0.207), but note that this result does they were told they would not be paid for these groups and
not pass Bonferroni correction (Bonferroni cutoff = p < 0.0125). we could not report their feedback from these groups in any
When physical symptoms of stress on the second assessment was scholarly paper, the Turkers still wished to connect via Zoom.
the treatment, no mediation was present (ACME p > 0.963). Some of them chose to show their faces and share their voices.
Finally, to determine whether the unconditional love They offered helpful feedback that we are using to shape the next
mediation effect was driven by changes related to the study rather stage of the technology. However, the most exciting outcome of
than any pre-existing relationship between time perspective and those impromptu focus groups is that the design partners who
overall wellbeing, we examined this same mediation using as organized them asked if they could continue to use the technology
Frontiers in Psychology | www.frontiersin.org 13 November 2021 | Volume 12 | Article 744209You can also read