SOUTHEAST STRATEGIC TRANSPORTATION VISION - BALTIMORE CITY, MD - August 2016
←
→
Page content transcription
If your browser does not render page correctly, please read the page content below
S O U T H E A S T S T R AT E G I C
T R A N S P O RTAT I O N V I S I O N
B A LT I M O R E C I T Y , M D

     August 2016

     Prepared by:

     7055 Samuel Morse Dr., Ste. 100, Columbia, MD 21046 | 443-741-3500 | sabra-wang .com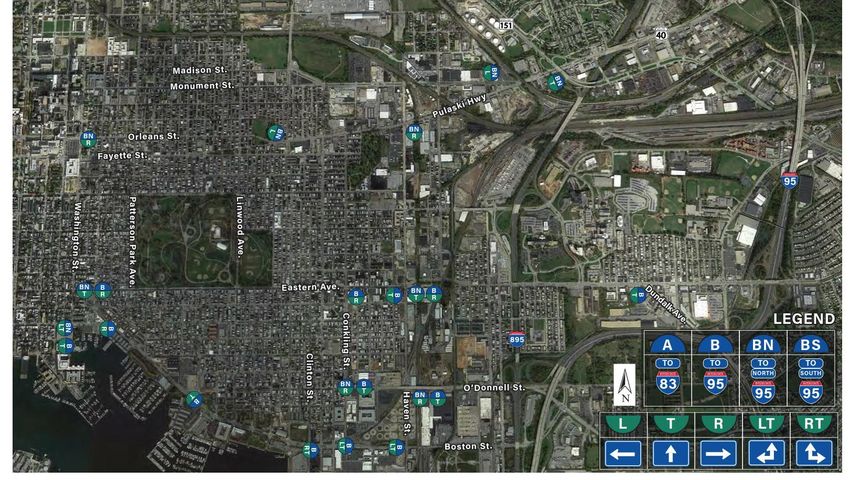
Southeast Strategic Transportation Vision

Table of Contents
I.         Executive Summary ............................................................................................................................... 4
II.        Study Area ............................................................................................................................................. 6
III.              Previous Studies and Improvements ................................................................................................ 9
IV.               2007-2015 Infrastructure Investments ............................................................................................. 9
V.         Economic Development Activity/ Land Use Forecasts (2015-2020) ................................................... 11
VI.               Existing Transportation Network .................................................................................................... 14
      a.          Walking Network ............................................................................................................................ 14
      b.          Biking Network ................................................................................................................................ 14
      c.          Transit Network .............................................................................................................................. 14
      D.          Roadway Network (Passenger Cars and Trucks) ............................................................................. 18
           i.        Roadway Capacity Analysis ......................................................................................................... 18
           ii.       Volume-to-Capacity Ratio ........................................................................................................... 18
           iii.      Summary ..................................................................................................................................... 18
VII.              Future Traffic Forecasts .................................................................................................................. 23
      A.          Trip Generation ............................................................................................................................... 23
      b.          Mode Choice ................................................................................................................................... 23
VIII.             Findings and Multi-Modal Mobility Strategy .................................................................................. 28
      A.          Walking Network ............................................................................................................................ 28
      B.          Biking Network ................................................................................................................................ 29
      C.          Transit Network .............................................................................................................................. 32
      D.          Roadway Network ........................................................................................................................... 37
      E.          Traffic Management........................................................................................................................ 38
IX.               Cost Estimates ................................................................................................................................. 40
X.         Recommendations and Priority Projects ............................................................................................ 41
      a.          Operations: ..................................................................................................................................... 41
      b.          Capacity:.......................................................................................................................................... 42
      c.          Mode Shift:...................................................................................................................................... 43
XI.               Addendum A: Projects under planning, design and implementation FY17 through FY19 ............. 44

                                                                                                                                                                      1
Southeast Strategic Transportation Vision

List of Figures
Figure 1: Study Area ………………………………………………………………………………………………………………………………7

Figure 2: City Legislative Districts …………………………………………………………………………………………………………..8

Figure 3: Distribution of Planned Developments …………………………………………………………………………………11

Figure 4: Forecasted Economic Development Activity Locations ………………………………………………………….13

Figure 5: Southeast Baltimore Bicycle Network (2015) …………………………………………………………………………15

Figure 6: City Operated Transit Services (2016) ……………………………………………………………………………..…….16

Figure 7: State Operated (MTA) Transit Services – Bus and Metro (2016) ……………………………………………17

Figure 8: Study Intersections ………………………………………………………………………………………………………………..19

Figure 9: Designated Truck Routes …………………………………………………………………………………………….………..20

Figure 10: Existing AM and PM Peak Hour Intersection Level of Service ……………………………………………...21

Figure 11: 3-D Visualization of trip Generation Across Southeast Plan Study Area ………………………………25

Figure 12: Proposed Bicycle Facility Improvements …………………………………………………………………………….31

Figure 13: Recommended Water Transit Improvements …………………………………………………………………….33

Figure 14. Recommended Priority Bus Corridors ………………………………………………………………………………..36

                                                                                              2
Southeast Strategic Transportation Vision

List of Tables
Table: 1: Current Summary of Development Activity in Southeast Zone ……………………………………………..12

Table 2: Summary of Existing Intersection Capacity Analysis ……………………………………………………….………22

Table 3: Forecast of trips Generated by Currently Planned and Under Construction/Occupancy
Developments …………………………………………………………………………………………………………………………………….26

Table 4: Planning Level Cost Estimate for Mitigation Strategies ………………………………………………………….40

                                                                                             3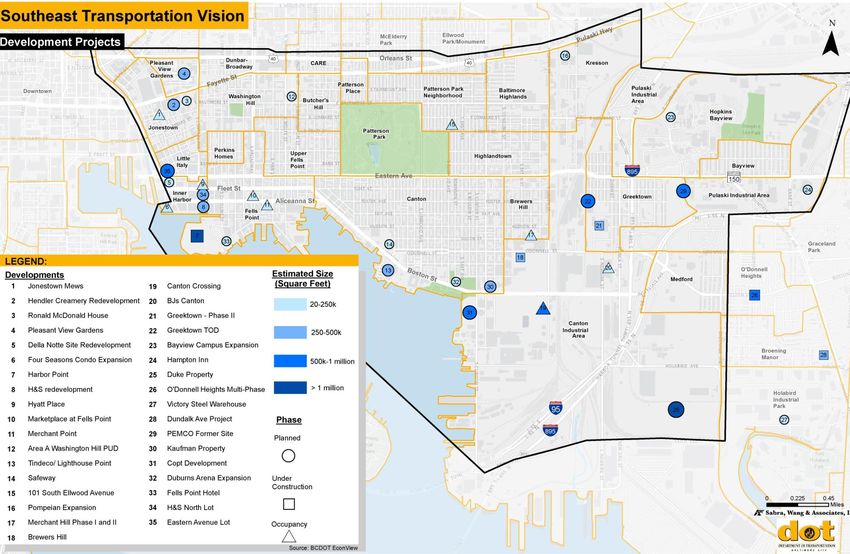
Southeast Strategic Transportation Vision

    I.       Executive Summary
Under the current Transportation Impact Study legislation (11-529), the Baltimore City Department of
Transportation (DOT) requires the development of a strategic plan for each of the identified mitigation
zones to guide investment of development fees over the next five years (2015-2020). This study focuses
on the Southeast Zone. The purpose of this report is to:

    1. Summarize previous studies in the Southeast Zone.
    2. Summarize improvements to the transportation network.
    3. Identify economic development activity through expected land use changes, including new and
       redevelopment, development programs, densities, mix of uses and timelines.
    4. Document existing transportation network conditions, specifically intersection vehicle level of
       service.
    5. Project new multi-modal travel demands generated by land use changes, including vehicle trips,
       as well as walking, bicycle and transit trips.
    6. Develop holistic and integrated recommendations to improve all modes of travel, and identify
       specific corridors for selecting final alternatives and implementation.

Since the first Southeast Transportation Plan in 2007, the City has invested over $15 million and
completed over a dozen transportation improvements to alleviate projected worsened congestion
throughout the study area.

While the 2008-2012 economic downturn slowed some of the market absorption of the 2007 report
development projections, the current development forecasts remain robust in the Southeast Zone. The
City’s Econ View1 identifies over 35 individual development projects in various planning, permitting,
construction or occupancy stages, identifying 12.5 million square feet of new development, and
potentially yielding over 20,000 new vehicles to roadways in the Southeast Zone during rush hour.

Several corridors in the study area are currently experiencing severe traffic congestion during rush hour
(e.g. multiple failing intersections), including: S. and N. President Street, Eastern Avenue, Boston Street,
S. and N. Central Avenue, E. Fayette Street, Fleet Street, S. and N. Washington Street, Broening Highway,
Holabird Avenue and Aliceanna Street.

The existing roadway network as currently configured will not be able to fully accommodate future
development-generated vehicle traffic volumes. Although the Southeast Zone provides an extensive
walking, biking and transit network, including bus, rail, and water transit more improvements are
needed to fully leverage non-single occupancy vehicle modes.

The study initially included an assumption for the completion of the Red Line Light Rail project, and
developed a set of recommendations focusing on station area access improvements for all modes of

1
  Econ View is Baltimore City’s interactive mapping tool, developed to display real estate development and public
investment across the city.

                                                                                                                    4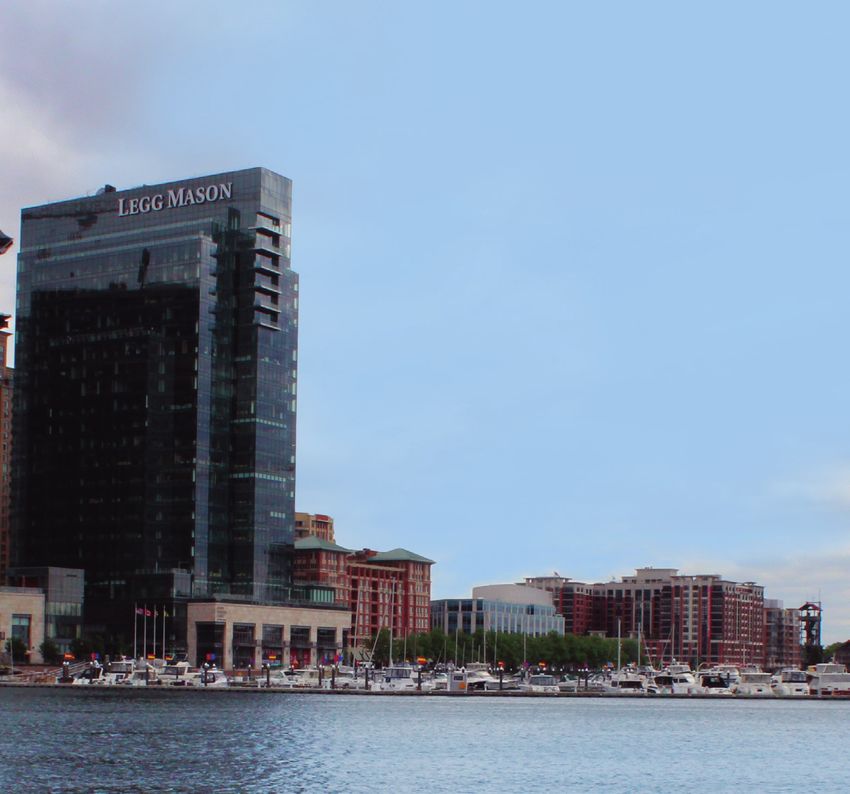
Southeast Strategic Transportation Vision
travel in order to maximize the City and State investment in the Red Line. The Red Line would have
provided high quality transit connectivity for residents and employees in the Southeast Zone to city and
regional destinations. The study was distributed to the public for review the day prior to the
announcement cancelling the MTA Red Line project in June 2015. The study was revised to remove the
Red Line project benefits, and related station area access improvement recommendations, replacing the
Light Rail project with a holistic set of transit priority corridor alignments and priority operational and
physical treatments to maximize City, State and private transit service reliability. The final report
acknowledges the recent announcement of the MTA’s BaltimoreLink local bus improvement plan that
may have impacts to the current local bus service operating in the Southeast Zone. Because the MTA
BaltimoreLinks plan does not provide specific route and service plans for the southeast until full
implementation in June 2017, the Southeast Strategic Transportation Vision Report is being released
without analysis of MTA BaltimoreLink. Baltimore City Department of Transportation is committed to
coordinating with MTA BaltimoreLink, and will advocate for transit routing and service levels to meet
the transportation goals and needs of the residents and employers in southeast Baltimore. DOT does
not support transit routing on Baltimore Street and N. Milton Street.
Recommendations developed in this report include: targeted capacity enhancements for walking, biking,
transit, passenger vehicles and freight; traffic operations strategies to better manage traffic flow;
improved inter-modal connections and policy initiatives to increase the existing and future travel share
by modes other than private passenger vehicle. By investing in these strategies, the City will be able to
better manage traffic in the Southeast Mitigation Zone, while attracting new residents, visitors and
workers, and provide seamless and reliable travel options that do not depend on owning a car.
These high level strategies to include:
Improving street network connectivity through new links including the S. Central Avenue bridge
extension, Brewer’s Hill north-south connecter (Boh-Donnell) and Boston Street-Broening
Highway Connector (S. Eaton Street Extension)
Employing traffic management strategies including curbside management, signal timing, and
deployment of Traffic Enforcement Officers
Establishing short, circulating transit routes with State partners (MTA) and private partners
Establishing Bus Transit Priority Corridors through transit signal timing priority, queue jumps,
limited stop service, and off-board fare payment along key corridors
Expanding the bicycle network through protected lane treatments, and other infrastructure
treatments
Establishing transportation hubs in Harbor East, Highlandtown and Canton where improved bus,
water transit, bicycle and park and ride connections could be established
Establishing one or more formal Transportation Management Association(s) to facilitate
employer/ employee programs and incentives, including ride shares, bike shares, subsidized
transit passes, park and ride shuttles, and guaranteed ride home
Deploying ITS technologies to improve communication response time and incident management
5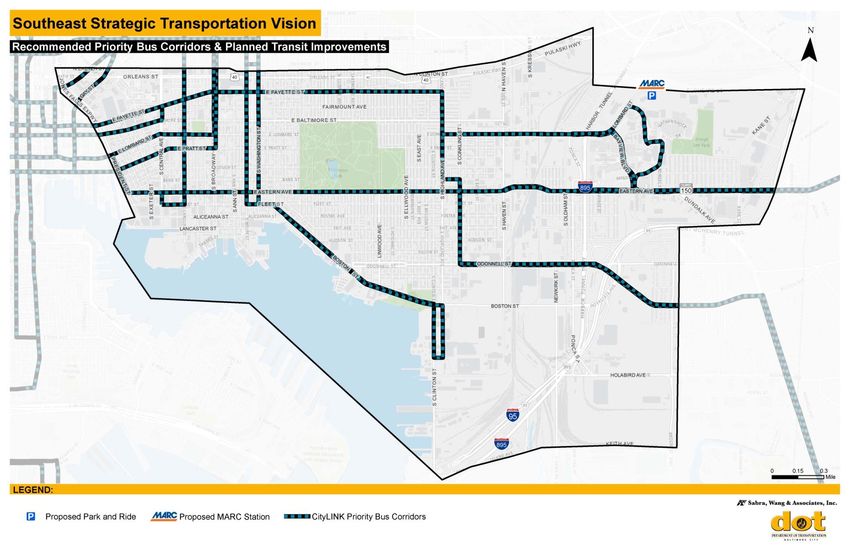
Southeast Strategic Transportation Vision

    II.     Study Area
The Southeast Zone in Baltimore City is geographically defined through the Traffic Mitigation Legislation
and is bounded by Orleans Street/Pulaski Highway/E. Lombard Street to the north, S. and N. President
Street/I-83 to the west, Broening Highway/I-95 to the east, and Keith Avenue to the south. The study
area is shown in Figure 1 and the City legislative Districts are shown in Figure 2. Council District 1 is
primarily represented in this study area, along with portions of Council Districts 2, 12 and 13. There are
also numerous state legislative wards in the study area, which are represented by 5 State legislators.

The Southeast Zone is a broad area lying directly east of Baltimore’s downtown and Inner Harbor that
houses a mix of commercial, residential, institutional, and industrial development. The area closest to
the Inner Harbor, commonly referred to as Harbor East, has experienced a boom in new development in
recent years. Commercial uses – office, hotel and retail – dominate the landscape in this area. Dense
residential development is also prevalent further east and north of the waterfront, including the
neighborhoods of Little Italy, Fells Point, Canton, Butchers Hill, Brewers Hill, and Greektown. The
northeastern end of the study area is comprised mostly of the Johns Hopkins Bayview Medical Center,
and commercial and industrial uses. The southeastern end of the study area is primarily industrial and
warehousing, as the Port of Baltimore is located immediately outside the study area.

                                                                                                        6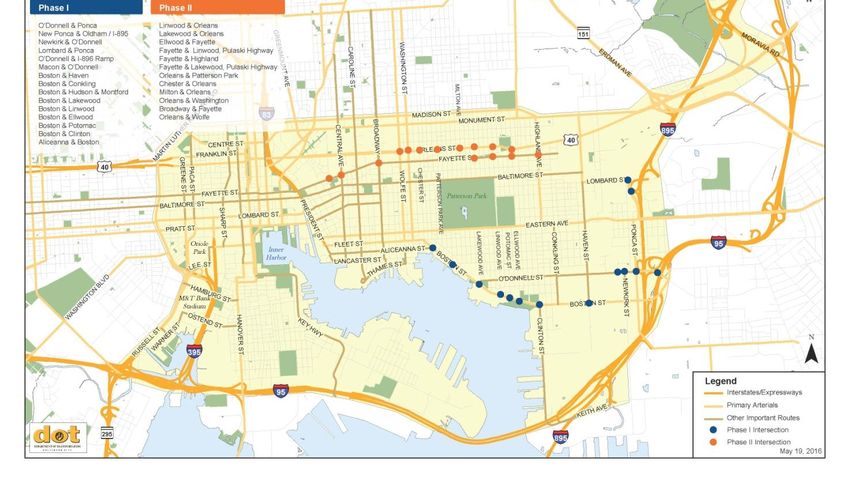
Southeast Strategic Transportation Vision

Figure 1. Study Area

                                            7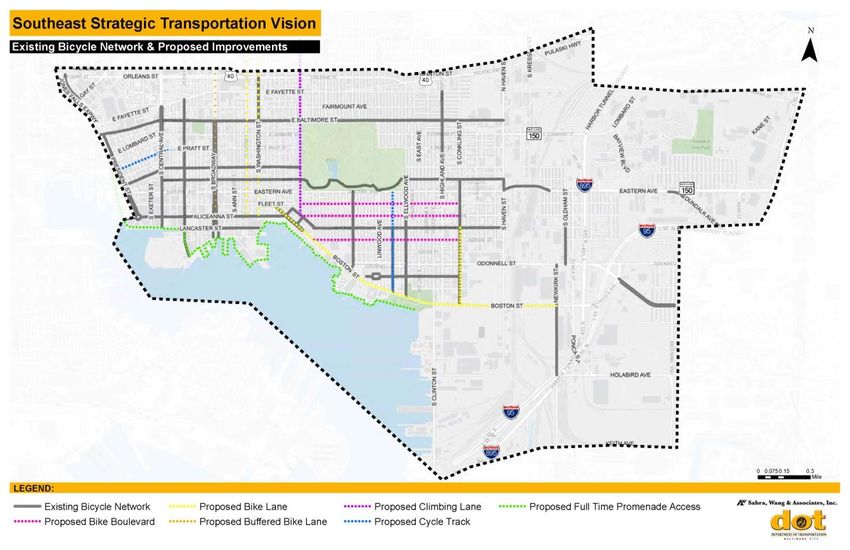
Southeast Strategic Transportation Vision

Figure 2. City Legislative Districts

                                            8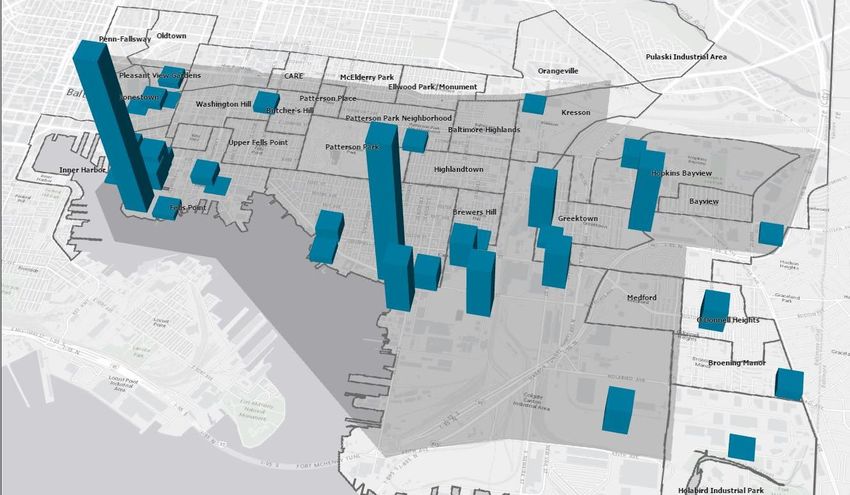
Southeast Strategic Transportation Vision

   III.    Previous Studies and Improvements
Over the past nine years, numerous transportation studies have been completed by DOT in the Southeast
Zone. These include the following:

   1) Southeast Transportation Study, 2007:            This study evaluated projected development in
      Southeast, existing traffic conditions, future projected vehicle trips and an assessment of the
      ability of the roadway network to accommodate new development. The study also identified
      multi-modal transportation improvements to enhance capacity and provide improved mobility.
   2) Brewers Hill PUD Traffic Impact Study, 2008: This Traffic Impact Study included existing
      conditions, future conditions with project build out, and recommendations for mitigating site
      traffic.
   3) Harbor Point Traffic Impact Study, 2008: This Traffic Impact Study included existing conditions,
      future conditions with project build out, and recommendations for mitigating site traffic.
   4) UnionWharf Traffic Impact Analysis, 2010: included existing conditions, future conditions with
      project build out, and recommendations for mitigating site traffic.
   5) Southeast Complete Streets Plan, 2012: Description of, and implementation for, integrating high-
      quality pedestrian, cycling and transit infrastructure into the roadway network throughout the
      Southeast Zone neighborhoods.
   6) Harbor Point Traffic Study, 2013: This Traffic Study focused on the proposed internal public street
      infrastructure, and connections to the existing City street network, included existing conditions,
      future conditions with project build out, and recommendations for mitigating site traffic.
   7) Whole Foods Relocation to Central Ave Traffic Operations Study, 2014: Evaluation of site access
      and circulation, between Lancaster Street and Aliceanna Street, and impacts to S. and N. Central
      Avenue and S. and N. Caroline Streets.
   8) BJ’s Wholesale Traffic Study, 2015: Evaluation of site access and circulation included existing
      conditions, future conditions and recommendations for mitigating site traffic.
   9) Water Transit Strategic Plan 2015: Recommends policy for the Water Transit Program
      Management, including the Water Taxi (WT), Harbor Connector (HC) and Dockmaster programs.

   IV.     2007-2015 Infrastructure Investments
Since 2007, the following transportation improvements shown below have been designed, funded,
implemented or are moving toward advertisement for construction by the Baltimore City Department of
Transportation:

   1) Upgrade of S. Central Avenue to four lanes from E. Fayette Street to Aliceanna Street (expected to
      begin construction in 2016)
   2) Intersection widening improvements at (completed in 2015):
          a. Boston Street at S Clinton Street
          b. Boston Street at Ponca Street
          c. S Conkling Street at O’Donnell Street
          d. O’Donnell Street at Interstate Avenue

                                                                                                       9
Southeast Strategic Transportation Vision
e. O’Donnell Street at Ponca Street
f. Boston Street at S Haven Street
3) Traffic signal installation (Boston Street and S Haven Street, completed in 2014)
4) Implementation in 2010 of Harbor Connector Water Taxi system (200,000 trips per year in 2014)
5) Implementation in 2010 of Green and Orange Charm City Circulator routes (80,000 trips per year
in 2014)
6) Implementation as of Fiscal Year 2015 of 20.5 lane miles signed and marked bicycle routes
through Harbor East, Fells Point, Canton, and Greektown
7) Installation of over 100 new public bicycle racks for parking throughout the Southeast Zone
(completed between 2010-2016)
8) Provision of Zipcar parking throughout the Southeast Zone (completed between 2014-2016)
9) Upgrade of select bus stops with new shelters and benches (completed between 2010-2016 in
partnership with Maryland Transit Administration)
10) New bus service enhancements by the Maryland Transit Administration (completed in 2014):
a. No. 26 Line: The new service will originate downtown at E. Fayette and N. Charles Streets
and travel to Dundalk Marine Terminal with a stop at the Amazon Distribution Center on
Broening Highway, which will employ more than 1,000 people.
b. No. 31 Line: The new service will originate from State Center Metro to the Community
College of Baltimore County (CCBC),Dundalk with a stop at the Shops at Canton Crossing
Additionally, private companies are operating in the Southeast Zone, providing alternatives to car
ownership, including:
Johns Hopkins University Hospital Private Shuttle
University of Maryland will be implementing a Private Shuttle
Amazon Private Shuttle
Zipcar
Uber/Lyft
Bicycle Racks and storage on both private property and in the public right-of-way
10Southeast Strategic Transportation Vision
V. Economic Development Activity/ Land Use Forecasts (2015-
2020)
Future economic development is expected throughout the study area, and this growth will result in
increased demand for travel across all modes. Table 1 lists the identified developments expected to be
completed, or recently completed and expected to be fully occupied for the next five years. The list was
compiled using the City’s Econ View database, and supplemented through conversations with the
Department of Planning, the Downtown Partnership, Waterfront Partnership, Baltimore Development
Corporation and Council Members. Over 35 unique projects were identified totaling over 12,500,000
square feet in new and redevelopment. The total development includes over 6,500 new residential
dwelling units, 1,000 hotel rooms, 2,300,000 square feet of office, 1,000,000 square feet of retail and
1,500,000 square feet of industrial space. The table includes the location, type, and size of the
developments. Figure 3 illustrates the distribution of planned developments by land use type, and Figure
4 illustrates the Forecasted Economic Development Activity Locations.
Figure 3: Distribution of Planned Developments
Distribution of Planned Developments
24%
Office
Retail
52% Industry
9%
Hotel
Residential
12%
3%
11Southeast Strategic Transportation Vision
Table 1. Current Summary of Development Activity in the Southeast Zone
Residential Office Retail Industry
Council District Project Name Address Project Type Description Phase Rooms Hotel SubZone Neighborhood
Units (Sq Ft) (Sq Ft) (Sq Ft)
1 Hyatt Place 511 South Central Ave Hotel Hotel - 8 story mixed-use building - retail, hotel, parking Occupancy 0 280 0 14,200 0 A INNER HARBOR
12 Jonestown Mews 921-923 E. Baltimore Street Residential Conversion of historic building for market rate apartments. Occupancy 21 0 0 0 0 A JONESTOWN
S Newkirk St/ Boston CANTON INDUSTRIAL
1 BJs Canton Mixed-Use 3000 SF Taco Bell, 89,000 BJs wholesale club, 12 gas pumps Occupancy 0 0 0 92,000 0 C
O'donnell St/ Ponca St AREA
Four Seasons Condo Addition of up to eight additional floors to the existing Four Seasons Hotel to include
1 100 International Drive Residential Occupancy 80 0 0 0 0 A INNER HARBOR
Expansion luxury condominium units
Approximately 250,000 sf. of retail including several anchor tenants, junior box stores ,
1 Canton Crossing Boston Street / S Clinton Street Mixed-Use Occupancy 0 0 250,000 250,000 0 C CANTON
restaurants and speciality shops, plus 250K office
Phase 1 - New construction of 8 townhouses. (Aliceanna)
1 Merchant Point 700-26 S Ann St Residential Phase II - Rehabilitation of the Four Bay House into 1 Townhouse. (Aliceanna) Occupancy 19 0 0 0 0 B FELLS POINT
Phase III - New construction of 3 townhouses (Aliceanna)
Phase IV - New construction of 8 townhouses (S Regester)
1 Merchant Hill Phase I and II 3800 Dillon St Residential Luxury newly constructed townhomes. Occupancy 46 0 0 0 0 B BREWERS HILL
The Dolben Company, Inc. and Klein Enterprises have partnered together to co-develop
1 Marketplace at Fells Point South Broadway/Fleet Street Mixed-Use 159 new apartments in Baltimore and 28,000 square feet of retail space. The historic public Occupancy 159 0 0 28,000 0 B FELLS POINT
comfort station has been rehabilitated to house non-profit office space.
Hendler Creamery Historic redevelopment of the former Hendler Creamery building and adjacent properties
12 1100 E Baltimore Street Mixed-Use Planned 276 0 0 15,000 0 A JONESTOWN
Redevelopment into a 276 unit residential development with ground floor retail.
The Ronald McDonald House is planning to construct a new house in the historic
1200 East Baltimore Street Jonestown Neighborhood that will provide visiting families to Johns Hopkins Hospital,
12 Ronald McDonald House Institutional Planned 55 0 0 0 0 A JONESTOWN
Baltimore, MD 21202 University of Maryland Medical Center, and other area hospitals. The house will include 55
new rooms, over a 50% increase over their current location.
201 N Aisquith Street PLEASANT VIEW
12 Pleasant View Gardens Residential Rehabilitation of family public housing Planned 311 0 0 0 0 A
Baltimore Maryland 21202 GARDENS
Della Notte Site Proposed 16-story apartment tower with ground floor retail on the site of the former Della
1 801 Eastern Ave, Baltimore, MD 21202 Mixed-Use Planned 150 0 0 5,000 0 A INNER HARBOR
Redevelopment Notte Restaurant in Little Italy
1 H&S redevelopment 711 S. Central Avenue Mixed-Use 30,000 SF Whole Foods, 250 condos, 50,000 SF Office Planned 250 0 50,000 30,000 0 B INNER HARBOR
13 Area A Washington Hill PUD 1 North Wolfe Street Residential New Construction of 210 apts at Gateway within the Washington Hill PUD Planned 210 0 0 0 0 B WASHINGTON HILL
1 Tindeco/ Lighthouse Point Boston Street/ Lakewood Avenue Mixed-Use 250 condos Planned 250 0 0 0 0 B CANTON
1 Safeway Boston Street/ Lakewood Avenue Mixed-Use redevelopment 150 apartments, 50,000 SF office Planned 150 0 50,000 0 0 C CANTON
PATTERSON PARK
1 101 South Ellwood Avenue 101 South Ellwood Residential 175 apartments Planned 175 0 0 0 0 C
NEIGHBORHOOD
4201 Pulaksi Highway Expansion of Pompeian's existing facility at 4201 Pulaski Highway to include a 40,000-
2 Pompeian Expansion Industrial Planned 0 0 0 0 40,000 C KRESSON
Baltimore, MD 21224 square foot warehouse expansion to the rear.
1 Greektown TOD Foster Ave Mixed-Use 200K office, 100K retail, 100 room hotel, 300 apartments Planned 300 100 200,000 100,000 0 C GREEKTOWN
1 Bayview Campus Expansion E. Lombard Street / Bayview Boulevard Office 100,000 SF research and development Planned 0 0 100,000 0 0 D HOPKINS BAYVIEW
PULASKI INDUSTRIAL
1 Hampton Inn 6571 Eastern Ave Hotel Construct 112 Room Hampton Inn and Suites hotel Planned 0 112 0 0 0 D
AREA
HOLABIRD INDUSTRIAL
1 Victory Steel Warehouse 6320 Beckley Street Warehouse 1 Story, 22,800 SF warehouse building Planned 0 0 0 0 22,800 D
PARK
1 Dundalke Avenue Project Holabird/ Dundalk Residential 250 Apartments Planned 250 0 0 0 0 D BROENING MANOR
1 PEMCO Former Site 5601 Eastern Ave Mixed-Use 60K grocery, 150K retail, 100 room hotel, 250 apartments, 250K office Planned 250 100 250,000 210,000 0 D GREEKTOWN
1 Kaufman Property Boston/ Highland/ Bayliss Mixed-Use 250 apartments, 50K office Planned 250 0 50,000 0 0 C CANTON
CANTON INDUSTRIAL
1 Copt Development Clinton South of Boston Mixed-Use 500 Dwelling units, 100K retail, 250K office Planned 500 0 250,000 100,000 0 D
AREA
1 Duburns Arena Expansion Boston/ Ellwood Event 5,000 additional seats Planned 0 0 0 0 0 C CANTON
1 Fells Point Hotel Thames/ Lancaster Hotel 150 room hotel Planned 0 150 0 0 0 B FELLS POINT
Aliceanna/ Fleet
1 H&S North Lot Mixed-Use 300 apartments, 50K retail, 100K office Planned 300 0 100,000 50,000 0 B INNER HARBOR
Central /Eden
1 Eastern Avenue Lot Eastern/ President/ Fawn Residential 500 apartments Planned 500 0 0 0 0 A LITTLE ITALY
HOLABIRD INDUSTRIAL
1 Duke Property (Amazon) Holabird Avenue / Broening Highway Warehouse remaining buildout of 1,500,000 SF warehouse Under Construction 0 0 0 0 1,500,000 D
PARK
O'Donnell Heights Multi- Boston Street/ O'Donnell Street
1 Residential 925 Townhomes Under Construction 925 0 0 0 0 D O'DONNELL HEIGHTS
Phase Redevelopment Dundalk/ Gusryan
master planned unit development (1,400,000 SF office, 914 dwelling units, 250 hotel rooms,
1 Harbor Point 1100 Wills Street Mixed-Use Under Construction 914 250 1,400,000 196,000 0 B FELLS POINT
196,000 SF retail)
1 Brewers Hill O'donnell Street / S Conkling Street Mixed-Use remaining buildout of 250K office Under Construction 0 0 250,000 0 0 C BREWERS HILL
1 Greektown - Phase II 820 Oldham Street Residential
Demolish existing structures and construct single-family townhomes within the Greektown
PUD.
Under Construction 177 0 0 0 0 C GREEKTOWN 12
Total 6,518 992 2,950,000 1,090,200 1,562,800Southeast Strategic Transportation Vision
Figure 4. Forecasted Economic Development Activity Locations
13Southeast Strategic Transportation Vision
VI. Existing Transportation Network
The study area is an urban setting that is served by a multimodal transportation network including
roadways, pedestrian routes, bicycle routes, and transit services.
a. Walking Network
Southeast Baltimore has a fully developed network of sidewalks providing pedestrian connectivity
throughout the study area. Baltimore City DOT has begun an Americans with Disabilities Act (ADA) self-
assessment project according to Federal Highway Administration (FHWA) guidelines. The self-assessment
will be completed over the next 4 fiscal years (2016-2020). DOT has also developed an ADA Transition plan
to address prioritization and procedure for implementation of accessible transportation facilities in the
right-of-way (ROW). Upgrading sidewalks to ADA and to desired widths often requires partnership
between DOT and private property owners. Developers contribute to upgrading sidewalks and curb ramps
as part of the Developer Agreement process as applicable.
b. Biking Network
Several designated bicycle routes traverse the Southeast Zone totaling over 20 lane miles of signed routes,
designated on-road bike lanes and multi-use paths. Several north-south routes exist that provide dedicated
bike lanes. While several signed and marked east-west routes exist, none offer dedicated or protected bike
lanes. The area’s existing bicycle network is illustrated in Figure 5. In 2015 DOT published the Bicycle
Master Plan, which identified priority bicycle infrastructure needs in the Southeast study area.
c. Transit Network
Several operators are involved in the Southeast transit system. The City operates two Charm City Circulator
bus routes in the area (Orange and Green routes). Two water-based transit services exist; a privately
operated water taxi (fee service) for visitors and residents, as well as the City-operated Harbor Connector
(free commuter service). Figure 6 illustrates the current network of City operated transit in the area.
The Maryland Transit Administration (MTA) operates the Metro Subway which serves the Southeast Zone
at the Shot Tower station. The Metro serves 2,000 daily riders at this station. The MTA also operates local
bus routes, including the lines number 7 (Mondawmin to Canton), 10 (Catonsville to Dundalk), 13
(Walbrook Junction to Canton) 21 (Mondawmin to Fells Point), 22 (Mondawmin to Bayview), 23 / 40
(Rolling Road to Essex local and express), 26 (Downtown to Dundalk), 31 (State Center to Dundalk) that
traverse the Southeast along major roadways including Orleans Street, E. Fayette Street, Eastern Avenue,
Boston Street, Wolfe Street, S. and N. Washington Street, S. and N. East Avenue, and Ponca Street – as
illustrated in Figure 7. These routes carry a combined 65,600 passengers per day, with a significant
percentage of trips originating from or destined to one of the 330 bus stops in the Southeast Zone. At the
time of final report release, the MTA has begun the planning and public comment period for the MTA
BaltimoreLINKS program and details of the program and effects on the southeast are not known. Baltimore
City DOT will work with MTA to forward the needs of the residents of Baltimore City within this study area.
In addition, several private transit operators, such as Johns Hopkins University and Johns Hopkins Hospital
serve the study area to provide travel options for their employees, students and patients.
14Southeast Strategic Transportation Vision
Figure 5. Southeast Baltimore Bicycle Network (2015)
15Southeast Strategic Transportation Vision
Figure 6. City Operated Transit Services (2016)
16Southeast Strategic Transportation Vision
Figure 7. State Operated (MTA) Transit Services - Bus and Metro (2016)
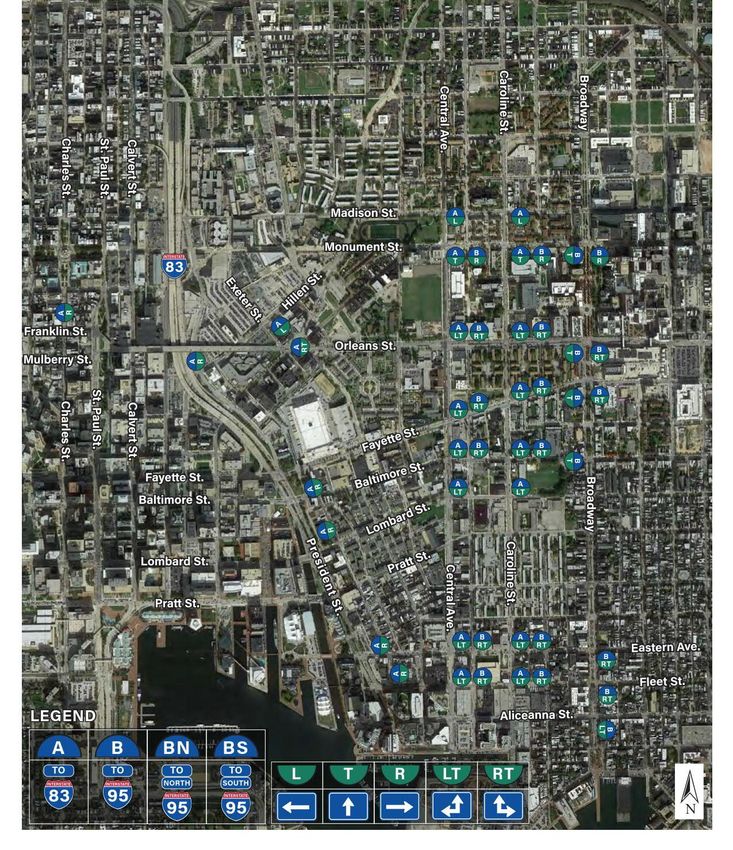
17Southeast Strategic Transportation Vision
D. Roadway Network (Passenger Cars and Trucks)
A traditional grid street network exists throughout the study area. Freeways provide connectivity to the
local street network along both the eastern and western boundaries of the study area. I-83 connects the
western portion of the study area to points north while I-95 and I-895 run north-south along the eastern
border of the study area with a few access points within the Southeast. The major roadways evaluated in
this study are the east-west arterials of E. Baltimore Street, Boston Street, Fleet Street, Aliceanna Street,
Eastern Avenue, E. Fayette Street, O’Donnell Street, E. Lombard Street, E. Fayette Street and Orleans Street
as well as the north-south arterials of S. and N. President Street, S. and N. Central Avenue, Broadway, Wolfe
Street, S. and N. Washington Street, Conkling Street, Ponca Street, and Broening Highway. Study
intersections are illustrated in Figure 8. In 2012, Baltimore City DOT approved the designated through truck
routes which serve the commercial and industrial uses in the Southeast, as shown in Figure 9. The truck
map shows which truck routes are for local traffic, through traffic and which routes are restricted to truck
traffic from 7 PM to 7 AM. Outside of the industrial area, designated streets include Fleet, Boston, S. and N.
Central, Broadway, E. Fayette, and Eastern Avenue. Boston and Fleet Streets in Fells Point are restricted
from truck traffic. Broening Highway is the primary freight corridor connecting the Port of Baltimore
operations to City destinations and the interstate system.
i. Roadway Capacity Analysis
A capacity analysis is summarized for the existing conditions using the Highway Capacity Manual (HCM)
methodology for all of the study intersections, based on the most-recently available traffic counts and/or
studies. Level of service (LOS) is defined by the HCM as a “qualitative measure describing operational
conditions within a traffic stream.” LOS ranges from A to F where A represents optimal conditions and F
represents failing conditions. Baltimore City’s standards define LOS D or better as acceptable.
The existing traffic volumes, along with existing roadway geometry, lane configurations and signal timing,
were inputted to code a baseline traffic model for the study network using Synchro software. Synchro
Software is a deterministic and macroscopic signal analysis program that implements the Highway Capacity
Manual methodology. The results of the capacity analysis are summarized in Figure 10 and Table 2.
ii. Volume-to-Capacity Ratio
An additional planning metric, volume-to-capacity ratio was also employed to assess the ability of future
development-generated vehicle traffic volume to be served by the available intersection capacity based on
the existing roadway geometry and signal timing. The volume-to-capacity ratio compares roadway demand
(vehicle volumes) with roadway supply (carrying capacity); a value over 75% indicates limited ability to
handle additional vehicles. In a connected street network like in the Southeast, the effects of even one
failing intersection is not isolated and can result in several blocks of queued vehicles in all directions,
significantly increasing travel times and delays.
iii. Summary
Based on this performance measure, 18 of the 34 critical intersections are operating at over 75% of
capacity (e.g. LOS D, E or F) during at least one peak hour, indicating that any significant additional vehicle
demand will exceed the remaining intersection capacity, and result in failing operations, excessive queuing,
increased motorist delays and travel times.
18Southeast Strategic Transportation Vision
Figure 8. Study Intersections
19Southeast Strategic Transportation Vision
Figure 9. Designated Truck Routes
20Southeast Strategic Transportation Vision
Figure 10. Existing AM and PM Peak Hour Intersection Level of Service
21Southeast Strategic Transportation Vision
Table 2. Summary of Existing Intersection Capacity Analysis2
Level of Volume-to-
Total Entering
ID Intersection Service Capacity
Volume – PM
AM (PM) Ratio
1 President St @ Fayette St F (E) 100.9% 5228
2 President St @ Baltimore St D (D) 90.1% 5000
3 President St @ Lombard St D (C) 84.3% 4496
4 President St @ Pratt St E (D) 84.3% 4856
5 President at Eastern Ave D (D) 97.1% 3,532
6 President at Fleet Street C (D) 55.1% 2,329
7 Central Ave @ Aliceanna St B (B) 76.6% 1281
8 Central Ave @ Fleet St E (E) 75.1% 1755
9 Central Ave @ Eastern Ave C (D) 72.1% 1465
10 Central Ave @ Fayette St C (C) 72.5% 3067
11 Boston St @ Aliceanna St B (E) 77.5% 2244
12 Boston St @ Fleet St D (E) 79.8% 2364
13 O'Donnell @ Conkling St C (D) 89.9% 1976
14 Pulaski Hwy @ Ellwood Ave B (B) 71.9% 2458
15 Lombard St @ Bayview Rd C (C) 59.6% 2211
16 Kane St @ Eastern Ave C (C) 74.6% 3130
17 Boston St @ Ponca St C (D) 82.2% 2087
18 O'Donnell @ O'Donnell Cutoff C (C) 46.0% 1883
19 O'Donnell @ Interstate Ave C (D) 80.7% 2265
20 O'Donnell St Cutoff @ Interstate Ave C (D) 60.2% 1820
21 Boston St @ Broening Hwy C (C) 46.7% 958
22 Broening Hwy @ Holabird Ave C (C) 53.9% 1686
23 Interstate Ave @ Ramp from I-95 NB C (C) 43.2% 1433
24 Fayette Street @ Washington St C (E) 93.6% 2199
25 Orleans Street @ Washington St A (A) 62.2% 2104
26 Aliceanna Street @ Broadway B (C) 53.5% 1471
27 Eastern Avenue @ Broadway C (F) 141.1% 3830
28 Eastern Avenue @ Haven Street C (C) 82.2% 2198
29 Eastern Avenue @ Highland Street B (C) 81.8% 1453
30 Fayette Street @ Broadway C (D) 85.5% 2847
31 Dundalk Ave @ Holabird Avenue D (D) 76.9% 2537
32 Eastern Avenue @ Bayview Blvd B (B) 48.3% 2403
33 Eastern Avenue @ Oldham St A (B) 65.3% 1569
34 Boston St @ Conkling St C (D) 76.6% 2499
35 Aliceanna St @ Wolfe St C (B) 80.90% 1330
Red indicates intersection at or above capacity
22Southeast Strategic Transportation Vision
VII. Future Traffic Forecasts
The methodology for projecting future traffic, specifically development-generated traffic, includes
estimating new trips generated by each new land use, and then adjusting to account for alternative travel
choices such as walking, biking and transit.
A. Trip Generation
Trip generation is the most critical aspect of assessing traffic impact. The objective of a trip generation
analysis is to forecast the number of new trips that will begin or end at a proposed land use. A primary
source for the data on vehicular trip generation is the Trip Generation Handbook, 9th Edition published by
the Institute of Transportation Engineers (ITE). The Handbook compiles data from numerous studies of
trip rates at hundreds of specific types of land uses (e.g. retail, schools, and apartments) throughout the
country. The data is sorted by various time periods and plotted against independent variables (e.g. square
feet of commercial space, number of employees, and number of dwelling units). The data is presented in
charts with weighted averages and fitted curve linear regression equations (when enough data is
available).
The compilation of trip generation rates is largely suburban in nature, derived from single use sites in
areas without strong walking, biking and transit options. As such, several site-specific factors can reduce
the number of estimated personal vehicular trips generated by a new development or land use. These
include:
The availability of alternative modes of transportation – sidewalks, bicycling networks, and transit
services
The effect of pass-by traffic – passenger vehicles already on the road making a new “stop” at a
proposed land use
The effect of internally captured trips – composed of traffic originating and destined for different
land uses within the same development that do not travel on the public street, such as a hotel
guest eating lunch at a restaurant in the same building or complex.
The effect of pass-by traffic is also quantified from data available in the Trip Generation Handbook.
b. Mode Choice
In accounting for alternative travel modes, influencing factors include travel time, travel cost, time of day,
comfort, etc. In this study, mode choice was determined using the Baltimore Metropolitan Council’s
(BMC) regional travel demand model, which incorporates local neighborhood-level census data including
car ownership and journey to work surveys. This tool takes neighborhood-specific characteristics –
proximity to transit, land use – into account to determine the share of trips that will be taken by bike, light
rail, Metro, commuter rail, bus, and on foot. The Southeast Zone is divided into four different sub-zones
with distinct characteristics allowing for the application of local data – making the tool a valuable resource
for forecasting mode split. The denser neighborhoods of the western end of the study area provide better
access for transit, walking, and biking than do the more suburban and industrial neighborhoods along the
eastern end.
23Southeast Strategic Transportation Vision
The baseline mode share is as follows, and varies within the ranges based on trip type such as commute,
shopping, etc., and specific location/ proximity to bus and rail lines within the Southeast Zone:
Bus Transit – 3.5% to 14%
Metro Subway – 5.5% to 11%
Walking/ Biking – 4% to 37%
Given the rates from the Trip Generation Handbook and the mode choice discussed in this section,
forecasts were made for each of the planned developments listed in Section IV.
After adjusting for applicable discounts related to walking, biking and transit trips, the new land uses3 will
add approximately 9,400 AM and 10,200 PM new peak hour vehicle trips to the existing street network as
shown in the table below. The travel forecasts also estimate approximately 2,700 new walking, biking and
transit trips in the AM peak hour and 3,800 new walking, biking and transit trips in the evening peak hour.
AM Peak Hour PM Peak Hour Daily Trips
Entry Exit Entry Exit Entry Exit
Raw New Site Trips 7475 5351 8124 10114 84575 84579
Less Non-Auto (Ped, Bike, and Transit) 1307 1400 1932 1950 17609 17616
Less Internally Captured Trips 295 295 885 885 9175 9175
Less Pass-by Trips 39 38 852 852 9551 9369
Total Net New Vehicle Trips 5834 3618 4455 6427 48241 48420
“Entry” and “Exit” in the table above refers to the sum total of new vehicles entering and leaving new
developments, respectively. Detailed forecasted AM, PM peak hour trips are summarized in Table 3, for
each identified development in the planning, construction or occupancy stage.
Figure 11 shows, spatially, where the relative impact of the projected developments are expected in the
study area over the next five years. The figure shows that Harbor East and Canton Industrial Area are
expected to see the highest number of newly generated vehicle trips.
3
As described on page 2, Econ View, which display real estate development and public investment across the city,
was used to determine expected new land uses.
24Southeast Strategic Transportation Vision
Figure 11: 3-D visualization of Trip Generation across Southeast Plan Study
25Southeast Strategic Transportation Vision
Table 3: Forecast of Trips Generated by Currently Planned and Under
Construction/ Occupancy Developments
2616 Pompeian Expansion 83
Subtotal 40 10 8 25
Townhomes 5 16 13 7
17 Merchant Hill Phase I and II 41
Subtotal 5 16 13 7
Office 315 43 55 267
18 Brewers Hill remaining buildout 680
Subtotal 315 43 55 267
Southeast Strategic Transportation Vision Retail 110 63 246 285
19 Canton Crossing Office 293 30 45 227 1299
Subtotal 403 93 291 512
Gas 28 27 43 44
Restaurant 60 41 26 20
20 BJ's Canton 970
Retail 111 74 246 250
Subtotal 199 142 315 314
Townhomes 12 56 53 27
21 Greektown PUD townhomes 148
Subtotal 12 56 53 27
Apartment 25 98 49 27
Hotel 26 7 20 20
22 Greektown TOD Office 243 26 38 201 1160
Retail 73 41 129 137
Subtotal 367 172 236 385
Office 151 21 29 142
23 Bayview Campus Expansion 343
Subtotal 151 21 29 142
Hotel 29 20 28 27
24 Hampton Inn 104
Subtotal 29 20 28 27
Warehouse 289 77 84 253
25 Duke Property 703
Subtotal 289 77 84 253
Townhomes 43 211 208 102
26 O'Donnell Heights redevelopment 564
Subtotal 43 211 208 102
Warehouse 6 1 6 17
27 Victory Steel Warehouse 30
Subtotal 6 1 6 17
Apartment 21 84 84 45
28 Dundalke Avenue Project 234
Subtotal 21 84 84 45
Retail 96 55 188 207
Office 278 19 41 217
Hotel 26 3 17 16
29 PEMCO Former Site 1675
Apartment 21 80 3 4
Supermarket 97 57 129 121
Subtotal 518 214 378 565
Office 85 12 19 98
30 Kaufman Property Apartment 21 82 82 43 442
Subtotal 106 94 101 141
Retail 73 39 129 123
Office 299 31 46 241
31 Copt Development 1318
Apartment 41 160 80 56
Subtotal 413 230 255 420
Arena 894 894 894 894
32 Duburns Arena Expansion 3576
Subtotal 894 894 894 894
Hotel 32 22 32 30
33 Fells Point Hotel 116
Subtotal 32 22 32 30
Retail 36 21 53 50
Office 138 14 23 124
34 H&S North Lot 633
Apartment 21 80 44 29
Subtotal 195 115 120 203
Apartment 22 86 82 44
35 Eastern Avenue Lot 234
Subtotal 22 86 82 44
GRAND TOTAL 5832 3616 4455 6427 20330
27Southeast Strategic Transportation Vision
VIII. Findings and Multi-Modal Mobility Strategy
Since the original iteration of the Southeast Plan in 2007, several million square feet of new developments
have come online and even more are in various planning stages. In the same time period, Baltimore City
DOT has constructed several intersection and roadway capacity improvements. In spite of these
improvements, congestion is still prevalent at many Southeast intersections and along arterial corridors.
Congestion is expected to worsen with additional new developments. Nearly half of all critical intersections
are currently at or approaching capacity. DOT has identified a few capacity improvement projects within
the Southeast Zone.
Increased use of non-single occupant vehicle transportation modes is essential to accommodate the
expected growth in Southeast Baltimore. Improving upon the ability of Southeast to accommodate new
trips requires:
Increasing travel options to and within Southeast through expanded and prioritized transit and
biking networks
Enhancing connections between travel modes within the Southeast Zone
Employing traffic management strategies
Based on these requirements, individual improvements across all travel modes are recommended.
Specifically, key east-west and north-south corridors should be identified, planned, and reconfigured to
prioritize specific modes of travel. These corridors can provide additional capacity through a mix of mode-
specific treatments. New water transit routes and operations may provide additional capacity to move
people to jobs, retail, and recreation.
In addition to accommodating all modes within the Southeast study area, specific Transportation Demand
Management (TDM) and Transportation Management Associations (TMAs) are recommended to induce
alternative transportation means. TDM is information, encouragement and incentives provided by local or
regional organizations to inform people about all their transportation options to optimize all modes in the
system – and to counterbalance the incentives to drive. A TMA is a non-profit agency typically composed of
local businesses, and local jurisdictions funded by a public-private partnership. The TMA’s mission is to
provide/ support programs and information about parking and travel options.
A. Walking Network
Access to Transit
Good intermodal connections are critical in order for transit services to reach their full potential. Providing
high-quality pedestrian access near stations will allow for greater access and is a proven strategy to
increase transit ridership. Pedestrian facilities near transit services – are a priority including:
Enhanced pedestrian crosswalks
Pedestrian signals at all signalized intersections
ADA curb ramps
Increased pedestrian lighting at transit stops
Direct bus and taxi connections
Ride shares
28Southeast Strategic Transportation Vision
Wayfinding signing – including information on connections to other travel modes
Walking distances between destinations and transit stops
Real-time transit information
The following high-pedestrian corridors have been identified as high-priority for ADA upgrades:
Boston Street;
S. and N. Caroline Street;
S. and N. President Street;
S Broadway Street;
Thames Street;
Aliceanna Street;
Fleet Street;
S. Highland Avenue;
Conkling Street; and
Lancaster Street.
Implementing ADA enhancements throughout the transportation network improves the walking experience
and attracts more people to use the network. The DOT ADA Self-Assessment is expected to be finished by
the end of FY2018. ADA improvements will be implemented according the DOT ADA Transition plan by
both public and private project entities.
B. Biking Network
Bike Sharing System
Southeast grid network of streets, short blocks and proximity of mixed uses, lends itself to short quick trips,
served by bikeshare. With the launching a bike sharing system in Baltimore City including stations in the
Southeast will increase the supply of bicycles on the street. The more bicycles on the transportation
system, increases their visibility, which will have an effect of increasing driver’s vigilance for cyclists, making
it safer for all users. Bikeshare service, in conjunction with a network of dedicated biking infrastructure,
has the potential to further encourage biking throughout the Southeast Zone and across the city, and
expand access to areas that may not be cost-effective for transit to serve. This study supports the
implementation of bikeshare and expansion throughout the Southeast Zone. Proposed docking stations
would serve areas of high residential density, employment, retail, and transit hubs. The following
commercial and employment centers have been identified as high-priority for Bikeshare:
Canton
Harbor East
Harbor Point
Fells Point
Patterson Park
Jonestown
Little Italy
Johns Hopkins Medical Institute
29Southeast Strategic Transportation Vision
Bike Access to Transit
Providing safe and convenient cycling conditions near stations will allow for greater access and is a proven
strategy to increase transit ridership. Cycling facilities near transit services – including bike share docks, bike
racks; covered and secure bike racks/lockers; enhanced cycling crosswalks; cycling curb cuts; and increased
lighting at transit stops is a priority. Bicycle wayfinding signage, including information on connections to
other nearby destinations and transit hubs, is a critical element of bike-accessible transit infrastructure.
Bike Network Infrastructure Improvements
Additional cycling infrastructure improvements are recommended to create a more connected bike
network throughout the study area and support the deployment of bikeshare stations. The Southeast
Strategic Transportation Vision supports the Bicycle Master Plan recommendations in the Southeast Zone
and recommends annual infrastructure investment to increase the network lane-mileage of bicycle facilities
implemented throughout the study area. Specific improvements to enhance bicycle network connectivity
and capacity are illustrated in Figure 12 and include:
Boston Street bike lanes, in each direction
S. and N. Caroline Street bike lanes, between Bank Street and E Madison Street
S. and N. East Avenue bike lanes
Wolfe Street and S. and N. Washington Street bike lanes
Potomac Street cycle track
30Southeast Strategic Transportation Vision
Figure 12. Proposed Bicycle Facility Improvements
31Southeast Strategic Transportation Vision
C. Transit Network
Three jurisdictions of transit operate in Baltimore City – 1) City-owned transit; 2) State-owned transit; and
3) Private transit. The Southeast Strategic Transportation Vision offers the following recommendations.
1) City-owned Transit
The Plan recommends continued funding of existing Charm City Circulator (CCC) and Harbor Connector (HC)
Water Taxi operating expenses. Additionally, the following transit improvements are recommended:
Supporting the current operations of the CCC.
Establishing direct connections between the CCC and the Water Transit stops.
Evaluating all routes to limit overlap between the CCC and MTA lines.
Identifying appropriate layover and idling locations for efficiency of service.
Implementing transit priority treatments on identified corridors for the CCC.
Enhancing Pedestrian and bicycle access/parking at transit stops.
Implementing and operating congestion management shuttle service to provide
commuters safe, convenient, and reliable park and ride service from the perimeter of the
mitigation zone to the major employment centers.
Water Transit services can provide additional peak period transportation system capacity for commutes
from East Baltimore and the I-95 North Corridor to Harbor East / Harbor Point and to Downtown. A new
Harbor Connector service with a park and ride parking deck should be developed along with the proposed
Canton Crossing Transit Hub. The new Harbor Connector route should operate from Canton to Harbor
Point and Downtown (see Figure 13). This new Harbor Connector service should be operated during peak
hours (6:30 AM to 9:30 AM and 3:30 PM to 7:30 PM). Parking fees along with Harbor Connector fares
should be utilized to offset a portion of the capital and operating costs.
DOT has recently completed a Baltimore Water Transit Strategic Plan. This Plan made several policy
recommendations for the Water Taxi and Harbor Connector services, including branding the Water Taxi as
an attraction and the Harbor Connector as an extension of the CCC. The Harbor Connector service is
popular as a commuting option. Since its beginning in 2010 HC ridership has grown to more than 200,000
trips per year. From 2013 to 2014, HC average daily ridership grew by 47 percent. Additional policy
recommendations include a new route from Canton Waterfront Park to Maritime Park/Harbor Point,
additional park and rides, and increased wayfinding signage. The Southeast Strategic Transportation Vision
supports DOT implementing the full range of recommendations in the Water Transit Strategic Plan. Specific
recommendations for improving water transit in the Southeast Zone include:
Rebranding the Harbor Connector so that it is an extension of the Charm City Circulator.
Improving signage at the Harbor Connector landings and wayfinding signs at the Charm City
Circulator stops to direct users between services.
Improving the floating docks at Harbor Connector landings so that passengers may board
the vessels without the need for portable stairs.
32You can also read