IRCC nnecting Indian River County - 2040 Long Range Transportation Plan
←
→
Page content transcription
If your browser does not render page correctly, please read the page content below
C nnecting

             IRC
 Indian River County
 2040 Long Range Transportation Plan

    Long Range
Transportation Plan
   2040 Update

         www.IRMPO.com
                                   042075013.14
ADOPTION OF THE INDIAN RIVER COUNTY METROPOLITAN PLANNING ORGANIZATON
2040 LONG RANGE TRANSPORTATION PLAN AS THE OFFICAL LONG RANGE
TRANSPORTATION PLAN FOR INDIAN RIVER COUNTY ON DECEMBER 9, 2015.

The Indian River County Metropolitan Planning Organization (MPO) is the responsible entity for
conducting a continuing, cooperative, and comprehensive planning program for Indian River
County, Florida. Under Federal and State regulations, the Indian River County MPO has, as one
of its primary duties, the responsibility for developing and adopting a 2040 Long Range
Transportation Plan conforming to the Moving Ahead for Progress in the 21st Century (MAP-21)
Act. The MPO has conducted an extensive public involvement program throughout the 2040
Long Range Transportation Plan development process, including advertised workshops and
hearings, has provided significant comment period prior to taking final action on the 2040 Long
Range Transportation Plan in accordance with the adopted Public Involvement Plan, and has held
the required, duly noticed public hearing on December 9, 2015.

The 2040 Long Range Transportation Plan identifies project costs and reasonably available
revenues to fund projects and programs to assure that the 2040 Long Range Transportation Plan
is cost affordable. The MPO has coordinated the 2040 Long Range Transportation Plan
development with all involved state, regional, and local agencies, including consideration of locally
adopted comprehensive plans and the 2060 Florida Transportation Plan.

NOW, THEREFORE, BE IT RESOLVED that the Indian River County MPO, in regular session
duly assembled on the 9th day of December 2015, and having fulfilled all Federal and State
requirements, certifies that the 2040 Long Range Transportation Plan is the adopted
transportation plan for Indian River County and, as such, shall be the basis for future plans,
programs, and policies of the Indian River County MPO.

ADOPTED this 9th day of December 2015.

INDIAN RIVER COUNTY METROPOLITAN PLANNING ORGANIZATON

ATTEST

_____________________________________

---------------------------------- (CHAIRMAN)

APPROVED AS TO LEGAL FORM AND SUFFICIENCY

Office of the Indian River County Attorney

________________________________________

ATTORNEY
Table of Contents
Chapter 1. Introduction............................................................................................................... 1
  Plan Documentation ............................................................................................................... 1
  Plan Development Process .................................................................................................... 3
  2040 LRTP Highlights............................................................................................................. 4
Chapter 2. Goals, Objectives, Policies, and Performance Measures .......................................... 5
Chapter 3. Public Involvement and Coordination........................................................................ 9
  Public Involvement Plan ......................................................................................................... 9
  Public Involvement Events...................................................................................................... 9
  Innovative Public Involvement Strategies ..............................................................................11
  Public Involvement Highlights ................................................................................................12
  Agency Coordination .............................................................................................................13
Chapter 4. Growth Forecast ......................................................................................................14
  Population Allocation .............................................................................................................17
Chapter 5. Multimodal Needs Plan ............................................................................................19
  Baseline Conditions ...............................................................................................................19
  Potential Future Roadway Deficiencies .................................................................................21
  Policy Decisions ....................................................................................................................23
  Needs Plan Development Guidelines ....................................................................................23
  Initial Needs Projects .............................................................................................................23
  Alternatives Analysis .............................................................................................................27
  Final Roadway Needs Plan and Aspirational Projects ...........................................................27
  Non-Motorized Needs Plan....................................................................................................30
  Transit Needs Plan ................................................................................................................35
Chapter 6. Financial Resources ................................................................................................37
  Potential Revenue Sources ...................................................................................................37
  Revenue Estimates for Roadway Capacity Projects ..............................................................38
  Revenue Estimates for Roadway Operations and Maintenance Projects...............................39
  Revenue Estimates for Transit Projects .................................................................................40
  Needs Plan Project Cost Estimates .......................................................................................41
Chapter 7. Multimodal Cost Feasible Plan ................................................................................43
  Project Prioritization...............................................................................................................43
  Cost Feasible Roadway Projects ...........................................................................................45
  Highlights of Roadway Cost Feasible Plan ............................................................................48
  Measures of Effectiveness.....................................................................................................48
  Unfunded Roadway Needs ....................................................................................................49
  Multimodal Improvements......................................................................................................50
  Other Considerations.............................................................................................................51
Chapter 8. Plan Implementation ................................................................................................55
List of Figures
Figure 1- 1. Indian River County ................................................................................................ 2
Figure 1- 2. Plan Development Process ..................................................................................... 3
Figure 4-1. Population Growth from 2010 to 2040 .....................................................................15
Figure 4- 2. Employment Growth from 2010 to 2040 .................................................................16
Figure 4- 3. Preferred Land Use Vision (from 2035 LRTP) ........................................................17
Figure 5- 1. 2040 Roadway Deficiencies ...................................................................................22
Figure 5- 2. 2040 Initial Roadway Needs Projects .....................................................................26
Figure 5- 3. 2040 Final Roadway Needs Projects .....................................................................29
Figure 5- 4. Non-Motorized Needs – Pedestrian Facilities .........................................................33
Figure 5- 5. Non-Motorized Needs – Bicycle Facilities ..............................................................34
Figure 5- 6. Transit Needs ........................................................................................................36
Figure 7- 1. Roadway Cost Feasible Plan .................................................................................47

List of Tables
Table 2- 1. Goals, Objectives, and Performance Measures......................................................... 6
Table 4- 1. Socio-Economic Data .............................................................................................. 14
Table 5- 1. Summary of TIP Projects ........................................................................................ 20
Table 5- 2. 2040 LRTP Potential Roadway Deficiencies ...........................................................21
Table 5- 3. 2040 Initial Needs Projects ......................................................................................24
Table 5- 4. 2040 Final Needs Projects .....................................................................................28
Table 5- 5. Non-Motorized Needs – Pedestrian Facilities(1) .......................................................31
Table 5- 6. Non-Motorized Needs – Bicycle Facilities(1) .............................................................32
Table 5- 7. Transit Needs ..........................................................................................................35
Table 6-1. Total Revenue for Roadway Capital Projects 2021-2040 (YOE)............................... 39
Table 6- 2. Revenue Totals for Operations and Maintenance 2021-2040 (YOE) ......................40
Table 6- 3. Revenue for Transit Projects 2021-2040 (Year of Expenditure)...............................40
Table 6-4. Inflation Factors........................................................................................................41
Table 6-5. Cost of Final Needs Plan Roadway Projects (YOE) .................................................42
Table 7- 1. Roadway Cost Feasible Plan ..................................................................................46
Table 7- 2. Financial Summary of Roadway Cost Feasible Plan (Present Day Cost) ................48
Table 7- 3. Measures of Effectiveness ......................................................................................49
Table 7- 4. Unfunded Roadway Needs .....................................................................................49
Table 7- 5. Cost Feasible Improvements on Designated Truck Routes .....................................51
Table 7- 6. Other Recommendations ........................................................................................54
Table 8- 1. Cost Feasible Project Phases ................................................................................. 56
List of Appendices

SECTION 1: PLAN DOCUMENTS
Appendix A: LRTP Checklist
Appendix B: Goals, Objectives, and Polices
Appendix C: Public Involvement
       Appendix C-1: Public Involvement Plan
       Appendix C-2: Ballot Questions/Responses
       Appendix C-3: Needs Plan Questions/Responses
       Appendix C-4: Online Survey Results
Appendix D: Data Review
       Appendix D-1: Study Area Data Review
       Appendix D-2: Treasure Coast 2040 Zonal Projections (Excerpts)
       Appendix D-3: Socio-Economic Data Development
Appendix E: Needs Plan
Appendix F: Financial Resources Analysis
       Appendix F-1: Financial Resources
       Appendix F-2: 2040 Revenue Forecast- Appendix for the IRC Metropolitan Area LRTP
       Appendix F-3: 2040 Revenue Estimates for Indian River County Metropolitan Area
Appendix G: Cost Feasible Plan (Developed for the initial plan adoption on December 9, 2015)

SECTION 2: REFERENCES
Appendix H: FHWA’s Expectations Letter
Appendix I: 2040 Revenue Forecast Handbook
Appendix J: MPO Handbook – Chapter 4
List of Acronym
AVL      Automatic Vehicle Location
BEBR     Bureau of Economic and Business Research
CAC      Citizens Advisory Committee
CEI      Construction Engineering and Inspection
CFP      Cost Feasible Plan
E+C      Existing+Committed
ETDM     Efficient Transportation Decision Making
FAST     Fixing America’s Surface Transportation Act
FDOT     Florida Department of Transportation
FHWA     Federal Highway Administration
FTA      Federal Transit Administration
IRC      Indian River County
LOS      Level of Service
LRTP     Long Range Transportation Plan
MAP-21   Moving Ahead for Progress in the 21st Century Act
MPO      Metropolitan Planning Organization
O&M      Operations & Maintenance
OA       Other Arterials
PDC      Present Day Cost
PE       Preliminary Engineering
PIP      Public Involvement Plan
ROW      Right-of-Way
SHS      State Highway System
SIS      Strategic Intermodal System
TAC      Technical Advisory Committee
TAP      Transportation Alternatives Program
TAZ      Traffic Analysis Zones
TCRPM    Treasure Coast Regional Planning Model
TDP      Transit Development Plan
TIP      Transportation Improvement Program
TMA      Transportation Management Area
TRIP     Transportation Regional Incentive Program
TSM&O    Transportation System Management & Operation
ULAM     Urban Land Use Allocation Model
VHT      Vehicles Hours Traveled
VMT      Vehicles Mile Traveled
V/C      Volume-to-Capacity Ratio
YOE      Year of Expenditure
Chapter 1. Introduction
The Indian River County Metropolitan Planning Organization (MPO) is the federally designated
legislative agency responsible for transportation planning in the urbanized area of Indian River
County (IRC). One of the main functions of the MPO is to update its Long Range Transportation
Plan (LRTP) every five years. This LRTP will serve as the mechanism for identifying and
prioritizing multi-modal transportation improvements over a 25-year planning horizon through the
year 2040 (hereafter called the 2040 LRTP Update). The projects identified in this plan are geared
to serve the future mobility needs, enhance travel options, and improve safety, quality of life and
economic vitality.

The 2040 LRTP Update was developed consistent with the federal planning guidelines provided
in the Moving Ahead for Progress in the 21st Century (MAP-21) Act; and applicable State, County,
and local plans, policies and guidelines available at the time the plan was developed. A checklist
documenting how the 2040 LRTP Update is consistent with the applicable federal and state
guidelines is provided in Appendix A of this report. The Indian River County MPO’s Governing
Board formally adopted the 2040 LRTP Update on December 9, 2015. An amendment to the 2040
LRTP Update will be presented to the MPO’s Governing Board on December 14, 2016.

Figure 1-1 depicts Indian River County, municipalities and the urban service area.

Plan Documentation
The following documents present the 2040 LRTP Update at varying levels of detail:

   •   Summary Report – Provides a concise overview of the plan and key results.
   •   Final Report – Serves as the official Plan document. It describes the plan development
       process; goals, objectives, policies, and performance measures; public involvement
       process; growth forecast; Needs Plan; financial analysis; Cost Feasible Plan; and plan
       implementation.
   •   Appendices: Appendices were grouped into two sections. Section 1 includes technical
       memoranda that were developed as part of the plan development; public input collected
       through surveys; socio-economic data forecasts and revenue projections developed by
       the Florida Department of Transportation (FDOT); and the LRTP checklist. Section 2
       complies reference documents, including the Federal Highway Administration’s (FHWA)
       LRTP Expectations, FDOT’s 2040 Revenue Forecast Handbook, and Chapter 4 of the
       MPO Handbook.

                                                [1]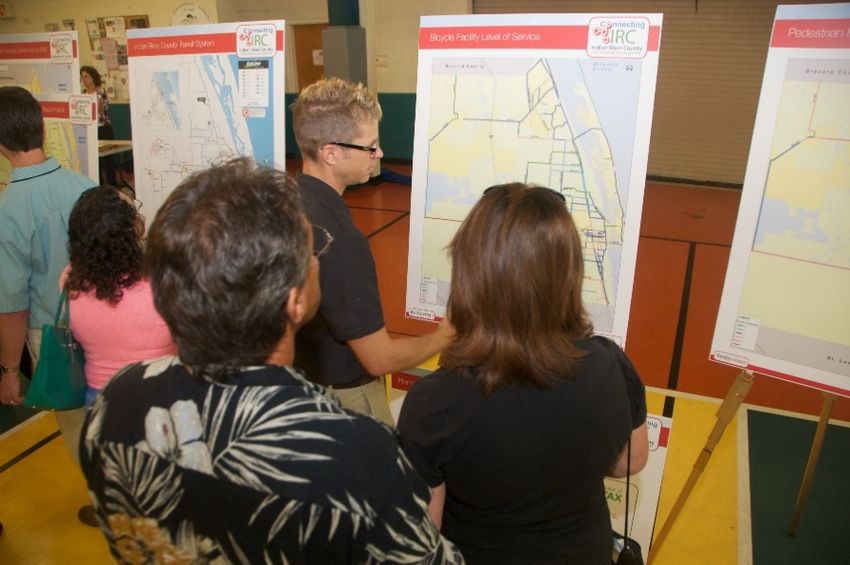
Figure 1-1. Indian River County

                                                                                                                                                      ¯
                         Brevard County                                                                               Atlantic
                                                                                                                      Ocean
                             CR 507

                                                         Sebastian                        £
                                                                                          ¤1

                                           CR 512                                                                 Orchid
                         5   12
                    CR                                                                    CR 510                                 A1A

                                      §
                                      ¦
                                      ¨
                                      95

                                                                                           77TH ST

                                                                               66TH AVE
              Fellsmere                                                                    69TH ST
                                                                                           65TH ST
                                                                                                                        Indian River Shores
                                                    82ND AVE

                                                                    53RD ST
           CR 512

                                                                                                                  49TH ST
                                                                                            58TH AVE

                                                                                                       45TH ST

                                                                 26TH ST
                                                                                                  SR 60                       Vero Beach
                                                                          60                                      16TH ST                  17TH ST
                                                                          12TH ST
                                                                                      8TH ST

                                                                                                                                                     A1
                                                                                                                                                        A
                                                                                          4TH ST
                                                               74TH AVE

                                                                                                       43RD AVE

                                                                                                                   27TH AVE

                                                                                                                               5TH ST SW
                                                                                                                              OSLO RD
                                                                                           58TH AVE

                                                                                           St. Lucie County

Legend
    Urban Service Area

                                                                  Indian River County
                                           2040 Long Range Transportation Plan Update
Plan Development Process
The 2040 LRTP Update was developed through a step-by-step process involving a
comprehensive analysis of the county’s transportation system, forecasts of demographic data,
land use and growth pattern assessment, establishing a long-term vision for the County’s
transportation system, revenue forecast for transportation investments, assessment and
prioritization of needs, and extensive public and stakeholder outreach.

                           Figure 1- 2. Plan Development Process

                                               [3]
2040 LRTP Highlights
The multi-modal transportation plan includes highway, transit, pedestrian and bicycle, and
congestion management strategies. The highlights of the plan are listed below.
• A balanced approach to address capacity needs through a mix of widening existing roads
and completing the grid road system.
• Incorporation of appropriate Complete Streets elements such as sidewalks and bicycle
lanes into every road project.
• A new interchange on I-95 at Oslo Road providing a vital regional connection in South
Indian River County and relief to the adjacent interchanges.
• Continue to expand the service hours of the popular IRC GoLine transit system.
• Technology based strategies to improve the efficiency of major roadways and transit
system, enhance traveler information, and advance incident and emergency management
capabilities.
• Widespread consensus to extend the 1-Cent Local Option Sales Tax beyond 2019 to fund
local transportation projects. Based on the MPO’s Governing Board’s direction, the 2040
Plan was developed based on the reasonable assumption that the 1-Cent Local Option
Sales Tax would be extended beyond 2019.
[4]Chapter 2. Goals, Objectives, Policies, and Performance Measures
The goals, objectives, and polices set the framework for defining the County’s transportation
system based on diverse needs, interests, and expectations of the community. Performance
measures were established to measure the progress toward established objectives. Table 2-1
depicts the goals, objectives, and performance measures. The 2040 LRTP goals were developed
consistent with the MAP-21 federal planning factors, local government comprehensive plans, and
the Florida Transportation Plan guidelines. A review of the relevant planning and police guidelines
is documented in Appendix B. The goals, objectives, policies and performances measures
established for the 2040 LRTP Update are largely consistent with the 2035 LRTP.
GOAL 1
A connected, responsive, aesthetically pleasing and
efficient transportation system that meets the needs of
Indian River County residents, visitors, and businesses.
GOAL 2
A transportation system that provides travel alternatives
which enhance mobility for people and freight.
GOAL 3
A transportation system that is sensitive to the natural and
social environment.
GOAL 4
A safe transportation system for Indian County residents,
visitors, and businesses.
GOAL 5
A transportation system that is preserved and maintained
through adequate investment and management of the
infrastructure.
[5]Table 2-1. Goals, Objectives, and Performance Measures
Map-21 Goals 2060 Florida Transportation Plan Goals
Freight Movement and Economic Vitality
Reduced Project Delivery Delays
Environmental Sustainability
Maintenance and Operations
Environmental Stewardship
Economic Competiveness
Mobility and Connectivity
Infrastructure Condition
Goals/Objectives Polices Performance Measures
Congestion Reduction
Community Livability
Safety and Security
System Reliability
Safety
Goal 1: A connected, responsive, aesthetically pleasing and efficient transportation system that meets the needs of Indian River County residents, visitors, and businesses.
Implement multimodal improvements
Maintain the adopted level of service standard for all functionally identified in the 2040 Cost Feasible Percent of lane miles meeting the adopted
1.01 classified roads through the year 2040. x x x x x x x Plan, consistent with the Interim Year level of service standard.
Roadway Improvement Sets.
Implement multimodal improvements Hurricane evacuation clearance time
Maintain a 12 hour hurricane evacuation clearance time on
identified in the 2040 Cost Feasible measured through actual event.
1.02 roads designated as hurricane evacuation routes through the x x x x x x Plan for roadways designated as Lane miles of roadway improvements on
year 2040.
hurricane evacuation routes. hurricane evacuation routes.
Enhance the grid roadway network by constructing an average
Implement new corridor multimodal Average annual centerline miles of new
of two centerline miles of new roadway corridors with
1.03 appropriate multimodal improvements each year from 2020 to x x x x x x x x x x x improvements identified in the 2040 roadway corridors constructed during the
Cost Feasible Plan. period from 2011 to 2040.
2040.
Enhance the FDOT’s Strategic Intermodal System (SIS) by
Implement improvements to the SIS on
1.04 constructing the Oslo Road Interchange at Interstate 95 by x x x x x x x x Interstate 95 at Oslo Road by 2040.
New Interchange on SIS.
2040.
Incorporate Transportation Systems
Management and Operations (TSM&O)
Optimize functionality and efficiency of existing infrastructure which includes Intelligent Transportation Number of new roadways that incorporate
1.05 and ROW through 2040. x x x x x x x x x x x x x System (ITS) and/or Connected Vehicle TSM&O or Connected Vehicle Architecture.
architecture into all new roadway
projects.
Goal 2: A transportation system that provides travel alternatives which enhance mobility for people and freight.
Make Capital and Operational
Percentage of buses arriving within 5 minutes
2.01 Maintain Transit Quality and LOS “A” for reliability. x x x x x x improvements consistent with the
of schedule.
adopted Transit Development Plan.
Improve service coverage consistent
System compliance with adopted level of
2.02 Maintain Transit Quality and LOS “B” for Service Coverage. x x x x x x with the adopted Transit Development
service standard
Plan.
Expand weekday hours of service to 12 hours a day on at least
Expand weekday hours of operation on Average number of weekday bus routes with
one bus route every two years during the period from 2020 to
2.03 2040 so that all weekday bus routes operate at least 12 hours x x x x x x fixed-route bus network consistent with 12 hours of service added during the period
the adopted Transit Development Plan. from 2020 to 2040.
per day by 2040.
Implement sidewalk improvements
consistent with the adopted
Maintain Bike/Ped LOS “D” on 80% percent of roadways in Bicycle/Pedestrian Plan. Percentage of roadways meeting adopted level
2.04 Indian River County through 2040. x x x x x x x x
Implement bicycle facility improvements of service standard
consistent with the adopted
Bicycle/Pedestrian Plan.Table 2-1. Goals, Objectives, and Performance Measures
Map-21 Goals 2060 Florida Transportation Plan Goals
Freight Movement and Economic Vitality
Reduced Project Delivery Delays
Environmental Sustainability
Maintenance and Operations
Environmental Stewardship
Economic Competiveness
Mobility and Connectivity
Infrastructure Condition
Goals/Objectives Polices Performance Measures
Congestion Reduction
Community Livability
Safety and Security
System Reliability
Safety
Implement bicycle facility improvements
consistent with the adopted
Add an average of two miles of bicycle facilities on functionally Bicycle/Pedestrian Plan. Average annual number of new bicycle
2.05 classified roadways or trails each year during the period from x x x x x x x x x facilities added during the period from 2020 to
Adapt abandoned railroad corridors,
2020 to 2040. 2040.
roadway alignments and military trails
for bicycle facilities, wherever possible.
Average annual centerline miles of new and
improved roadway corridors constructed to
Enhance freight mobility by improving an average of one
Implement the freight mobility serve freight movement during the period from
centerline mile of roadway with appropriate multimodal
2.06 improvements each year that are identified as serving freight
x x x x x x improvements identified in the 2040 2020 to 2040.
Cost Feasible Plan Percent of vehicle miles of traveled on roads
movement
serving freight movement meeting the adopted
level of service.
Increase the efficiency and convenience of connecting multiple Add bus shelters and improve hubs
2.07 modes by adding an average of one shelter or transfer facility x x x x consistent with the Transit Development Number of new shelters/improved transit hubs
per year through 2040. Plan.
Goal 3: A transportation system that is sensitive to the natural and social environment.
Limit average increase in CO, HC, and NO emissions to less Implement the transportation Percent change in CO, HC, and NO emissions
3.01 than 15 percent from the previous five-year period for each five x x x x improvements identified in the 2040 (in kilograms) for each five year period from the
year period from 2020 to 2040. Cost Feasible Plan. base year for the period from 2020 to 2040.
Implement the transportation
Ensure that all collector roadways are less than six lanes Centerline miles of collector roadways with six
3.02 through the year 2040. x x x x improvements identified in the 2040
or more lanes.
Cost Feasible Plan.
Incorporate higher elevations, increased
Increase resiliency of infrastructure for extreme weather and drainage capacity, and more resilient Percentage of new projects incorporating
3.03 climate trends. x x x x x x construction materials as appropriate enhanced features.
into new projects.
Identify and prioritize key multimodal
Improve mobility in economically disadvantaged areas Miles of improved multimodal corridors added
3.04 consistent with the Federal “Ladders of Opportunity” initiative. x x x x x x x x x x x x improvements in economically
in economically disadvantaged areas.
disadvantaged areas.
Goal 4: A safe transportation system for Indian County residents, visitors, and businesses.
Implement intersection and other
improvements related to safety as
Annual percent change in the crash rate per
4.01 Reduce the crash rate by 10% through 2040. x x x x x x x identified in the Cost Affordable Plan
million vehicle miles traveled.
including Congestion Management
Process plan.
Implement intersection and other
improvements related to safety as Annual percent change in the crash injury rate
4.02 Reduce the crash injury rate by 10% through 2040. x x x x x x x identified in the MPO Congestion per million vehicle miles traveled.
Management Process plan.Table 2-1. Goals, Objectives, and Performance Measures
Map-21 Goals 2060 Florida Transportation Plan Goals
Freight Movement and Economic Vitality
Reduced Project Delivery Delays
Environmental Sustainability
Maintenance and Operations
Environmental Stewardship
Economic Competiveness
Mobility and Connectivity
Infrastructure Condition
Goals/Objectives Polices Performance Measures
Congestion Reduction
Community Livability
Safety and Security
System Reliability
Safety
Implement intersection and other
improvements related to safety as Annual percent change in the crash fatality rate
4.03 Reduce the crash fatality rate by 10% through 2040. x x x x x x x identified in the MPO Congestion per million vehicle miles traveled.
Management Process plan.
Goal 5: A transportation system that is preserved and maintained through adequate investment and management of the infrastructure.
Resurface a minimum of four percent of Miles and percent of major roads with a FHWA
Maintain a FHWA pavement index rating score of at least 3.0 on
5.01 80 percent of the major roads through the year 2040. x x x x x x x the major roads on an annual, life cycle pavement index rating pavement condition of
basis through the year 2040. 3.0 or better.
Evaluate the structural integrity of
bridges on the major road network and
Maintain a public bridge network with 0% of bridges classified as Percent of bridges that exceeds structural
5.02 structurally deficient through the year 2040.
x x x x x x x implement rehabilitation projects as
rating per FDOT bridge evaluation criteria.
appropriate, and in coordination with
FDOT.Chapter 3. Public Involvement and Coordination
The 2040 LRTP Update included an extensive public involvement effort. Public input was sought
from the outset through community workshops, MPO meetings, stakeholder interviews, surveys,
press releases, websites, and newsletters. Involving appropriate agencies, governments, and the
general public is key to a successful public outreach effort. Most importantly, identifying an
efficient transportation system can only come from a true understanding of citizens’ diverse and
far-ranging needs. Interim plan documents and updates were made available through the project
specific website (http://www.irmpo.com/LRTP/) and MPO newsletters.
Public Involvement Plan
A public involvement plan (PIP) was developed at the outset of the study to identify strategies for
eliciting public input during the plan development. Early and ongoing involvement of the public
and private entities, interest groups, and the general public throughout the county was seen as
the key to a successful public outreach effort. To improve
the visibility and public awareness of the 2040 LRTP
Update, the Plan was branded as “Connecting IRC.” This
name was chose to emphasize the need for improved
connectivity to the multimodal transportation network.
Appendix C-1 includes the specific PIP developed and
used for the 2040 LRTP Update.
Public Involvement Events
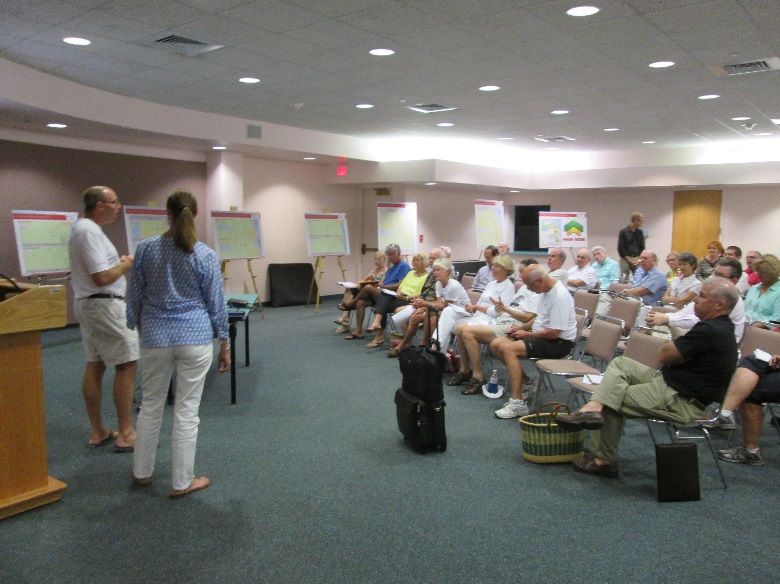
A series of public workshops was conducted to obtain citizens’ input to the plan during the
development of the Needs Plan and Cost Feasible Plan (CFP). The meeting locations were
selected in north, central and south Indian River County and included venues to attract minority
populations and low-income communities. Throughout the plan development process, interim
results were presented to the MPO’s Governing Board, Technical Advisory Committee (TAC),
and Citizens Advisory Committee (CAC). Technical memoranda were provided in advance of the
MPO meetings and the typical format of the meetings included a presentation followed by a
question and answer session. The MPO meetings were publicly advertised, thus providing
opportunities for the public to provide input. A summary of public involvement events, surveys
and information dissemination methods is provided below.
[9]Meetings/Workshops
• Six (6) MPO Board presentations
• Six (6) Technical Advisory Committee and
Citizens Advisory Committee presentations
• Six (6) Needs Plan development workshops
• Four (4) Cost Feasible Plan development
workshops
• One (1) Socio-economic data forecast/Land
Use workshop
• Ten (10) key stakeholder meetings
• Meetings and conference calls with local
agency staff
Surveys
• Online survey
• Needs assessment survey
• Multimodal ballot
• Comment cards
Information Dissemination
• Project specific webpage
• MPO newsletters
• Newspapers
• Meeting agendas and information via
e-mails to MPO committees and
subscribers
• Indian River County Chamber of
Commerce, Treasure Coast
Regional Planning Council, public
libraries and community centers
[10]Innovative Public Involvement Strategies
As listed above, a variety of strategies was utilized during the plan development to obtain public
input. Consistent with the MAP-21 guidelines, visual techniques such as display boards,
renderings, and computer based illustrations were utilized during workshops and presentations.
To generate enthusiasm and attendee involvement during the Needs Plan workshops, an
innovative role-playing strategy involving campaign speeches by five “Candidates,” who
represented different transportation modes, were played out. After the speeches by the
candidates, a “Ballot” was distributed and the attendees provided their input specific to a set of
questions on the transportation modes represented by the candidates. During the CFP
workshops, the same candidates gave victory speeches, highlighting how the draft CFP included
projects specific to the transportation modes each candidate advocated.
[11]Public Involvement Highlights
Over 170 people attended LRTP Public Workshops and 455 survey responses, including 246
through online surveys, were completed during the plan update. Furthermore, 20 completed
comment cards were received. Input from the citizens was utilized to develop and refine
multimodal transportation improvements. Appendix C-2, Appendix C-3, and Appendix C-4
includes the ballot questions/responses, needs plan questions/responses, and online survey
responses. Input received is summarized below.
• Broad support for the extension of the 1-Cent Local Option Sales Tax beyond 2019, which
is the primary source of funding for local transportation projects.
• Traffic congestion, safety issues, and lack of transportation choices were identified as the
biggest transportation issues.
• Emphasis to include bicycle and pedestrian facilities as part of future roadway projects.
• A strong desire among the residents who attended the Wabasso workshop to see the
CR 510 road widening project expedited.
• More bus stop amenities such as shelters at existing bus stops, more frequent service,
and longer service hours during weekends were identified as the top three transit needs.
• 26th Street/Aviation Boulevard, Indian River Boulevard, and US 1 were identified as
corridors with the greatest need for pedestrian facility improvements.
• Old Dixie Highway, US 1, and 45th Street were identified as corridors with the greatest
need for bicycle facility
improvements.
• Some residents expressed
concern on the proposed 43rd
Avenue widening between
16th Street and Oslo Road,
citing road widening may have
a negative impact on the
property values and quality of
life in the immediate area due
to increased traffic.
[12]Agency Coordination
The plan development process included coordination with local agencies, adjacent MPOs, and
FDOT. A summary of coordination activities is listed below.
• Indian River County – revenue forecast from local sources and information on planned
projects.
• FDOT – activity based travel demand model implementation, socio-economic data
projections, revenue forecasting, and input for interim deliverables through FDOT
representatives on the MPO Technical Advisory Committee, draft cost feasible plan and
funding options.
• St. Lucie County TPO – socio-economic data projections, coordination to identify Needs
Plan projects at the county line. The planned I-95 interchange at Oslo Road is a regionally
significant project that will benefit both Indian River and St. Lucie Counties.
• Brevard County MPO – coordination to identify Needs Plan projects at the county line.
Additional coordination effort is expected when the 2040 Treasure Coast Regional LRTP is
developed.
[13]Chapter 4. Growth Forecast
According to the 2010 Census, Indian
River County’s population was
approximately 138,000. By race, 76.3
percent were White, 11.9 percent were
Hispanic/Latino, and 9.4 percent were
African-American. Approximately, 30
percent of the population was 65 years
or older, which is higher than the State’s
average of 19 percent.
The estimation of socio-economic data
for year 2040 was based on forecasts
available from the Bureau of Economic
and Business Research (BEBR), the U.S. Census Bureau’s household and employment data,
and the Indian River MPO’s land use studies. Table 4-1 summarizes the socio-economic data.
The estimated population in 2040 is approximately 202,000, indicating an increase of
approximately 47 percent between 2010 and 2040. The 2040 population estimate is slightly less
than the 2035 population estimate (209,000) from the 2035 LRTP Update. Population growth is
expected to outpace employment growth between 2010 and 2040. By 2040, the population in the
urbanized areas of Indian River County MPO is projected to exceed 200,000, and hence will meet
the population threshold established for designation as a Transportation Management Area
(TMA). The MPOs that meet the TMA designation criteria obtain certain benefits and incur
additional requirements beyond those applicable to smaller urbanized areas. The primary benefit
is that TMAs receive federal-aid highway flexible funding based on the area’s population. A
technical memorandum with additional information on the Socio-Economic Data Development is
included in Appendix D-1. Figures 4-1 and 4-2 depict the population and employment density
maps.
Table 4- 1. Socio-Economic Data
Year Population Employment
2010 138,028 65,244
2040 202,295 90,968
30-year growth 47% 39%
[14]Figure 4-1. Population Growth from 2010 to 2040
Brevard County Atlantic
Ocean
¯
1
£
¤
§
¨
¦ 95
A1A
60
Legend
Low Population Growth
Low to Medium Population Growth St. Lucie County
Medium Population Growth
High Population Growth
Indian River County
2040 Long Range Transportation Plan UpdateFigure 4-2. Employment Growth from 2010 to 2040
Brevard County Atlantic
Ocean
¯
1
£
¤
§
¨
¦ 95
A1A
60
Legend
Low Employment Growth
Low to Medium Employment Growth St. Lucie County
Medium Employment Growth
High Employment Growth
Indian River County
2040 Long Range Transportation Plan UpdatePopulation Allocation
An important step of the LRTP development is to forecast where the growth is likely to occur. The
FDOT, with input from the three Treasure Coast Region MPOs, coordinated the development of
socio-economic data allocations for Indian River, St. Lucie and Martin Counties. Extensive land
use visioning activities were conducted during the 2035 LRTP Update and land use patterns have
remained consistent over the past several years. Therefore, land use visioning was not performed
for the 2040 LRTP Update. Figure 4-3 illustrates the Preferred Land Use Vision adopted during
the 2035 LRTP Update.
Figure 4- 3. Preferred Land Use Vision (from 2035 LRTP)
The MPO evaluated alternative land use scenarios using several planning tools and models,
including the SLEUTH model developed by the US Geological Survey and NC State University;
and the IMPACTS model, developed by the RAND Corporation through the National Cooperative
Highway Research Program. SLEUTH allocates growth to areas that have capacity without
regard to market forces or political boundaries. The results of SLEUTH model do not predict
densification of development within the Urban Service Area. The SLEUTH model, however, does
forecast development in some of the newly annexed areas. The IMPACTS model identifies the
effects on travel from factors such as increased technology, changes in fuel availability, and an
aging population. Three scenarios for future travel behavior were modeled with the IMPACTS
[17]model: a Momentum scenario, with continuation of existing trends; a Technology Triumphs
scenario, where technological innovations enhance the travel experience; and a “Gentle
Footprint” scenario where technological innovations are coupled with an embracing of alternative
modes and land use patterns. With the exception of the Gentle Footprint scenario, which
assumes densification and extensive use of other modes, there is no significant difference in per
capita vehicle miles traveled under either the Momentum scenario or the Technology Triumphs
scenario (see Table 2 in Appendix D3). The MPO will continue to monitor future technological
advancement and associated impacts on travel patterns and lifestyles, and incorporate the
relevant scenarios into the planning process.
The socio-economic data was then assigned to the Traffic Analysis Zones (TAZ), which are
smaller geographic areas of similar characteristics that serve as the forecast unit in the travel
demand models. Two models were used for socio-economic data allocation: the Indian River
County MPO’s Vacant Parcel Model and Urban Land Use Allocation Model (ULAM). The Vacant
Parcel Model identifies and predicts development potential and redevelopment potential on a
parcel-by-parcel basis countywide. ULAM allocates population and employment control totals
from the county-level to the TAZ level. The socio-economic data allocation considered the local
comprehensive plans’ future land use elements and the County’s conservation and
environmentally sensitive areas. The other input data for the ULAM includes vacant buildable
land, land use densities, approved development, school enrollment data, and historical
development trends. The allocation results of ULAM were converted into the format required for
the Treasure Coast Regional Transportation Planning Model (TCRPM 4.0).
[18]Chapter 5. Multimodal Needs Plan
In long range transportation planning, a Needs Plan identifies the improvements to an area’s
transportation network that are required to maintain satisfactory mobility conditions. The roadway
improvement needs are primarily identified through travel demand forecasting. The TCRPM 4.0,
which was developed by the FDOT, was utilized for travel demand forecasting for the 2040 LRTP
Update. The Needs Plan served as the basis for the development of the fiscally constrained Cost
Feasible Plan (CFP), where project costs and anticipated revenue streams are taken into
consideration. Appendix E includes the Needs Plan Technical Memorandum.
Baseline Conditions
The Transportation Improvement Program (TIP) identifies projects with funding commitments over
a five-year timeframe. Therefore, projects that are expected to be constructed by 2020 are
considered as “committed” projects in the LRTP development. The focus of the 2040 LRTP
Update is to identify capacity improvements needed between 2021 and 2040. According to the
2015 TIP and input from MPO staff, no major roadway capacity projects are expected to be
completed between 2015 and 2020. However, preliminary phases such as design and right-of-
way acquisition are planned for several roadway capacity projects during that timeframe. Please
note that, in the 2040 LRTP Update, the 43rd Avenue and 66th Avenue projects were assumed to
be Needs Plan projects. Table 5-1 and Appendix D-1 includes the summary of the TIP projects.
[19]Table 5- 1. Summary of TIP Projects
ROADWAY PROJECT PRE-
ENG ROW CST
FM # NAME FROM TO DESCRIPTION
4317591
43rd Avenue At SR 60 (Intersection) Widen
4317592
4347431 66th Avenue At CR 510 (Intersection) Widen
4363791 66th Avenue 49th Street 81st Street Widen to 4 Lanes
2308791 82nd Avenue 26th Street CR 510 New Road
2308792 82nd Avenue 69th Street CR 510 New Road
4056062 CR 510 CR 512 66th Avenue Widen to 4 Lanes
4130482 I-95 At Oslo Road New Interchange
4315211 Oslo Road I-95 58th Avenue Widen to 4 Lanes
4317241 US 1 53rd Street CR 510 Widen to 6 Lanes
4317331 8th Street 58th Avenue 21st Court Sidewalk
Aviation Airport Drive
4317252 43rd Avenue Sidewalk
Boulevard West
101st
87th Street/ CR 510 / 79th
4317281 Avenue/ 87th Sidewalk
91st Avenue Street
Street
Indian River
4368601 37th Street 53rd Street Sidewalk
Boulevard
Trans Florida
Central North County Multi-purpose
4325742 West of I-95
Railroad Park trail
Greenway
Old Dixie
4231862 38th Lane 45th Street Sidewalk
Highway
[20]Potential Future Roadway Deficiencies
To identify the roadway deficiencies, it was assumed that no capacity-producing roadway
improvements would be implemented between 2021 and 2040. In other words, the deficiency
assessment considers the impact of 25 years of growth (2015 through 2040) on the County’s
roadway network without any additional roadway capacity. Volume to capacity (V/C) ratios
obtained from the TCRPM 4.0 for the 2040 baseline conditions were examined to identify roadway
deficiencies. Deficient roadways are candidates for potential future roadway improvements or
indicators that parallel network improvements are needed. When estimating the V/C ratio,
capacities corresponding to level of service (LOS) D were utilized. This method is consistent with
the adopted LOS standards as outlined in the Indian River County’s concurrency management
system. Two exceptions to the LOS D capacity threshold are 27th Avenue between St. Lucie
County Line and SR 60, and 43rd Avenue between Oslo Road and 16th Street, where the adopted
LOS is 120% of the LOS E capacity.
The forecast roadway deficiencies beyond existing plus committed (E+C) improvements are
summarized in Table 5-2. Figure 5-1 illustrates the potential 2040 roadway deficiencies. The
results of the analysis demonstrate that a number of roadways will potentially operate below LOS
D by 2040 if improvements to the transportation system are not made.
Table 5- 2. 2040 LRTP Potential Roadway Deficiencies
Facility From To
Roseland Road CR 512 US 1
US 1 Roseland Road CR 512
US 1 Barber Street 53rd Street
CR 512 Roseland Road CR 507
CR 510 CR 512 SR A1A
66th Avenue 49th Street Barber Street
58th Avenue 26th Street 53rd Street
SR A1A 2 miles north of SR 60 1 mile south of 17th Street
Indian River Boulevard 37th Street US 1 / 4th Street
Aviation Boulevard/26th Street 43rd Avenue US 1
43rd Avenue 26th Street St. Lucie County Line
27th Avenue Oslo Road St. Lucie County Line
[21]Figure 5-1. 2040 E+C Roadway Deficiencies
Brevard County
CR 507
Atlantic
Ocean
¯
£ 1
¤
CR 512
2
51
R
C
CR 510
§
¦
¨
95
77TH ST
66TH AVE
69TH ST
65TH ST
58TH AVE
A1A
CR 512
49TH ST
45TH ST
26TH ST
60 SR 60
16TH ST 17TH ST
12TH ST
8TH ST
A1
A
4TH ST
66TH AVE
US 1
5TH ST SW
OSLO RD
27TH AVE
St. Lucie County
Legend
Roadway Deficiencies
Indian River County
2040 Long Range Transportation Plan UpdatePolicy Decisions
The following policy decisions made during the development of the 2035 LRTP Update were
applied for the 2040 LRTP Update. These decisions are specific to arterial roads that exhibited
travel demand exceeding their adopted LOS standards:
• Arterial roadways should not exceed six lanes.
• A decision was made not to widen SR A1A to four lanes due to lack of right-of-way and
environmental concerns.
• The City of Sebastian does not support the widening of US 1 to six lanes through its
downtown core between CR 512 and Roseland Road.
Needs Plan Development Guidelines
The Florida Long Range Transportation Planning Needs Assessment Guidelines developed by
FDOT recommend that a project should be included as a Need only if it is likely to be implemented
within the planning horizon of the LRTP. This approach requires the estimation of approximate
cost, revenue, timing, and need. The projects that are not included in the Needs Plan because
of the above mentioned factors are recommended to be included in a separate category called
Aspirational Projects. Such projects may be associated with future development opportunities
that are not currently quantified or on a projected schedule. The LRTP does not have to include
the cost of Aspirational Projects. Based on these guidelines, the Indian River LRTP includes a
separate category of “Aspirational Projects.”
Initial Needs Projects
The 2040 roadway deficiencies illustrated in Figure 5-1 served as the starting point for the
identification of the roadway improvement needs. Initially, a base set of improvements was
identified and tested to attempt to correct the forecast roadway deficiencies. The base network
contains the projects, which appear in the MPO’s Priority Projects list and were previously
included in the 2035 LRTP Update, as listed below.
• I-95 Interchange at Oslo Road
• Widen CR 510 from 4 to 6 lanes between CR 512 and Intracoastal Waterway
• Widen 66th Avenue from 2 to 4 lanes between 49th Street and Barber Street
• Widen Oslo Road from 2 to 4 lanes between I-95 and 58th Street
• Construct 82nd Avenue as a 2-lane facility between 26th Street and Laconia Street
• Widen CR 512 from 2 to 4 lanes between I-95 and Willow Street
• Widen US 1 from 4 to 6 lanes between 53rd Street and CR 510
[23]Roadway improvement alternatives were evaluated to identify which roadway improvements
would have the greatest impact on reducing future roadway deficiencies. A blend of two strategies
was utilized to mitigate the 2040 roadway deficiencies:
• Widen deficient corridors
• Densify roadway grid network. A well connected system of parallel roadways may help to
distribute trips and provide alternative routes. This approach may allow shorter distance
trips to remain on minor streets, preserving capacity on major streets for longer distance
trips.
Table 5-3 lists the roadway improvement projects included in the Initial Needs Plan and Figure 5-
2 illustrates the Initial Roadway Needs Plan improvements. Some facilities will operate below
LOS “D” even with the Initial Roadway Needs Plan improvements. It should be noted that
adjustments were made to the limits of the Needs Projects to provide logical termini. For example,
Figure 5-1 indicates that US 1 is deficient between 53rd Street and Barber Street. However, US
1 is recommended to be widened between 53rd Street and CR 510. CR 510 is a major east-west
corridor in the County that provides access to I-95 and the beaches. Therefore, CR 510 is a more
logical terminus for the US 1 widening than is Barber Street.
[24]Table 5- 3. 2040 Initial Needs Projects
Facility From To Improvement
New Interchange
I-95 At Oslo Road New Interchange
Widen from 2 to 4 Lanes (or equivalent capacity)*
CR 510 CR 512 Intracoastal Waterway Widen to 4L from 2L
CR 512 Willow Street I-95 Widen to 4L from 2L
27th Avenue Oslo Road St. Lucie County Line Widen to 4L from 2L
rd
43 Avenue St. Lucie County Line 26th Street Widen to 4L from 2L
66th Avenue 49th Street Barber Street Widen to 4L from 2L
26th Street/Aviation Blvd 66th Avenue US 1 Widen to 4L from 2L
Oslo Road I-95 58th Avenue Widen to 4L from 2L
Roseland Road CR 512 US 1 Widen to 4L from 2L
Widen from 4 to 6 Lanes (or equivalent capacity)*
US 1 CR 510 53rd Street Widen to 6L from 4L
CR 512 I-95 CR 510 Widen to 6L from 4L
th
Indian River Boulevard US 1/4 Street 37th Street Widen to 6L from 4L
New 2 Lanes
53rd Street 58th Avenue 82nd Avenue New 2L
82nd Avenue 26th Street Laconia Street New 2L
th
5 Street SW Old Dixie Highway 20th Avenue New 2L
* If/when the projects advance to the Project Development and Environment (PD&E) or design phase, determine if alternative
strategies such as two-way left-turn lanes, intersection improvements, operational enhancements, and multimodal solutions
would effectively address level of service and mobility needs in lieu of the recommended road widening.
[25]Figure 5-2. 2040 Initial Roadway Needs Projects
Brevard County
CR 507
Atlantic
Ocean
¯
£1
¤
CR 512
2
51
R
C
CR 510
§
¦
¨95
77TH ST
69TH ST
65TH ST
66TH AVE
A1A
CR 512
49TH ST
45TH ST
82ND AVE
58TH AVE
26TH ST
60 SR 60
16TH ST 17TH ST
12TH ST
8TH ST
A1
A
4TH ST
US 1
5TH ST SW
Legend OSLO RD
New Interchange
^
^
43RD AVE
27TH AVE
New 2 Lanes
Widen to 4 Lanes*
Widen to 6 Lanes*
St. Lucie County
*Where roadway widening is identified, determine if alternative
strategies such as two-way left-turn lanes, intersection
improvements, operational enhancements, or multimodal
solutions would effectively address level of service and
mobility needs in lieu of the recommended road widening.
Indian River County
2040 Long Range Transportation Plan UpdateAlternatives Analysis
Additional improvements were evaluated to address perceived deficiencies that are not
addressed by the Initial Needs Projects. One of the major considerations during the Alternatives
Analysis was to determine alternative roadway improvements to eliminate the need for widening
43rd Avenue to four lanes between Oslo Road and 16th Street. This analysis was performed based
on the input received during the public involvement process. Improvements to east-west and
north-south grid roads were evaluated to relieve 43rd Avenue. However, the alternatives analysis
did not demonstrate that construction of grid roads would completely eliminate the need for
improving capacity along 43rd Avenue. Additional alternatives analysis are documented in
Appendix E.
Final Roadway Needs Plan and Aspirational Projects
The Initial Needs Plan was further refined through additional analysis. The public and MPO staff
input was taken into consideration as refinements to the Initial Needs Plan were made. The Final
Roadway Needs Plan projects are summarized in Table 5-4, and Figure 5-3 illustrates the Final
Roadway Needs Plan projects.
A separate category of Aspirational Projects was identified through local agency, MPO staff and
public input. The majority of these projects may occur primarily as a result of future development
with the support of potential investments by the private sector. An example is the City of
Fellsmere’s vision to develop its annexed areas through future investments by the private sector,
which may generate the need for a future interchange at I-95 and the 53rd Street Extension. This
location was identified for an interchange based on the potential of 53rd Street to serve as a major
east-west corridor in Central Indian River County. The 53rd Street corridor is approximately
halfway between the two existing adjacent interchanges at SR 60 and CR 512. At present, the
need for this group of projects is not evident based on travel demand analysis. These Aspirational
Projects are included in Table 5-4.
[27]Table 5- 4. 2040 Final Needs Projects
Facility From To Improvement
New Interchange
I-95 At Oslo Road New Interchange
Widen from 2 to 4 Lane (or equivalent capacity)*
CR 510 CR 512 Intracoastal Waterway Widen to 4L from 2L
CR 512 Willow Street I-95 Widen to 4L from 2L
27th Avenue Oslo Road St. Lucie County Line Widen to 4L from 2L
rd
43 Avenue St. Lucie County Line 26th Street Widen to 4L from 2L
th
66 Avenue 49th Street Barber Street Widen to 4L from 2L
26th Street/Aviation Blvd 66th Avenue US 1 Widen to 4L from 2L
Oslo Road I-95 58th Avenue Widen to 4L from 2L
Roseland Road CR 512 US 1 Widen to 4L from 2L
Widen from 4 to 6 Lane (or equivalent capacity)*
US 1 CR 510 53rd Street Widen to 6L from 4L
CR 512 I-95 CR 510 Widen to 6L from 4L
Indian River Boulevard US 1/4th Street 37th Street Widen to 6L from 4L
New 2 Lanes
53rd Street 58th Avenue 82nd Avenue New 2L
82nd Avenue 26th Street Laconia Street New 2L
th
5 Street SW Old Dixie Highway 20th Avenue New 2L
th
12 Street 58th Avenue 74th Avenue New 2L
th
58 Avenue Oslo Road St. Lucie County Line New 2L
th
74 Avenue 12th Street Oslo Road New 2L
Aspirational Interchange
I-95 At 53rd Street New Interchange
Aspirational Roads
4th Street 66th Avenue 98th Avenue New 2L
13th Street SW 27th Avenue 58th Avenue New 2L
17th Street SW 27th Avenue 58th Avenue New 2L
st
21 Street SW 27th Avenue 58th Avenue New 2L
25th Street SW 27th Avenue 58th Avenue New 2L
th
26 Street 82nd Avenue CR 507 New 2L
43rd Avenue 49th Street 53rd Street New 2L
53rd Street 82nd Avenue Fellsmere N-S Road 1 New 2L
th
69 Street 82nd Avenue CR 512 New 2L
98th Avenue 12th Street 4th Street New 2L
Fellsmere N-S Road 1 CR 512 SR 60 New 2L
Fellsmere N-S Road 2 CR 512 69th Street New 2L
St. John Heritage Parkway/
CR 512 Brevard County Line New 2L
CR 512 Extension
* If/when the projects advance to the Project Development and Environment (PD&E) or design phase, determine if alternative
strategies such as two-way left-turn lanes, intersection improvements, operational enhancements, or multimodal solutions would
effectively address level of service and mobility needs in lieu of the recommended road widening.
[28]You can also read


