Spatial Distribution of Chesapeake Bay Riparian Hemlock Forests Threatened by Hemlock Woolly Adelgid
←
→
Page content transcription
If your browser does not render page correctly, please read the page content below
Journal of Forestry, 2021, 219–228
                                                                                                                       doi:10.1093/jofore/fvab001
                                                                                                 Brief Communication - geospatial technologies
                                                                                               Received June 22, 2020; Accepted January 8, 2021
                                                                                                     Advance Access publication March 3, 2021

Brief Communication - geospatial technologies

Spatial Distribution of Chesapeake Bay Riparian
Hemlock Forests Threatened by Hemlock
Woolly Adelgid

                                                                                                                                                          Downloaded from https://academic.oup.com/jof/article/119/3/219/6157792 by guest on 06 November 2021
Mary Ann Fajvan and Randall S. Morin
Mary Ann Fajvan (Maryann.Fajvan1@usda.gov), USDA Forest Service, Northern Research Station, 180 Canfield
Sreet, Morgantown, WV 26505, USA. Randall S. Morin (randall.s.morin@usda.gov), USDA Forest Service, Forest
Inventory and Analysis, 3460 Industrial Drive, York, PA 17402, USA.

Abstract
Landscape-scale maps of tree species densities are important tools for managing ecosystems
threatened by forest pests. Eastern hemlock dominates riparian forests throughout its range. As
a conifer in a deciduous landscape, hemlock plays an ecohydrological role, especially when other
species are dormant. The nonnative, hemlock woolly adelgid has caused widespread hemlock de-
cline and mortality. We used two existing basal area raster layers first to identify Chesapeake Bay
subwatersheds with ≥6 percent hemlock basal area and second to quantify hemlock basal area
densities within fixed-width riparian buffers of 50 m, 100 m, 250 m, and 500 m. Hemlock densities
were higher in riparian zones compared with entire subwatersheds. In five subwatersheds, 50 m
and 100 m zones had higher percentages of pixels with ≥25 percent hemlock basal area. We pro-
duced maps identifying hemlock riparian densities in the Pine Creek Watershed, which managers
can use to prioritize sites for supplemental conifer planting under anticipated hemlock decline.

Study Implications: Forest inventory and satellite data were used to map riparian hemlock stands
in the Pine Creek Watershed (Pennsylvania). Pine Creek is a subwatershed of the Chesapeake Bay
and an important tributary of West Branch Susquehanna River. Pine Creek headwaters are a brook
trout refuge, and hemlock shading along streams stabilizes water temperature. These fisheries
provide recreational value and economic support to local communities. Hemlock woolly adelgid, an
invasive insect, has recently entered the watershed and will cause hemlock decline and mortality.
Our maps assist the Pine Creek Watershed Council in identifying riparian areas for supplemental
planting of alternative conifer seedlings.

Keywords: eastern hemlock, Chesapeake Bay Watershed, riparian, hemlock woolly adelgid, geographic information systems

The nonnative insect, hemlock woolly adelgid (Adelges                                    ecological and hydrologic impacts from hemlock de-
tsugae) (HWA) presents a landscape-scale threat to                                       cline. Geographic information system (GIS) products
forest ecosystem health and economic viability of                                        can assist managers in synthesizing landscape-scale in-
eastern hemlock (Tsuga canadensis Ehrh.) throughout                                      ventory data to address the HWA threat to forest eco-
eastern North America. Land managers require tools                                       system function (Pontius et al. 2010).
to assess hemlock’s spatial distribution for monitoring                                     Eastern hemlock is distributed from the southern
HWA invasion and planning strategies to reduce                                           Appalachian Mountains to southeastern Canada and

Published by Oxford University Press on behalf of the Society of American Foresters 2021.                                                           219
This work is written by (a) US Government employee(s) and is in the public domain in the US.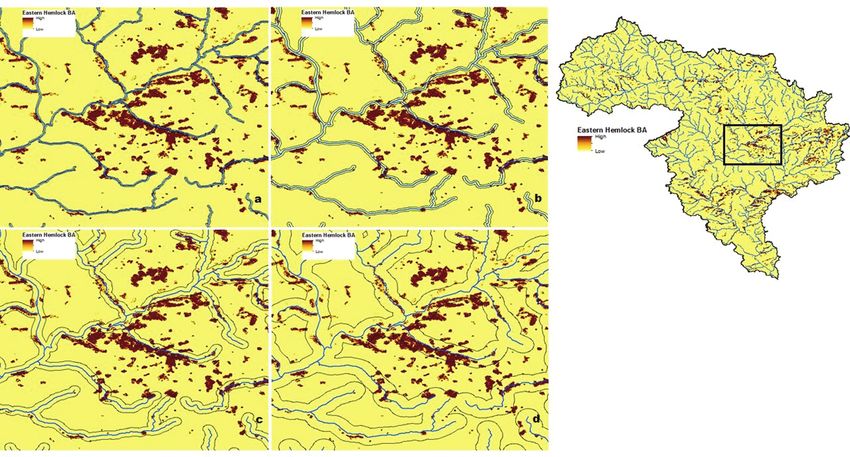
220                                                                             Journal of Forestry, 2021, Vol. 119, No. 3

westward to the central Lake States (McWilliams and         with deciduous species (Guswa and Spence 2011). The
Schmidt 2000). It is a long-lived, shade tolerant conifer   structural and transpirational characteristics of ri-
occurring in pure and mixed stands across a range of        parian hemlock stands can ameliorate the effects of ex-
primarily mesic sites (Godman and Lancaster 1990).          treme storm/flooding watershed events coinciding with
Because hemlock stands contribute unique structural         winter and early spring deciduous dormancy (Brantley
and functional landscape attributes, hemlock is con-        et al. 2014).
sidered a foundation species with a specific role in           Since its introduction in the 1950s, HWA has
ecosystem processes (Ellison et al. 2005). Hemlock’s        spread 5–20 miles per year (Evans and Gregoire
shade tolerance and slow growth habit result in dense,      2007, Morin et al. 2009), infesting hemlock in at least
multilayered canopies (Fajvan and Seymour 1993),            18 states (USDA Forest Service 2010). Widespread
which are important to terrestrial and aquatic wildlife     decline and mortality typically occur within 4–10+
habitat (Snyder et al. 2002, Tingley et al. 2002, Witt      years (McClure 1991, Eschtruth 2006). Chemical

                                                                                                                             Downloaded from https://academic.oup.com/jof/article/119/3/219/6157792 by guest on 06 November 2021
and Webster 2010).                                          HWA controls are not economically feasible at a
   Throughout its range, hemlock dominates many ri-         landscape scale and biological controls have limited
parian forests (Young et al. 2002, Vose et al. 2013),       effectiveness (Vose et al. 2013). Widespread HWA-
influencing hydrologic processes and aquatic ecosys-        mortality causes permanent reductions in winter tran-
tems. It is commonly associated with stream terrain fea-    spiration rates because of canopy replacement with
tures such as steep, northerly facing slopes and concave    deciduous species (Orwig and Foster 1998) or under-
topography (coves) in mountainous regions (Young            story Rhododendron sp. (Brantley et al. 2014).
et al. 2002). Abundant hemlock in riparian corridors           In a southern Appalachian watershed studied by
contributes to lower stream temperatures and cre-           Brantley et al. (2014), hemlock mortality contributed
ates woody debris inputs. Compared with deciduous           to permanent reductions in water yield and transient
species, stream shading by hemlock reduces summer           increases in peak flow during large-flow events. They
daily temperature maxima and increases winter daily         found significant relationships between hemlock mor-
minima (Snyder et al. 2002), which favors cold-water        tality and water yield where hemlock basal area was
fish species. In addition, benthic assemblages can be       at least 6% of total forest cover and 26% was con-
more diverse where water temperatures are thermally         centrated in riparian areas. Hence, as hemlock decline
stable (Kamler 1965). Headwater streams draining            progresses, streams draining headwater catchments
stands where hemlock composed 25–77% of total               with at least 26% riparian hemlock basal area have
basal area supported more taxa than those of hard-          potential for increased storm flow events. Mapping ri-
wood forests (Snyder et al. 2002).                          parian hemlock concentrations could assist planning
   The ecohydrological importance of hemlock-               of mitigation strategies in watersheds with anticipated
dominated riparian forests can be seasonally influ-         hemlock decline.
enced by disturbances that reduce hemlock leaf area in         Management of forest stands with hemlock basal
a deciduous landscape (Ford and Vose 2007, Brantley         areas of ≥30 ft2/ac are sufficiently stocked for silvicul-
et al. 2013, 2014). As an evergreen, hemlock transpires     tural prescriptions (Lancaster 1985) focusing on redu-
year-round but at lower rates than deciduous associ-        cing stand density to improve hemlock health under
ates (Catovsky et al. 2002) except in northernmost          threat from HWA (Fajvan 2008, Ford Miniat et al.
ranges where transpiration may be reduced during            2020). Because basal area is calculated directly from
extremely cold winter periods (Hadley 2000). In the         tree diameter, it is generally correlated with crown area
southern part of hemlock’s range, riparian and cove         (Stout and Nyland 1986), which can be estimated from
hemlocks conduct approximately 50% of their an-             remotely sensed satellite data. Forest inventory plots
nual transpiration during winter and spring (Ford and       and spatial layers of ecological characteristics have
Vose 2007). Alternatively, potential transpiration from     been combined to create raster surfaces of tree species
deciduous species is greater than hemlocks during           densities across landscapes (Ellenwood and Krist 2007,
the summer (Daley et al. 2007, Ford and Vose 2007,          Nelson et al. 2009, Wilson et al. 2012, Ellenwood et al.
Brantley et al. 2013). Structurally, dense, multilayered    2015). These spatially explicit species estimates can be
hemlock canopies have a higher leaf area index and          used for designing mitigation strategies of ecosystem
higher mean precipitation interception rates compared       processes threatened by forest pests.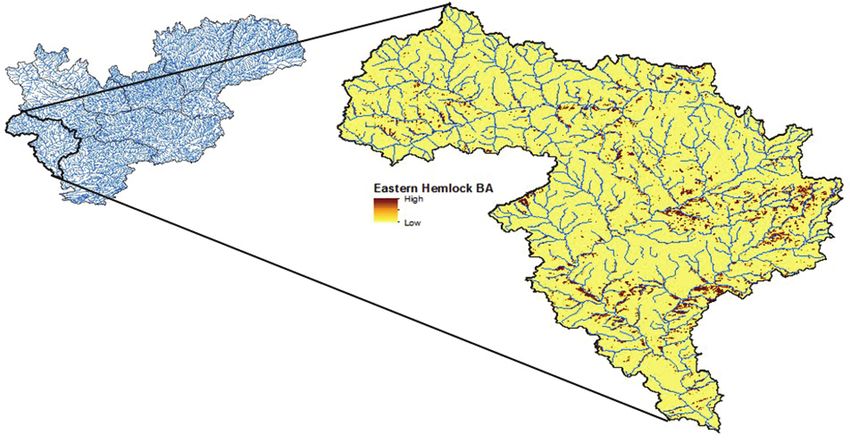
Journal of Forestry, 2021, Vol. 119, No. 3                                                                         221

Study Area: Hemlock in Subwatersheds of                      based on a tessellation into hexagons of approximately
the Chesapeake Bay                                           6,000 acres, containing at least one permanent plot
The Chesapeake Bay Watershed (CBW) encompasses               (Bechtold and Patterson 2005). Eight, hydrologic unit
more than 44 million acres and is 55% forested (Horton       code 8 (HUC8) subwatersheds where hemlock basal
2003, Sprague 2006). The CBW includes parts of six           area was ≥6% of the total forest basal area were iden-
states (Delaware, Maryland, New York, Pennsylvania,          tified in the CBW according to the FIA plot data.
Virginia, and West Virginia) and contains the largest            Secondly, we used two different raster data sets for
estuary in the United States (Horton 2003). The bay          a more spatially explicit examination of subwatershed
is a highly productive ecosystem and extremely sensi-        basal areas and hemlock distribution relative to ri-
tive to forest cover changes (Claggett et al. 2004, Lister   parian areas. The major difference between the
and Perdue 2011). Hemlock is more prevalent in the           two modeled basal area layers is the resolution:
northern region of the CBW (Lister and Lister 2012)          250 m versus 30 m. The 250 m resolution product

                                                                                                                          Downloaded from https://academic.oup.com/jof/article/119/3/219/6157792 by guest on 06 November 2021
where HWA exists in isolated stands (USDA Forest             was derived from moderate resolution imaging
Service 2015). Hemlock density specific to riparian          spectroradiometer (MODIS) (Justice et al. 1998) im-
areas in the CBW has not been previously quantified.         agery. MODIS data images were collected during the
    HWA mitigation strategies, such as planting supple-      2001 to 2006 growing seasons (Wilson et al. 2012) to
mental conifer species (Faulkenberry et al. 2019), are       estimate hemlock basal area across the United States
being planned by the Pine Creek Watershed Council            using a pixel size of 250 m (Figure 1). Geospatial data
(Tioga, Potter, Lycoming Counties) in Pennsylvania,          are publicly available in the Forest Service Research
to maintain thermal refuges for naturally reproducing        Data Archive (Wilson et al. 2013). The 30 m hem-
trout populations. Pine Creek is a subwatershed of           lock basal area surfaces were spatially derived using
the CBW and the second largest tributary of the West         three-season Landsat imagery and modeled individu-
Branch Susquehanna River. The Pine Creek Watershed           ally within US Geological Survey (USGS) National
covers 981 square miles with 17 subbasins and a total        Land Cover Dataset mapping zones (Ellenwood et al.
of 1623 miles of streams. More than half of the land is      2015) and are available upon request from the USDA
publicly owned and approximately 93% is forested.            Forest Health Assessment and Applied Sciences Team
    Our objectives are to use data from the Forest           (Ellenwood and Krist 2007).
Inventory and Analysis (FIA) program of the USDA                 The two map products were created by applying a
Forest Service, spatially explicit hemlock density data,     spatial model to a stack of geospatial layers including
and geospatial hydrology data to (1) identify CBW            the FIA plots, satellite imagery, and other ecological
subwatersheds with ≥6% mean hemlock basal areas              variables, such as slope, aspect, and soil characteris-
and compare with hemlock percentages in their riparian       tics. Because basal area is correlated with crown area,
zones; (2) quantify riparian zones in the identified CBW     it is also correlated with spectral forest characteristics
subwatersheds that contain ≥25 percent hemlock basal         measured with satellite-based sensors (Wilson et al.
area to determine those zones most vulnerable to HWA         2012). FIA full-cycle plot data ending in the year 2009
impacts; (3) identify the location of CBW riparian stands    were used as model inputs and included trees ≥1 inch in
with a significant hemlock component (containing ≥30         diameter measured at breast height (dbh) (Wilson et al.
ft2/ac hemlock basal area; previously defined as stocking    2013). Both modeled products (250 m and 30 m)1 in-
threshold for management purposes) for HWA man-              cluded accuracy assessments where species without ad-
agement purposes; and (4) use these techniques to            equate FIA samples for model parameterization were
map riparian hemlock stands in headwater tributaries         removed (Wilson et al. 2012, Ellenwood et al. 2015).
of the Pine Creek Watershed. In objective 2, the ≥25%            MODIS-based raster layers (250 m) of hemlock basal
hemlock basal area threshold was based on the 26%            area (per acre), and the National Hydrography Dataset
riparian hemlock basal area concentrations found to          (NHD) (USGS 2016) were used to categorize total forest
impact hydrologic processes in HWA-disturbed hem-            basal area, hemlock basal area, and percent hemlock
lock stands (Brantley et al. 2014).                          basal area. The eight “high hemlock” HUCs were further
                                                             examined according to geographic features associated
                                                             within increasing distances from first-order and higher
Methods                                                      perennial streams (riparian zones) (Figure 2). These same
For the first part of our analyses, we used FIA inven-       data were buffered at 250 m and 500 m (inclusive) from
tories of forest attributes. FIA samples the United States   streams and the mean percentage hemlock basal areas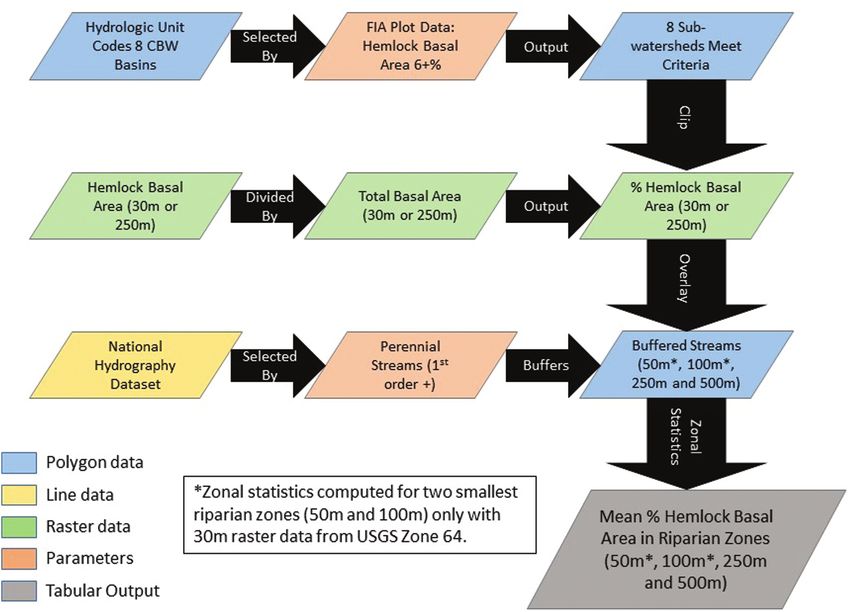
222                                                                               Journal of Forestry, 2021, Vol. 119, No. 3

                                                                                                                               Downloaded from https://academic.oup.com/jof/article/119/3/219/6157792 by guest on 06 November 2021
Figure 1. Percent eastern hemlock basal area from raster data modeled using 2009 Forest Inventory and Analysis plot data
and a pixel size of 250 m (Wilson et al. 2012). Hemlock density within Chesapeake Bay Watershed is indicated.

Figure 2. GIS procedure for estimating percent hemlock basal area per acre in riparian zones (50 m, 100 m, 250 m, 500
m) of Chesapeake Bay subwatersheds with at least 6% hemlock basal area. Raster layers of 250 m and 30 m were used to
model basal area at two spatial scales.

(per acre) for these zones were calculated (Figure 2).           Five subwatersheds were further examined at a
Five hundred meters was the maximum distance tested           finer spatial resolution (30 m) to determine riparian
because of potential overlap with adjacent tributaries.       zone sizes most likely to contain ≥25% hemlock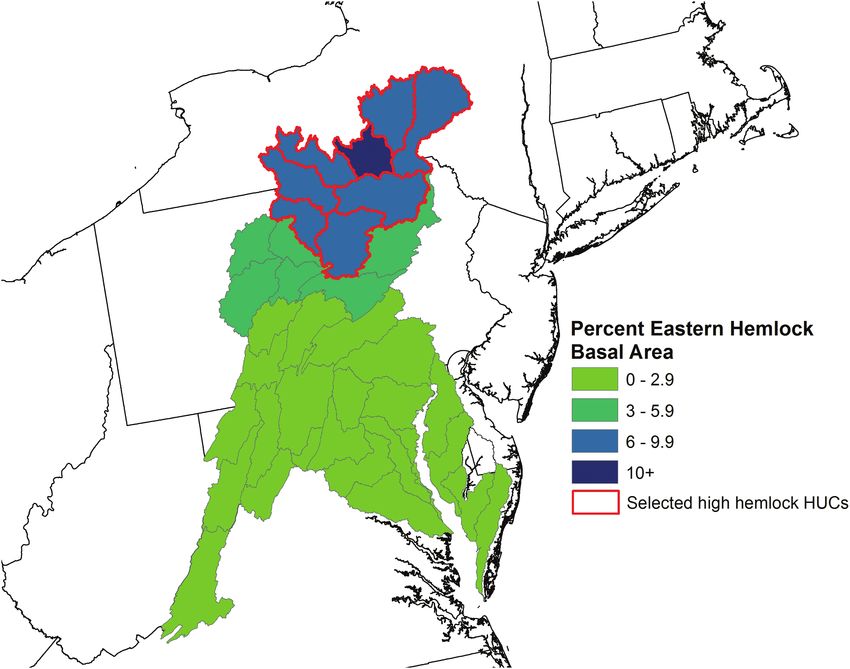
Journal of Forestry, 2021, Vol. 119, No. 3                                                                         223

basal area. Because the 30 m data are available                 For the five watersheds evaluated at 30 m resolution,
for download for individual USGS mapping zones,              the percentages of riparian zone pixels containing ≥25
we used zone 64, which contained the Pine Creek              percent hemlock basal area were always higher than
Watershed (for our case study) and four adjacent             mean percentages for the entire watershed (Table 2).
HUC8 subwatersheds. For these five subwatersheds,            The 50 m and 100 m riparian zones had higher per-
we used the interpolated raster layers to estimate           centages of pixels meeting these criteria and decreased
hemlock basal area in riparian zones at four spatial         as pixels in the 250 m and 500 m zones were included
scales. Perennial streams from the NHD were buf-             (Table 2, Figure 5). At 500 m, the percentages of pixels
fered at distances of 50, 100, 250, and 500 meters           were similar to the overall averages for the watersheds.
(Figure 2). We also compared riparian zone locations            Comparisons of riparian zones with mean hemlock
of forest patches containing hemlock basal areas of          basal areas ≥30 ft2/ac did not show a similar pattern to
≥30 ft2/ac.                                                  percent basal area. Mean basal areas for each zone were

                                                                                                                          Downloaded from https://academic.oup.com/jof/article/119/3/219/6157792 by guest on 06 November 2021
                                                             very similar to the overall watershed mean (Table 3).
                                                             Maximum total watershed hemlock basal areas
Results                                                      ranged from 70 to 99 ft2/ac, suggesting the presence of
Hemlock basal area in the CBW is concentrated in             some overstocked stands. Mixed hemlock-hardwood
northern Pennsylvania and southern New York, where           stands can be considered fully to overstocked if there
HWA has had minor impacts to date (USDA Forest               is at least 30% hemlock basal area of a total ran-
Service 2015). Our study area is defined as the eight        ging from 140 to 200 ft2/ac depending on mean stand
subwatersheds with mean percent hemlock basal                diameter (Lancaster 1985).
areas from 6.2 to 10.2, which met the criteria of ≥6%
(Figures 3 and 4). Mean percent hemlock basal area
                                                             Discussion
remained generally the same as riparian zone size in-
creased from 250 m to 500 m and was similar to the           Natural resource managers typically integrate chem-
overall average (Table 1).                                   ical, biological, and silvicultural applications to slow

Figure 3. Percent eastern hemlock basal area per acre by hydrologic unit code 8 (HUC8) subwatersheds in Chesapeake Bay
Watershed. The study area includes the eight subwatersheds outlined in red because each met the criteria of ≥6% hemlock
basal areas as identified from Forest Inventory and Analysis plot data.
224 Journal of Forestry, 2021, Vol. 119, No. 3
Downloaded from https://academic.oup.com/jof/article/119/3/219/6157792 by guest on 06 November 2021
Figure 4. Perennial streams identified on the eight hydrologic unit code 8 (HUC8) subwatersheds with hemlock basal areas
≥6 percent. The mean percentage hemlock basal areas per acre for riparian zones were calculated (250 m resolution). Pine
Creek Watershed displayed as example of mapping percent hemlock basal area in riparian zones (30 m resolution) ranging
from high (≥25 percent) to low (zero).
Table 1. Mean basal areas per acre (BA) (±STD) for all species (total) and for hemlock in eight
subwatersheds of the Chesapeake Bay evaluated at 250 m pixel resolution. Mean percent hemlock basal
areas per acre (±STD) for entire subwatershed and two riparian buffer zones (inclusive).
Percent Hemlock Basal Area
Hemlock 500 m
Watershed Total BA (ft2/ac) BA (ft2/ac) Entire Watershed 250 m (820 ft) (1,640 ft)
Chemung 60.3 (35.9) 5.8 (8.6) 8.1 (9.7) 7.9 (9.6) 8.1 (9.7)
Chenango 67.6 (37.7) 7.3 (10.1) 9.2 (9.8) 9.3 (9.7) 9.2 (9.8)
Low West Branch Susquehanna 70.6 (42.6) 4.8 (7.5) 6.2 (8.2) 6.9 (8.6) 6.5 (8.4)
Owego-Wappasening 66.3 (36.6) 7.8 (9.9) 10.2 (10.5) 10.4 (10.8) 10.4 (10.6)
Pine Creek 94.7 (34.8) 5.9 (7.7) 6.5 (7.7) 6.5 (7.8) 6.3 (7.6)
Tioga 66.6 (38.1) 5.7 (7.8) 7.7 (9.0) 7.8 (9.3) 7.8 (9.1)
Upper Susquehanna 70.6 (37.8) 7.1 (9.4) 8.7 (9.3) 9.3 (9.5) 8.9 (9.4)
Upper Susquehana-Tunkhannock 64.1 (37.2) 5.8 (7.6) 8.6 (9.5) 8.6 (9.7) 8.6 (9.6)
Note: STD, standard deviation.
Table 2. Mean percentage of pixels containing ≥25 percent hemlock basal area for the five subwatersheds
evaluated using 30 m pixel resolution. Pixels were evaluated for the entire watershed and four riparian
buffer zones (inclusive).
Watershed Total Watershed 50 m (164 ft) 100 m (328 ft) 250 m (820 ft) 500 m (1,640 ft)
Chemung 5.1 6.6 7.1 6.4 5.2
Owego-Wappasening 11.0 19.0 18.7 14.8 11.8
Pine Creek 5.3 12.3 11.1 8.3 6.3
Tioga 5.7 12.7 11.8 8.9 6.6
Upper Susquehana-Tunkhannock 12.9 22.6 21.5 17.3 14.0
HWA spread and reduce ecological impacts (Ford 2010) and more challenging across land ownerships
Miniat et al. 2020). HWA management efforts are within the larger forested landscape of hemlock’s range.
easier to facilitate at the stand level (e.g., Pontius et al. We initially assessed the extent of hemlock abundanceJournal of Forestry, 2021, Vol. 119, No. 3 225
Downloaded from https://academic.oup.com/jof/article/119/3/219/6157792 by guest on 06 November 2021
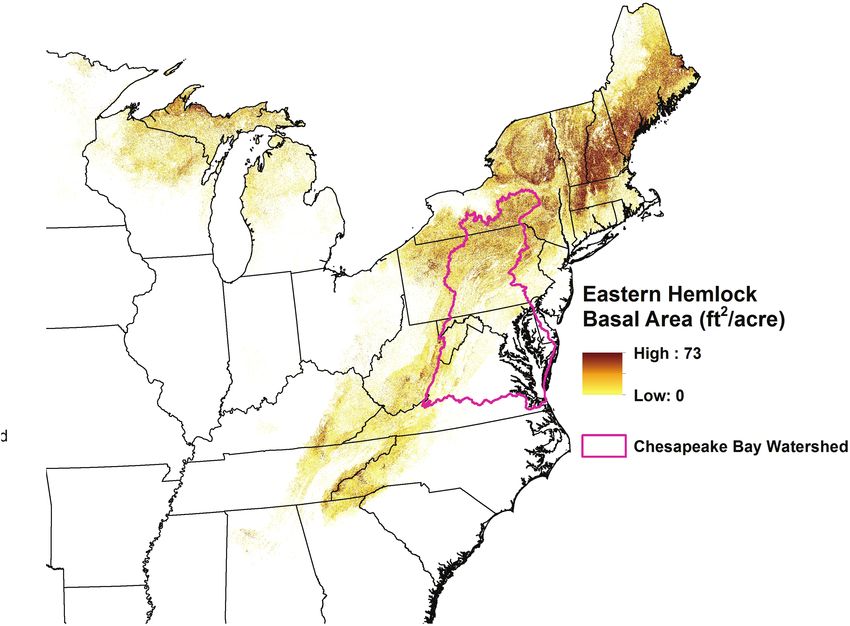
Figure 5. Hemlock basal area (30 m resolution) in riparian zones of the Pine Creek Watershed (from left to right): 50 m,
100 m, 250 m, and 500 m. For all five watersheds evaluated at this scale, the percentage of pixels with ≥25 percent basal
area was concentrated within 100 m.
Table 3. Mean hemlock basal areas (±STD) for pixels containing ≥30 ft2/ac in five subwatersheds evaluated
using 30 m pixel resolution. Pixel were evaluated for the entire watershed and four riparian buffer zones
(inclusive) using 30 ft2/ac (minimum) and maximum values as indicated.
Watershed Total Watershed 50 m (164 ft) 100 m (328 ft) 250 m (820 ft) 500 m (1,640 ft)
Chemung 35.9 (6.7) 35.8 (6.3) 35.8 (6.5) 35.6 (6.4) 35.9 (6.7)
Maximum 70 65 65 69 69
Owego-Wappasening 36.3 (7.0) 36.7 (7.4) 36.6 (7.3) 36.4 (7.1) 36.4 (7.1)
Maximum 89 89 89 89 89
Pine Creek 36.6 (7.4) 36.9 (7.5) 37.1 (7.7) 36.9 (7.7) 36.7 (7.5)
Maximum 79 73 77 77 77
Tioga 36.3 (7.1) 37.0 (7.5) 37.0 (7.4) 36.7 (7.3) 36.4 (7.0)
Maximum 79 69 75 75 75
Upper Susquehana-Tunkhannock 38.6 (8.8) 39.2 (9.0) 39.2 (9.1) 39.0 (9.0) 38.7 (8.8)
Maximum 99 82 88 99 99
Note: STD, standard deviation.
within the CBW by mapping species density at a broad eight most northern subwatersheds where HWA in-
landscape scale (250 m) (Wilson et al. 2013). Analysis festations are light (Sarah Johnson, pers. commun., PA
of FIA data allowed us to identify subwatersheds with Bureau of Forestry, 2017–2019 regional survey data),
high overall hemlock densities. Further delineation of primarily because frequent colder minimum temper-
high hemlock concentrations in riparian areas was ac- atures contribute to HWA population crashes (Evans
complished using existing remote sensing–based maps. and Gregoire 2007, Morin et al. 2009). However,
Although some spatial detail was initially lost by using temporal variations in annual HWA winter survival
MODIS compared with Landsat data (250 m versus 30 rates because of climate warming have accelerated
m resolution), MODIS data allow users to efficiently its northward progression into New York and New
produce maps of larger geographic areas with fewer England (USDA Forest Service 2015) where high hem-
cloud contamination issues (Nelson et al. 2009). lock densities (Figure 1) increases the urgency for
The first stage of the analyses used FIA plot data to management.
identify hemlock densities in CBW subwatersheds that Other studies examining the influence of hem-
met the >6% basal area criteria. Results identified the lock densities (≥25 percent basal area) on hydrologic226 Journal of Forestry, 2021, Vol. 119, No. 3
processes focused on stand-level water budgets and did coniferous and broad-leaved tree species. Can. J. For. Res.
not examine hemlock density and distribution specific to 32:295–309.
riparian zones (Ford and Vose 2007, Brantley et al. 2014). Claggett, P.R., C.A. Jantz, S.J. Goetz, and C. Bisland. 2004.
We compared hemlock densities in zone sizes from 50 to Assessing development pressure in the Chesapeake Bay
watershed: An evaluation of two land-use change models.
500 m at two spatial scales. At the finer spatial resolution
Environ. Monit. Assess. 94:129–146.
(30 m), we detected higher hemlock densities within 100
Daley, M.J., N.G. Phillips, C. Pettijohn, and J.L. Hadley.
m of streams. This zone is more likely to have negative
2007. Water use by eastern hemlock (Tsuga canadensis)
HWA-caused hydrologic/ecological impacts and could and black birch (Betula lenta): Implications of ef-
be targeted for mitigation efforts. Depending on the fects of the hemlock woolly adelgid. Can. J. For. Res.
watershed, there were some riparian hemlock clusters/ 37:2031–2040.
stands with sufficient hemlock basal areas for silvicul- Ellenwood, J.R., and F.J. Krist Jr. 2007. Building a nationwide
tural thinnings. Hemlock density reductions in fully to 30-meter forest parameter dataset for forest health risk as-
Downloaded from https://academic.oup.com/jof/article/119/3/219/6157792 by guest on 06 November 2021
overstocked hemlock-hardwood stands increases sun- sessments. In: Proc. ForestSat 2007 Conference, “Forests,
light to hemlock crowns (Fajvan 2008) and improves re- remote sensing and GIS: Methods and operational tools,”
sistance to HWA (Ford Miniat et al. 2020). Montpellier, France, November 5–7, 2007. USDA Forest
The maps/data we provided to the Pine Creek Service, Forest Health Technology Enterprise Team, Fort
Collins, CO. 6 p.
Watershed Council were used to prioritize ri-
Ellenwood, J.R., F.J. Krist Jr., and S.A. Romero. 2015.
parian areas for digital field reconnaissance of hem-
National individual tree species atlas. FHTET-15-
lock densities using ArcGIS Survey 123 (Esri 2019).
01. USDA Forest Service, Forest Health Technology
A custom spatial vegetation smart form linking GPS Enterprise Team, Fort Collins, CO. 168 p. Available on-
information with forest inventory parameters was de- line at https://www.fs.fed.us/foresthealth/technology/
signed for data collection. The council is devising a pdfs/FHTET_15_01_National_Individual_Tree_Species_
protocol for proactive, supplemental riparian planting Atlas_Spread.pdf; last accessed February 11, 2018.
of other shade-tolerant conifers based on species re- Ellison, A.M., M.S. Bank, B.D. Clinton, E.A. Colburn,
commendations from Pennsylvania’s hemlock conser- K.J. Elliott, C.R. Ford, D.R. Foster, et al. 2005. Loss of foun-
vation plan (Faulkenberry et al. 2019). Their goal is dation species: Consequences for the structure and dynamics
to protect thermal refuges of native brook trout and of forested ecosystems. Front. Ecol. Environ. 9:479–486.
other aquatic species and retain watershed ecological Eschtruth, A.K., N.L. Cleavitt, J.J. Battles, R.A. Evans,
and T.J. Fahey. 2006. Vegetation dynamics in declining
and economic values under threat from HWA.
eastern hemlock stands: 9 years of forest response to
hemlock woolly adelgid infestations. Can. J. For. Res.
Endnotes 36:1435–1450.
1. The Landsat and MODIS sensors collect data at resolutions Esri. 2019. ArcGIS Survey 123. Available online at https://
defined in term of meters. English conversions for the rest of www.esri.com/en-us/arcgis/products/arcgis-survey123/
the manuscript: 30 m = 98.4 ft; 50 m = 164.0 ft; 100 m = 328.1 ft; overview; last accessed July 20, 2019.
250 m = 820.2 ft; 500 m = 1,640.4 ft. Evans, A.M., and T.G. Gregoire. 2007. A geographically
variable model of hemlock woolly adelgid spread. Biol.
Invasions 9:1387–3547.
Literature Cited Fajvan, M.A. 2008. The role of silvicultural thinning in
Bechtold, W.A., and P.L. Patterson, (eds.). 2005. Forest inven- eastern forests threatened by hemlock woolly adelgid. P.
tory and analysis national sample design and estimation 247–256 in Integrated restoration of forested ecosystems
procedures. USDA Forest Service Gen. Tech. Rep. SRS- to achieve multi-resource benefits: Proc. 2007 National
GTR-80, Southern Research Station, Asheville, NC. 85 p. Silviculture Workshop, R. Deal (ed.). USDA Forest Service
Brantley, S., C.R. Ford, and J.M. Vose. 2013. Future spe- Gen. Tech. Rep. PNW-GTR-733, Pacific Northwest
cies composition will affect forest water use after loss of Research Station, Portland, OR.
eastern hemlock from southern Appalachian forests. Ecol. Fajvan, M.A., and R.S. Seymour. 1993. Canopy stratifica-
Appl. 23(4):777–790. tion, age structure, and development of multicohort
Brantley, S.T., C. Ford Miniat, K.J. Elliott, S.H. Laseter, and stands of eastern white pine, eastern hemlock, and red
J.M. Vose. 2014. Changes to southern Appalachian water spruces. Can. J. For. Res. 23:1799–1809.
yield and stormflow after loss of a foundation species. Faulkenberry, M., J.S. Eggen, and E. Shultzabarger (comps.).
Ecohydrology 8(3):777–790. 2019. Eastern hemlock conservation plan. Pennsylvania
Catovsky, S., N.M. Holbrook, and F.A. Bazazz. 2002. Coupling Department of Conservation and Natural Resources,
whole-tree transpiration and canopy photosynthesis in Bureau of Forestry, Harrisburg, PA. 114 p.Journal of Forestry, 2021, Vol. 119, No. 3 227
Ford, C.R., and J.M. Vose. 2007. Tsuga canadensis (L.) D.R. Souto (eds.). USDA Forest Service Gen. Tech. Rept.
Carr. mortality will impact hydrologic processes in 267, Northern Research Station, Newtown Square, PA.
southern Appalachian forest ecosystems. Ecol. Appl. Morin, R.S., A.M. Liebhold, and K.W. Gottschalk. 2009.
17(4):1156–1167. Anisotropic spread of hemlock woolly adelgid in the
Ford Miniat, C., D.R. Zietlow, S.T. Brantley, C.L. Brown, eastern United States. Biol. Invasions 11:2341–2350.
A.E. Mayfield, R.M. Jetton, J.R. Rhea, and P. Arnold. Nelson, M.D., R.E. McRoberts, G.R. Holden, and
2020. Physiological responses of eastern hemlock (Tsuga M.E. Bauer. 2009. Effects of satellite image spatial aggre-
canadensis) to light, adelgid infestation, and biological gation and resolution on estimates of forest land area. Int.
control: Implications for hemlock restoration. For. Ecol. J. Remote Sens. 30(8):1913–1940.
Manage. 460:117903. Orwig, D.A., and D.R. Foster. 1998. Forest response to the
Godman, R.M., and K. Lancaster. 1990. Tsuga canadensis introduced hemlock woolly adelgid in southern New
(L.) Carr. eastern hemlock. P. 604–612 in Conifers. England, U.S.A. J. Torrey Bot. Soc. 125:60–73.
Vol. 1 of Silvics of North America, R.M. Burns, and Pontius, J.A., R. Hallett, M. Martin, and L. Plourde. 2010. A
Downloaded from https://academic.oup.com/jof/article/119/3/219/6157792 by guest on 06 November 2021
B.H. Honkala (eds.). Agriculture Handbook 654. USDA landscape-scale remote sensing/GIS tool to assess eastern
Forest Service, Washington, DC. hemlock vulnerability to hemlock woolly adelgid-induced
Guswa, A.J, and C.M. Spence. 2011. Effect of throughfall decline. P. 657–671 in Advances in threat assessment and
variability on recharge: Application to hemlock and de- their application to forest and rangeland management,
ciduous forests in western Massachusetts. Ecohydrology Vol. 1, J.M. Pye, H.M. Rauscher, Y. Sands, D.C. Lee, and
8(3):563–574. J.S. Beatty (eds.). USDA Forest Service Gen. Tech. Rep.
Hadley, J.L. 2000. Effect of daily minimum temperature on PNW-GTR-802, Pacific Northwest Research Station,
photosynthesis in eastern hemlock (Tsuga canadensis L.) in Portland, OR.
autumn and winter. Arct. Antarct. Alp. Res. 32:368–374. Snyder, C.D., J.A. Young, D.P. Lemarie, and D.R. Smith.
Horton, T. 2003. Turning the tide: Saving the Chesapeake 2002. Influence of eastern hemlock (Tsuga canadensis)
Bay. 2nd ed. Chesapeake Bay Foundation, Island Press, forests on aquatic assemblages in headwater streams.
Washington, DC. 377 p. Can. J. Fish. Aquat. Sci. 59:262–275.
Justice, C., E. Vermote, J.R.G. Townshend, R. Defries, Sprague, E. 2006. The state of Chesapeake forests. The
D.P. Roy, D.K. Hall, V.V. Salomonson, et al. 1998. Conservation Fund, Arlington, VA. 144 p.
The moderate resolution imaging spectroradiometer Stout, S.L., and R.D. Nyland. 1986. Role of species compos-
(MODIS): Land remote sensing for global change ition in relative density measurement in Allegheny hard-
research. IEEE Trans. Geosci. Remote Sens. woods. Can. J. For. Res. 16(3):574–579.
36(4):1228–1249. Tingley, M.W., D.A. Orwig, R. Field, and G. Motzkin.
Kamler, E. 1965. Thermal conditions in mountain waters 2002. Avian response to removal of a forest dominant:
and their influence on the distribution of Plecoptera and Consequences of hemlock woolly adelgid infestations. J.
Ephemeroptera larvae. Ekol. Pol. Ser. A. 13:377–414. Biogeogr. 29:1505–1516.
Lancaster, K.F. 1985. Managing eastern hemlock: A prelim- USDA Forest Service. 2010. Hemlock woolly adelgid risk de-
inary guide. USDA Forest Service NA-FR-30, Northeastern tection and spread. Available online at https://www.nrs.
Area, Radnor, PA. 5 p. fs.fed.us/disturbance/invasive_species/hwa/risk_detec-
Lister, T.W., and A.J. Lister. 2012. Comparison of forest tion_spread/; last accessed June 20, 2018.
area data in the Chesapeake Bay Watershed. P. 29–35 USDA Forest Service. 2015. Landscape estimates of hemlock
in Moving from status to trends: Forest Inventory and woolly adelgid survival and potential range. Available
Analysis (FIA) symposium 2012, R.S. Morin, G.C. Liknes online at https://www.nrs.fs.fed.us/disturbance/invasive_
(comps). USDA Forest Service GTR-NRS-P-105, Northern species/hwa/risk_detection_spread/ range/; last accessed
Research Station, Newtown Square, PA. December 15, 2019.
Lister, T.W., and J. Perdue. 2011. Maryland’s forest re- US Geological Survey. 2016. National Hydrography Dataset
sources, 2010. USDA Forest Service Res. Note. NRS-124, (NHD) FileGDB 10.1. Available online at ftp://rockyftp.
Northern Research Station, Newtown Square, PA. 4 p. cr.usgs.gov/vdelivery/Datasets/Staged/Hydrography/
McClure, M.S. 1991. Density-dependent feedback and popu- NHD/National/HighResolution/GDB/NHD_H_
lation cycles in Adelges tsugae (Homoptera: Adelgidae) National_GDB.zip; last accessed July 6, 2018.
on Tsuga canadensis. Environ. Entomol. 20:258–264. Vose, J.M., D.N. Wear, A.E. Mayfield III, and C. Dana Nelson.
McWilliams, W.H., and T.L. Schmidt. 2000. Composition, 2013. Hemlock woolly adelgid in the southern
structure and sustainability of hemlock ecosystems Appalachians: Control strategies, ecological impacts,
in eastern North America. P. 5–10 in Proceedings: and potential management responses. For. Ecol. Manage.
Symposium on sustainable management of hemlock 291:209–219.
ecosystems in eastern North America, June 22–24, Wilson, B.T., A.J. Lister and R.I. Riemann. 2012. A nearest-
1999, Durham, NH, K.A. McManus, K.S. Shields, and neighbor imputation approach to mapping tree species228 Journal of Forestry, 2021, Vol. 119, No. 3
over large areas using forest inventory plots and moderate Witt, J.C., and C.R. Webster. 2010. Regeneration dynamics
resolution raster data. For. Ecol. Manage. 271:182–198. in remnant Tsuga canadensis stands in the northern Lake
Wilson, B.T., A.J. Lister, R.I. Riemann, and D.M. Griffith. States: Potential direct and indirect effects of herbivory.
2013. Live tree species basal area of the contiguous United For. Ecol. Manage. 260(4):519–525.
States (2000–2009). USDA Forest Service, Rocky Mountain Young, J.A., D.R. Smith, C.D. Snyder, and D.P. Lemarie.
Research Station, Newtown Square, PA. Available online 2002. A terrain-based paired-site sampling design to as-
at https://doi.org/10.2737/RDS-2013-0013; last accessed sess biodiversity losses from eastern hemlock decline.
October 2017. Environ. Monit. Assess. 76:167–183.
Downloaded from https://academic.oup.com/jof/article/119/3/219/6157792 by guest on 06 November 2021You can also read