Spatial distribution of manganese concentration and load in street dust in Mexico City
←
→
Page content transcription
If your browser does not render page correctly, please read the page content below
Spatial distribution of manganese in street dust                                                                           Artículo original

                 Spatial distribution of manganese
                  concentration and load in street
                        dust in Mexico City
                  Anahí Aguilera, MSc,(1,2) Francisco Bautista, MSc, PhD,(1) Avto Gogichaichvili, MSc, PhD,(1)
Margarita Eugenia Gutiérrez-Ruiz, MSc, PhD,(3) Águeda E Ceniceros-Gómez, MSc, PhD,(3) Norma Ruth López-Santiago, MSc.(3)

                      Aguilera A, Bautista F, Gogichaichvili A,                 Aguilera A, Bautista F, Gogichaichvili A,
                   Gutiérrez-Ruiz ME, Ceniceros-Gómez AE,                       Gutiérrez-Ruiz ME, Ceniceros-Gómez AE,
                                          López-Santiago NR.                    López-Santiago NR.
             Spatial distribution of manganese concentration                    Distribución espacial de las concentraciones y carga de
                        and load in street dust in Mexico City.                 manganeso en el polvo urbano de la Ciudad de México.
                          Salud Publica Mex. 2020;62:147-155.                   Salud Publica Mex. 2020;62:147-155.
                                       https://doi.org/10.21149/10577           https://doi.org/10.21149/10577

Abstract                                                                        Resumen
Objective. To obtain a first indication of the distribution                     Objetivo. Obtener una primera aproximación sobre la
and extent of manganese (Mn) contamination in Mexico City.                      distribución espacial de la contaminación por manganeso
Mn concentration and load in street dust were analyzed in                       (Mn) en la Ciudad de México. Se analizó la concentración y
order to reveal the most contaminated areas. Materials                          carga de Mn en el polvo de la calle para identificar las áreas
and methods. 482 samples of street dust were analyzed                           más contaminadas. Material y métodos. 482 muestras
through inductively coupled plasma-optical emission spec-                       de polvo de la calle fueron analizadas con espectroscopía de
troscopy. The contamination factor (CF), the geoaccumula-                       emisión por plasma de acoplamiento inductivo. Se calculó el
tion index (Igeo) and the spatial interpolations of the kriging                 factor de contaminación, índice de geoacumulación, y las in-
indicator were calculated. Results. A slight influence of                       terpolaciones espaciales del indicador kriging. Resultados.
anthropogenic activities is detected on the Mn content of                       Existe una ligera influencia de actividades antropogénicas en
street dust. The highest levels of pollution by concentra-                      el contenido de Mn del polvo de la calle. Los niveles más altos
tion (Igeo=uncontaminated to moderately contaminated) are                       de contaminación por concentración (Igeo=no contaminado
grouped towards the city’s north (industrial) and center                        a moderadamente contaminado) se agruparon en el norte
(commercial and high traffic) areas. The areas with the high-                   (industrial) y centro (comercial y de alto tráfico) de la ciudad.
est Mn load were located towards the east and northwest                         Las áreas con las cargas de Mn más altas estuvieron al este y
areas (Igeo=moderately contaminated). Conclusions. These                        noroeste (Igeo=moderadamente contaminado), donde había
findings will serve as a baseline to assess future variations in                más polvo. Conclusiones. Estos resultados servirán como
Mn content in Mexico City’s environment.                                        punto de referencia para evaluar variaciones futuras en el
                                                                                contenido de Mn en la Ciudad de México.

Keywords: manganese; environmental pollution; dust                              Palabras clave: manganeso; contaminación ambiental; polvo

(1) Laboratorio Universitario de Geofísica Ambiental, Centro de Investigaciones en Geografía Ambiental, Universidad Nacional Autónoma de México.
    Morelia, Mexico.
(2) Posgrado en Ciencias Biológicas, Universidad Nacional Autónoma de México. Mexico City, Mexico.
(3) Laboratorio de Biogeoquímica Ambiental, Facultad de Química, Universidad Nacional Autónoma de México. Mexito City, Mexico.

                                            Received on: May 3, 2019 • Accepted on: October 7, 2019
               Corresponding author: Dr. Francisco Bautista. Antigua Carretera a Pátzcuaro 8701, col. Ex Hacienda de San José de la Huerta.
                                                           58190 Morelia, Michoacán, Mexico.
                                                              email: leptosol@ciga.unam.mx

salud pública de méxico / vol. 62, no. 2, marzo-abril de 2020                                                                                      147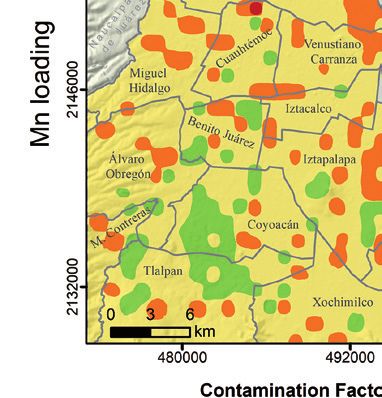
Artículo original                                                                                         Aguilera A y col.

S   cientific concern about the contamination due to
    manganese (Mn) has been raised because of its
increasing presence in the environment, related to              Sampling
                                                                              Materials and methods
anthropogenic sources such as mining and smelting,1
Mn alloy production,2,3 welding, dry alkaline battery           Systematic sampling was designed for a 703 km2 area
manufacturing, Mn salt production, ceramics, glass,             (figure 1). We collected 482 street dust samples during
aluminum cans and electronic components manufac-                the dry season (March to April 2017) in a 1 m2 area in
ture,4 agrochemicals containing Mn such as fungicides           the streets, next to the sidewalks. Stones, leaves, and
and fertilizers,5 as well as vehicle emissions.6                branches were removed. Dust was gathered in four
     The phasing out of lead compounds from gasoline            mounds at the ends of each street block. Then it was
has led to the use of other compounds that have anti-           collected with plastic tools and deposited in labeled and
knock characteristics, such as the methylcyclopentadi-          georeferenced polyethylene bags. Dust samples were
enyl manganese tricarbonyl (MMT).4,7 MMT is quickly             dried for two weeks under the shade at room tempera-
converted to complex manganese phosphate, sulfate               ture to avoid metal oxidation. They were sieved with a
(MnSO4) and oxides (most likely Mn3O4). From these              250 µm mesh and then weighed.
compounds, MnSO4 generates the highest Mn concen-
tration in the brain after inhalation, because it is the most
soluble of all compounds.8
     Under conditions of high exposure via ingestion or
inhalation, the human system that regulates Mn levels
appears to fail, thus Mn accumulates in the brain and
other tissues, generating potentially toxic effects.6,8 This
accumulation can even occur at low levels of airborne
Mn during long-term exposure because Mn clearance
in the brain seems to be slow.4,9
     The main effects of long-term exposure to inorganic
Mn include neurological manifestations and biochemi-
cal alterations: in the initial stages of the disorder one
may find reduced response speed, irritability, intellec-
tual deficit, mood changes and compulsive behaviors
to more prominent and irreversible extrapyramidal
dysfunction resembling Parkinson disease upon pro-
tracted exposure.9
     Recently, medical concern has been raised in Mexico
City because children and youth are already exhibiting
early Parkinson disease neuropathological hallmarks.10
Mn could be a cause; however, there is no information on
Mn concentration amounts in Mexico City’s environment.
     Mexico City has more than 20 million inhabitants,
53 000 industries and approximately 5 million vehicles.
Settled street dust constitutes a good surrogate for air
pollution. It is easy to sample and manipulate, and it
reflects the potential risk of population exposure.11,12 Mn
in street dust can be estimated as concentration (mg/
kg), as load per area unit (mg/m2) or as rate load (mg/
m2/30 days). All these measurements turn up important
information.2,5
     In order to obtain the first indicator of pollution
extent and distribution in Mexico City’s urban environ-
ment, we chose to examine Mn concentration and load
in the city’s street dust, as well as to identify the most      Figure 1. Sampling sites of street dust in Mexico
contaminated areas.                                             City, 2017

148                                                                   salud pública de méxico / vol. 62, no. 2, marzo-abril de 2020
Spatial distribution of manganese in street dust Artículo original
Chemical analysis City, the world background values for soils14 or even the
minimum value of the study data have been used.15 To
Mn total concentration was determined in street dust obtain the background value, we decided to normalize
by inductively coupled plasma-optical emission spec- the data through log transformation and removal of
troscopy (ICP-OES). 0.4 g of dried and sieved dust was outliers using Tukey Inner Fences (TIF=Q3+1.5 IQR or
digested with 20 mL HNO3 concentrated in an ETHOS Q1-1.5 IQR), and use the first decile as the background
EASY Microwave Digestion Platform (Milestone INC). value (170 mg/kg for concentration, and 4.5 mg/m2 for
The heating program was as follows: each sample’s load). Since Mexico City is a historic area, it is possible
temperature should rise to 175±5°C in approximately 5 that all samples are impacted by anthropogenic Mn,
min and remain at 175±5°C for 4.5 min. After cooling, however using the first decile instead of the minimum
samples were filtered with a Whatman No. 42 filter value, some variation is allowed.
paper, transferred into a 50 mL flask and brought to The world background value of Mn in soils is very
volume with Type A water. high (488 mg/kg);14 we consider it is not suited to be
Quality controls included reagent blanks, duplicate used in this study due to the fact that soils are analyzed
samples, and spiked samples. The quality assurance in the particle size below 2 000 μm, while we studied the
and quality control (QA/QC) results showed no sign of street dust of Mexico City in the particle size below 250
contamination or losses in any of the analyses.The digests μm, leaving a huge quantity of Mn contained in bigger
and the quality controls were triply analyzed with an particles outside the scope of this analysis.
ICP-OES spectrometer (Agilent Technologies 5100) using In order to obtain another contamination index to
the USEPA method 6010C. Curve multi-element QCS-26R produce a more robust contamination degree analysis,
(High Purity) solutions were used for calibration prepara- geoaccumulation index (Igeo) was also calculated. Igeo
tions. The Radio Frequency potency (RF power) was 1.2 considers small variations in the background value us-
kW. Nebulization flow was 0.7 L/min and argon plasma ing a 1.5 factor.
(
flow was 12.0 L/min. Detection limit was 0.04 mg/L (5
mg/kg). Quantification limit was 0.12 mg/L (15 mg/kg).
All samples were above the detection limit. Igeo=log2
Cn (
1.5 x Bn
Contamination degree, spatial analysis,
and human health risk assessment Igeo can be interpreted as follows: Igeo < 0 (uncontami-
nated), 0-1 (uncontaminated to moderately contaminated),
Descriptive statistical analysis of both Mn concentration 1-2 (moderately contaminated), 2-3 (moderately to highly
(mg/kg2) and Mn load (mg/m2) on street dust were car- contaminated), 3-4 (highly contaminated), 4-5 (highly to
ried out, as well as Spearman correlation coefficients for very highly contaminated), >5 (very highly contaminated).
non-normal distribution. Mn load in street dust (mg/ The Kruskal-Wallis and Dunn nonparametric tests
m2) was calculated by multiplying Mn concentration were used for variance analysis by township. The null
(mg/kg) and street dust load in kg/m2. hypothesis is stochastic homogeneity, which is equivalent
Furthermore, the contamination level could be to equality of expected values of rank sample means.
estimated as the quotient of Mn concentration in each Kruskal-Wallis test examines if there is an observed ten-
sample over the background value, which is known as dency to be larger (or smaller) in at least one population
the contamination factor): than all the remaining populations together. The analyses
Cn were done with the R Project software, version 3.52.
CF= CF and Igeo spatial distribution maps for Mn
Bn concentration and load were designed from a geo-
statistical analysis using GS+ software. The interpo-
lation method was kriging, equations can be found
Where Cn is Mn concentration in each sample point elsewhere.13 To determine the spatial autocorrelation,
and Bn is background value. CF less than 1 indicates in- the data semivariogram was calculated and adjusted
significant contamination, 1-3 is moderate contamination, 3-6 to a theoretical model in order to estimate CF and
is considerable contamination and more than 6 indicates Igeo at unsampled sites, using the kriging indicator
high contamination.13 method. It accepts data non-normality and converts
Usually, background value indicates an average the estimated values into indicator values that rank
concentration of natural values in a site. When there are from 0 to 1. The output is the probabilities range of
no background values available, as in the case of Mexico exceeding a cut-off value.
salud pública de méxico / vol. 62, no. 2, marzo-abril de 2020 149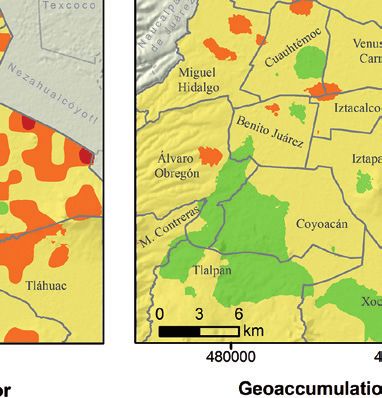
Artículo original                                                                                                                                                                   Aguilera A y col.

     Different levels of contamination indexes were                                                           derm. HI higher than 1 indicates that possible adverse
used as cut-off values to obtain several interpolations                                                       effects to human health may occur.
that were then overlapped in order to get a final map
for each index. For the CF map, the cut-off values were:
1 (probability 50% meaning moderate contamination), 3 (probability                                                          Contamination degree
>50% meaning considerable contamination) and 6 (prob-
ability >50% meaning high contamination).                                                                     Mn concentration and load have been altered by human
     For the Igeo map, cut-off values were 0 (probability                                                     activities since their frequency’s distributions are posi-
50% meaning uncon-                                                              tively skewed (figure 2a and d). Average contamination
taminated to moderately contaminated), and 1 (probability                                                     degree for Mn concentrations was moderate (CF=1.38),
>50% meaning moderately contaminated). We did not find                                                        according to CF, which had an interval from insignificant
Igeo values greater than 2, which is why the last cut-off                                                     contamination (min=0.59) to considerable contamination
value used was 1. For a study of this scale, we used the                                                      (max=5.83) (figure 2b). On the other hand, if Igeo, which
UTM projection, zone 14, horizontal datum ellipsoid                                                           considers small natural variations in the background
and the World Geodetic System 84 (WGS84).                                                                     value, is considered, average pollution degree was un-
     The non-carcinogenic hazard index (HI) developed                                                         contaminated (Igeo=-0.17); while the interval stood from
by the USEPA was calculated for Mn exposure from                                                              uncontaminated to moderately contaminated (min=-1.35,
street dust, both for children and adults (supplementary                                                      max=1.96) (figure 2c).
material). The estimated daily intake (EDI) in mg/kg                                                               For Mn load, contamination average level was
per day by ingestion (EDIing), inhalation (EDIing), dermal                                                    moderate (CF=2.38), according to CF, which varied from
contact (EDIdermal) were obtained and divided into their                                                      insignificant contamination (min=0.2) to high contamination
corresponding reference dose (RfD) to obtain the hazard                                                       (max=7.46) (figure 2e). If Igeo was considered, contami-
quotients for each exposure pathway (HQing/inh/derm), and                                                     nation average degree was uncontaminated to moderately
finally HI was found summing all those HQing/inh/                                                             contaminated (Igeo=0.43); while the interval went from

                                                 a                                                                   b                                                                                c
             0.006

                                       Mean
                                                               0.0 0.2 0.4 0.6 0.8 1.0 1.2

                                                                                                                                         0.0 0.2 0.4 0.6 0.8 1.0 1.2

                                       Median
                                       Density
             0.004

                                       Background
                                                                                                                               Density
                                                     Density
   Density
             0.002
             0.000

                     0    200 400 600 800 1000                                               0       2       4        6                                                 -3     -2   -1   0      1    2
                         Mn concentrations (mg/kg)                                               CF Mn concentrations                                                         Igeo Mn concentrations
             0.08

                                                                                                                                          0.0 0.1 0.2 0.3 0.4 0.5 0.6

                                                 d                                                                   e                                                                                f
                                                               0.30
             0.06

                                                                                                                               Density
                                                     Density
                                                               0.20
   Density
             0.04

                                                               0.10
             0.02
             0.00

                                                               0.00

                     0    5 10   15 20   25 30 35                                            0        2       4          6                                              -3     -2    -1    0     1        2
                            Mn loading (mg/m2)                                                       CF Mn loading                                                                  Igeo Mn loading
Figure 2. Frequency distribution for manganese (Mn) concentration and load (a and d), for their
contamination factors (CF) (b and e) and geoaccumulation index (Igeo) (c and f)

150                                                                                                                  salud pública de méxico / vol. 62, no. 2, marzo-abril de 2020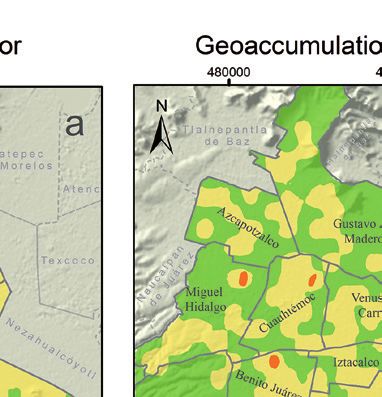
Spatial distribution of manganese in street dust Artículo original
uncontaminated to moderately to highly contaminated Spatial distribution, municipal analysis,
(min=-2.88, max=2.31) (figure 2f). and human health risk assessment
On the other hand, street dust load had a greater
impact than Mn concentration over Mn load, as the CF showed a moderate degree of contamination by Mn
Spearman correlation coefficient between Mn load and concentration in virtually all of Mexico City (figure 3a).
street dust load was positive (r=0.87), while the correla- Some small areas, mainly towards the south, showed
tion coefficient between Mn load and Mn concentration insignificant contamination. Only five isolated areas had
was weak (r=0.32). Street dust load averaged 46 g/m2 a considerable level, in the municipalities of Miguel Hi-
with an interval from 5-173 g/m2 and a variation coef- dalgo, Cuauhtémoc, Benito Juárez, Xochimilco and one
ficient of 50%. between Iztacalco and Venustiano Carranza.
Contamination factor Geoaccumulation index
480 000 492 000 480 000 492 000
2 160 000
2 160 000
Mn concentration
2 146 000
2 146 000
2 132 000
2 132 000
2 160 000
2 160 000
2 146 000
2 146 000
Mn loading
2 132 000
2 132 000
480 000 492 000 480 000 492 000
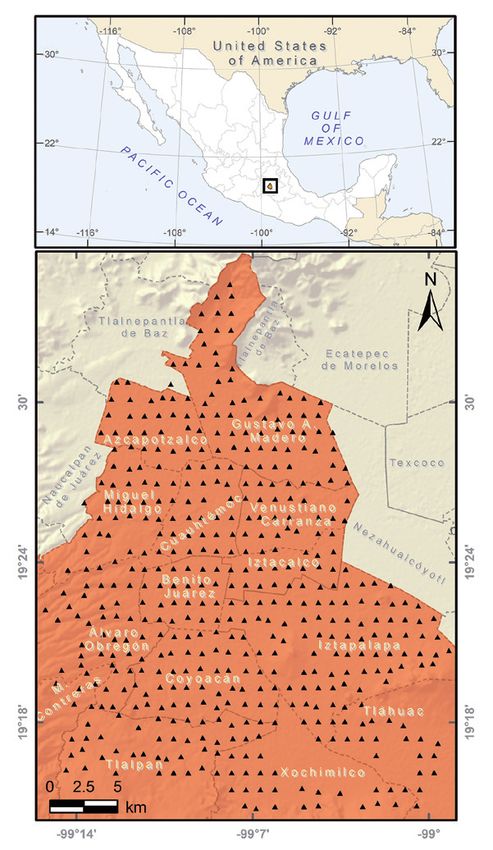
Contamination factor Geoacccumulation index
Uncontaminated
Insignificant Considerable
Uncontaminated to
Moderate High moderately contaminated
Moderately contaminated
Figure 3. Spatial distribution of the contamination factor and geoaccumulation index for man-
ganese (Mn) concentration and load
salud pública de méxico / vol. 62, no. 2, marzo-abril de 2020 151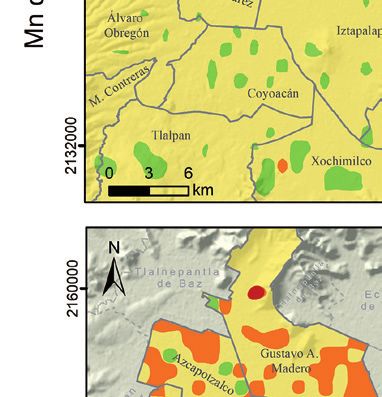
Artículo original                                                                                                   Aguilera A y col.

                                                                                                                    A
                                   Tláhuac
                                Xochimilco                                                           p< 0.05
                                    Tlalpan
                                                                                                     Background
                                 Coyoacán
                           Álvaro Obregón
                       Magdalena Contreras
                                 Iztapalapa
                        Gustavo A. Madero
                       Venustiano Carranza
                              Benito Juárez
                            Miguel Hidalgo
                                  Iztacalco
                              Azcapotzalco
                               Cuauhtémoc

                                                  200         400             600              800                1 000
                                                                            Mn (mg/kg)

                                    Tlalpan                                                                         B
                                 Coyoacán                                                            p< 0.05
                                Xochimilco
                                                                                                     Background
                              Benito Juárez
                           Álvaro Obregón
                                  Iztacalco
                       Magdalena Contreras
                               Cuauhtémoc
                                   Tláhuac
                            Miguel Hidalgo
                       Venustiano Carranza
                        Gustavo A. Madero
                                 Iztapalapa
                              Azcapotzalco

                                              0   5     10           15          20       25            30

                                                                    Mn loading (mg/m )2

Figure 4. Box and whisker plot for manganese (Mn) concentrations (a) and Mn load (b) by munici-
pality, ordered from lower to higher according to Dunn’s non-parametric test

     Using Igeo, most of the city remains uncontaminated              the southwest, between the municipalities of Coyoacán,
(figure 3b) by Mn concentration, especially towards the               Álvaro Obregón, Tlalpan and Xochimilco. Moderately
south. Uncontaminated to moderately contaminated levels               contaminated areas were located in the periphery, mainly in
were found in the center and north areas in the munici-               the municipalities of Iztapalapa, Gustavo A. Madero and
palities of Azcapotzalco, Gustavo A. Madero, Miguel                   Azcapotzalco. As for Igeo, hotspots were not differentiated.
Hidalgo, Cuauhtémoc, Venustiano Carranza, Benito                           The municipalities of Cuauhtémoc, Azcapotzalco,
Juárez, Iztacalco and the north of Iztapalapa. Only four              and Iztacalco had the highest concentrations (figure 4a).
areas are moderately contaminated.                                    North municipalities showed the highest Mn concentra-
     In terms of contamination by Mn load in street dust,             tions, specially found in Cuauhtémoc. On the other hand,
more extensive areas were found compared to those of                  south municipalities had lower Mn concentrations. Fur-
Mn concentration, with varying degrees of pollution. CF               thermore, Tláhuac, Tlalpan, and Xochimilco in the south
showed moderate contamination in most parts of the city               have the lowest concentrations of other potentially toxic
(figure 3c). The most extensive areas with insignificant              elements also reported.13,16 Azcapotzalco and Iztapalapa
contamination were located between the municipalities                 were the municipalities with greater Mn load (figure 4b).
of Coyoacán and Tlalpan, while the most extensive ar-                 Tlalpan and Coyoacán had the lowest Mn load.
eas with considerable contamination surrounded the city,                   No human health risk due to Mn exposure in street
mainly in the municipalities of Iztapalapa, Gustavo A.                dust was found, neither for children nor for adults.
Madero and Azcapotzalco. Three hotspots with high                     Average HI (summing ingestion, inhalation and dermal
contamination were located: two east of Iztpalapa and                 contact) was 0.4 for children, and 0.005 for adults. The
one north of Cuauhtémoc.                                              maximum value obtained was 0.6 for children and 0.08
     If Igeo is considered, the pattern remains practically           for adults. All of them were below the safe level. The
the same as for the CF by Mn load, only much more de-                 main exposure pathway was ingestion, which repre-
fined (figure 3d). The uncontaminated areas were located to           sented 86% of the HI for children, and 71% for adults.

152                                                                            salud pública de méxico / vol. 62, no. 2, marzo-abril de 2020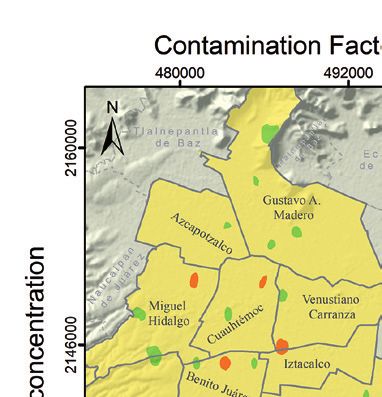
Spatial distribution of manganese in street dust                                                               Artículo original

                         Discussion                                              In order to get a very clear idea of the contamina-
                                                                            tion degree and its possible effects, this work’s results
Contamination degree                                                        are compared with those found in other international
                                                                            studies (table I).
Our results showed that there is a slight influence of                           Mn concentrations in Mexico City´s street dust
human activities on the Mn concentration and load in                        (100-990.5 mg/kg) were found within the range of the
Mexico City’s street dust, since frequency distributions                    concentrations of an area widely using MMT gasoline
were positively skewed and average CF showed moder-                         (17-959 mg/kg). Furthermore, those concentrations were
ate contamination. This type of distribution is common for                  associated with Mn levels in children’s blood.6 This
anthropogenic elements because concentration depends                        background information makes it advisable to analyze
on the distance to the source: the closer a sample is to the                Mn bioavailability in street dust as well as a biomarker
source, the higher the concentrations are.13,17,18                          to Mn exposure, such as toenails or hair,2 in Mexico
      Contamination level undoubtedly is based on the                       City’s children. Children are most vulnerable because
background value selected. In this case, we used as                         they have higher absorption rates and have not fully
background value of 170 mg/kg for Mn concentration,                         developed Mn excretion mechanisms.4,6
as was explained in the methods section. Other studies                           Compared to a site with wide use of Mn pesticides,
have used a background value for soils, for example Chi-                    average Mn concentration and load in Mexico City´s
nese background is 557 mg/kg.19,20 Only three street dust                   street dust were higher (235.2 mg/kg and 10.7 mg/
samples in Mexico City surpassed this value. However,                       m2) than those of Salinas Valley, California intramural
Mn may be retained in soils or absorbed by plants, while                    dust (171 mg/kg and 1.9 mg/m2).5 Although it is ex-
Mn particles in street dust are intemperized, until they                    pected that street dust has higher amounts of Mn, this
become breathable particles smaller than 10 microns,                        antecedent is an reminder to pay more attention to Mn
and can be resuspended in the air. Thus, considering a                      contamination.
background value for soil could lead us to underestimate                         Compared to a site adjacent to a Mn alloy produc-
the level of street dust contamination. Furthermore, soil                   tion plant (less than 2 km), main Mn load in Mexico
background value depends on each study site and it has                      City was very close to main Mn load rate in Simões
not yet been estimated for Mexico City.                                     Filho, Brazil (12 mg/m2/30 days).2 However, in Brazil,

                                                                    Table I
            Comparison of manganese concentration and load in several international studies

         Study site            Characteristic        Sample type     Concentration or load    Mean    Median       Range     Reference
 Johannesburg, Africa     MMT gasolines             School dust                               404      314         17-959          6
 Cape Town, Africa        No MMT gasoline           School dust                                73      76          38-99           6
                          Fungicides Maneb and
 Salinas, USA                                       House dust                                171                  2-414           5
                          Mancozeb
                          No contamination
 Xi’an, China             (Chinese background       Road dust      Concentration (mg/kg)      339.4               282-430          19
                          557 mg/kg)
                          No contamination
 Dhaka, Bangladesh        (Chinese background       Road dust                                 262      266        194-415          20
                          557 mg/kg)
                          Atmospheric contami-
 Mexico City                                        Street dust                               235      224        100-990    This study
                          nation
                          Ferromanganese alloy
 Simões Filho, Brazil                               Street dust    Load rate (mg/m2/30 day)   12*                  9.0-38          2
                          plant
                          Fungicides maneb and
 Salinas, USA                                       House dust                                 1.9                0.001-25         5
                          mancozeb
                                                                   Load (mg/m2)
                          Atmospheric contami-
 Mexico City                                        Street dust                                10      11          0.9-34    This study
                          nation

* Geometric mean
MMT: methylcyclopentadienyl manganese tricarbonyl

salud pública de méxico / vol. 62, no. 2, marzo-abril de 2020                                                                           153
Artículo original Aguilera A y col.
authors analyzed a 30-day rate, while in Mexico City so it is important to use different kinds of analyses to
we do not know how much accumulation is produced complement results.
in that amount of time. On the other hand, it was possible to corroborate the
spatial distribution patterns observed in Igeo Mn con-
Spatial distribution, municipal analysis, centration and load maps. In the case of concentration,
and human health risk assessment center and northern municipalities had higher values
than those on the south, with statistically significant dif-
Maps showed that Igeo was more precise while de- ferences. As for the Mn load, periphery municipalities
marcating contamination spatial distribution by Mn had higher values than those inside the city.
concentration and load in Mexico City´s street dust Even when no human health risk due to Mn
(figure 3). Igeo spatial distribution for Mn concentration exposure in street dust was found, it is important to
corroborated human activities increase Mn levels in the keep monitoring this element since the maximum HI
city, as the most contaminated areas were concentrated of the data for children (HIchildren=0.61) was close to the
towards the north and center of the city. These are areas safe limit of 1. As this study demonstrated, street dust
where industrial and commercial activities predominate, loading has an important influence on the Mn loading
and there is a lot of car traffic. Furthermore, it has been (total quantity of Mn in the street dust), therefore, local
reported that residents from the north area have been exposure factors (ingestion rate, particle emission fac-
exposed to higher PM10 and PM2.5 concentrations with tor, etc.) should be considered to obtain a more accurate
high levels of the following metals: Mn, Zn, Cu, Pb, Ti, human health risk assessment.
Sn, V and Ba.10
On the other hand, if Mn distribution was domi-
nated by natural sources, it would be expected that the
Conclusions
highest concentrations were located around the city, This study is the first to report the concentration and
near the less urbanized sites or towards the southeast load of manganese in urban dust in Mexico City. There
because of the active Popocatépetl volcano, as the vol- is a slight influence of human activities in Mn concentra-
canic activity is one of Mn main natural sources.4 tion and load in street dust. Mn concentration was 235.2
By estimating the spatial distribution of Mn load mg/kg and load average, 10.7 mg/m2. Although this is
contamination, a strong influence of street dust load was not a serious situation, caution is recommended due to
observed, as the areas with the highest Mn load were lack of reference values. These findings can serve as a
located towards the east and northwest of the city, where background to assess future potential changes in Mexico
there was more dust. This influence was also exhibited City’s Mn concentration in the environment.
by the high Spearman correlation coefficient between Geoaccumulation index showed better resolution
street dust load and Mn load (r=0.87). Other authors that the contamination factor in order to limit Mn pollu-
have also observed this.5 tion. The most contaminated areas by Mn concentration
This shows the need to maintain cleaning plans were found in central and northern Mexico City. As the
in order to reduce exposure to Mn load and other po- Mn load is concerned, a strong influence of street dust
tentially toxic elements. Street dust load can work as load was observed, since a strong correlation was found
an indicator of the cleaning plans, the higher the street between both, and the most contaminated areas were
dust load, the lower the success of the cleaning plans. located towards the east and northwest of the city, where
Gunier and colleagues5 have reported that Mn load can there was more dust.
be reduced by keeping the house clean and using rugs Because the most contaminated areas by Mn con-
at the entrance. Indoor Mn concentrations can also be centration and Mn load were different, it is important
reduced by keeping the windows closed.1 to consider both variables in pollution and exposure
Although spatial analysis allows us to distinguish studies of potentially toxic elements. The only munici-
areas with greater pollution, municipal variance analysis pality both with high Mn concentration and load was
allows us to identify municipalities with higher Mn Azcapotzalco, which implies a double risk. An efficient
concentration and load. Thanks to the Kruskal-Wallis street and house cleaning system may reduce exposure
test, it was possible to identify Azcapotzalco as the to a dust load of potentially toxic elements.
municipality with the worst contamination by Mn
concentration and load. Nevertheless, this could not be Declaration of conflict of interests. The authors declare that they have no
conflict of interests.
distinguished in the Mn concentration pollution maps,
154 salud pública de méxico / vol. 62, no. 2, marzo-abril de 2020Spatial distribution of manganese in street dust Artículo original
ric system, cervical vagus, hyperphosphorylated alpha synuclein and tau in
young Mexico City residents. Environ Res. 2017;159:186-201. https://doi.
org/10.1016/j.envres.2017.08.008
References 11. Fulk F, Succop P, Hilbert TJ, Beidler C, Brown D, Reponen T, et al.
Pathways of inhalation exposure to manganese in children living near a fe-
rromanganese refinery: A structural equation modeling approach. Sci Total
1. Cortez-Lugo M, Rodríguez-Dozal S, Rosas-Pérez I, Alamo-Hernández U,
Environ. 2017;579:768-75. https://doi.org/10.1016/j.scitotenv.2016.11.030
Riojas-Rodríguez H. Modeling and estimating manganese concentrations in
12. Rodrigues JLG, Bandeira MJ, Araújo CFS, dos Santos NR, Anjos ALS,
rural households in the mining district of Molango, Mexico. Environ Monit
Koin NL, et al. Manganese and lead levels in settled dust in elementary
Assess. 2015;187(12):752 [cited April, 2019]. Available from: http://link.
schools are correlated with biomarkers of exposure in school-aged
springer.com/10.1007/s10661-015-4982-8
children. Environ Pollut. 2018;236:1004-13. https://doi.org/10.1016/j.
2. Menezes-Filho JA, Fraga de Souza KO, Gomes Rodrigues JL, Ribeiro dos
envpol.2017.10.132
Santos N, Bandeira M de J, Koin NL, et al. Manganese and lead in dust fall
13. Ihl T, Bautista F, Cejudo Ruíz FR, Delgado M del C, Quintana Owen P,
accumulation in elementary schools near a ferromanganese alloy plant.
Aguilar D, et al. Concentration of toxic elements in topsoils of the metro-
Environ Res. 2016;148:322-9. https://doi.org/10.1016/j.envres.2016.03.041
politan area of Mexico city: A spatial analysis using ordinary kriging and
3. Rodrigues JLG, Araújo CFS, dos Santos NR, Bandeira MJ, Anjos ALS,
indicator kriging. Rev Int Contam Ambient. 2015;31(1):47-62 [cited April,
Carvalho CF, et al. Airborne manganese exposure and neurobehavior in
2019]. Available from: http://www.scielo.org.mx/scielo.php?script=sci_
school-aged children living near a ferro-manganese alloy plant. Environ
abstract&pid=S0188-49992015000100004&lng=en&nrm=iso&tlng=en
Res. 2018;167:66-77. https://doi.org/10.1016/j.envres.2018.07.007
14. Kabata-Pendias A. Trace elements in soils and plants. 4th ed. New York:
4. Röllin HB, Nogueira CMCA. Manganese: Environmental Pollution and
CRC Press, 2011 [cited April, 2019]. Available from: https://n9.cl/17j
Health Effects. In: Nriagu JO, ed. Reference Module in Earth Systems and
15. Declercq Y, Samson R, Castanheiro A, Spassov S, Tack FMG,Van De
Environmental Sciences. Johannesburg, South Africa: Elsevier, 2019:617-29
Vijver E, et al. Evaluating the potential of topsoil magnetic pollution map-
[cited April, 2019]. Available from: https://linkinghub.elsevier.com/retrieve/
ping across different land use classes. Sci Total Environ. 2019;685:345-56.
pii/B9780124095489115301
https://doi.org/10.1016/j.scitotenv.2019.05.379
5. Gunier RB, Jerrett M, Smith DR, Jursa T,Yousefi P, Camacho J, et al.
16. Delgado C, Bautista F, Gogichaishvili A, Cortés JL, Quintana P,
Determinants of manganese levels in house dust samples from the
Aguilar D, et al. Identificación de las zonas contaminadas con me-
CHAMACOS cohort. Sci Total Environ. 2014;497-498:360-8 [cited
tales pesados en el polvo urbano de la Ciudad de México. Rev Int
April, 2019]. Available at: https://linkinghub.elsevier.com/retrieve/pii/
Contam Ambie. 2019;35(1):81-100 [cited April, 2019]. Available from:
S004896971401170X
https://www.revistascca.unam.mx/rica/index.php/rica/article/view/
6. Röllin H, Mathee A, Levin J, Theodorou P, Wewers F. Blood manga-
RICA.2019.35.01.06/46811
nese concentrations among first-grade schoolchildren in two South
17. Guvenç N, Alagha O, Tuncel G. Investigation of soil multi-element
African cities. Environ Res. 2005;97(1):93-9. https://doi.org/10.1016/j.
composition in Antalya, Turkey. Environ Int. 2003(5):631-40. https://doi.
envres.2004.05.003
org/10.1016/S0160-4120(03)00046-1
7. Abbott PJ. Methylcyclopentadienyl manganese tricarbonyl (MMT) in
18. Aguilera A, Armendariz C, Quintana P, García-Oliva F, Bautista F.
petrol: The toxicological issues. Sci Total Environ. 1987;67(2-3):247-55.
Influence of Land Use and Road Type on the Elemental Composition
https://doi.org/10.1016/0048-9697(87)90215-4
of Urban Dust in a Mexican Metropolitan Area. Polish J Environ Stud.
8. Smith D, Woodall GM, Jarabek AM, Boyes WK. Manganese testing
2019;28(3):1535-47. https://doi.org/10.15244/pjoes/90358
under a clean air act test rule and the application of resultant data in risk
19. Shi D, Lu X, Wang Q. Evaluating Health Hazards of Harmful Metals
assessments. Neurotoxicology. 2018;64:177-84. https://doi.org/10.1016/j.
in Roadway Dust Particles Finer than 100 μm. Polish J Environ Stud.
neuro.2017.06.014
2018;27(6):2729-37. https://doi.org/10.15244/pjoes/80820
9. Roth JA. Homeostatic and toxic mechanisms regulating manganese
20. Safiur Rahman M, Khan MDH, Jolly YN, Kabir J, Akter S, Salam A. Asses-
uptake, retention, and elimination. Biol Res. 2006;39(1):45-57. https://doi.
sing risk to human health for heavy metal contamination through street
org/10.4067/S0716-97602006000100006
dust in the Southeast Asian Megacity: Dhaka, Bangladesh. Sci Total Environ.
10. Calderón-Garcidueñas L, Reynoso-Robles R, Pérez-Guillé B, Mukherjee
2019;660:1610-22. https://doi.org/10.1016/j.scitotenv.2018.12.425
PS, Gónzalez-Maciel A. Combustion-derived nanoparticles, the neuroente-
salud pública de méxico / vol. 62, no. 2, marzo-abril de 2020 155You can also read