SPECIAL FEATURE Fiscal revenues from non-renewable natural resources in Latin America and the Caribbean
←
→
Page content transcription
If your browser does not render page correctly, please read the page content below
Revenue Statistics in Latin America and the Caribbean 2021/
        Estadísticas tributarias en América Latina y el Caribe 2021

                                                              Chapter 3

                                           SPECIAL FEATURE
             Fiscal revenues from non-renewable
              natural resources in Latin America
                       and the Caribbean

	This special feature was prepared by Michael Hanni, Economic Affairs Officer, Fiscal Affairs Unit, Economic Development
 Division, Economic Commission for Latin America and the Caribbean (ECLAC).

                                                                                                                   137
3. Special feature/Sección especial

                                                   Principal findings

            Trends in fiscal revenues from non-renewable natural resources in 2019
              Oil and gas revenues in Latin America and the Caribbean (LAC) rose in 2019 despite
            unfavourable global market conditions. The increase in hydrocarbon revenues, which
            reached 2.7% of GDP on average compared to 2.5% of GDP in 2018, was largely the result of
            extraordinary receipts. Signing bonuses for new oil and gas concessions generated excess
            revenues equivalent to 1% of GDP in Brazil. In Trinidad and Tobago, payments under a
            tax amnesty programme and receipts deriving from a negotiated settlement with a large
            producer resulted in a one-time increase equivalent to 1.6% of GDP. Property rents, however,
            fell during the year in line with international prices, as regional production was largely flat.
              Weak international prices for a range of industrial minerals and metals and lower
            production led to a decline in LAC’s mining revenues in 2019. The year-on-year variation
            relative to GDP was marginal: average revenues fell to 0.37% of GDP from 0.39% of GDP in
            2018. Similarly, aggregate revenues in US dollar terms edged down slightly (-3.9%), although
            the scale of the fall was reduced due to a sharp increase in Brazil (+75.1%). Excluding Brazil,
            overall revenues declined 17.3% in US dollar terms, with significant contractions registered
            in Chile, Colombia, Guatemala, Jamaica, Mexico and Peru.
            The impact of the COVID-19 pandemic on revenues from extractive activities
              The COVID-19 pandemic has provoked one of the greatest social and economic crises in
            modern times. It has also created significant turmoil in commodity markets. Oil markets
            have been especially impacted, with plunging demand, especially in advanced economies,
            leading to a sharp decline in crude oil spot prices. In contrast, international prices for
            minerals and metals recovered quickly after an initial decline, on the back of accelerating
            industrial production in China. High-frequency data for a sample of countries suggests
            that there is likely to be a significant decline in fiscal revenues from non-renewable natural
            resources at the regional level for the year compared to 2019.

Hydrocarbon revenues rise in LAC, boosted by one-off extraordinary revenues
              Global oil markets stabilised to some extent in 2019 following volatility in the
         fourth quarter of 2018 related to significant over-supply. In December 2018, the members
         of OPEC and allied oil-producing countries – most notably the Russian Federation –
         committed to reducing their overall output volume by a combined 1.2 million barrels per day
         (0.8 million for OPEC members) for the first half of 2019. The accord was largely successful
         and overall world liquid fuels production slowed markedly in the first quarter of 2019
         (Figure 3.1). Crude oil spot prices rallied as the market moved to greater equilibrium during
         the first months of the year. Nevertheless, prices again trended lower in May on the back
         of weakening macroeconomic fundamentals, rising trade tensions between China and the
         United States and a build-up of crude oil stockpiles in the United States. In response, OPEC
         and allied exporters agreed in July to extend crude oil production cuts until 2020. These
         trends notwithstanding, oil consumption jumped in the second half of the year, largely
                                     Revenue Statistics in Latin America and the Caribbean 2021 © OECD/UNITED NATIONS/CIAT/IDB 2021
138                                 ESTADÍSTICAS TRIBUTARIAS EN AMÉRICA LATINA Y EL CARIBE 2021 © OCDE/NACIONES UNIDAS/CIAT/BID 2021
3. Special feature/Sección especial
bolstered by record crude oil imports in China as several new mega-refineries came online.
Despite the up-tick registered in the fourth quarter, annual average crude oil spot prices fell
for the year, with Brent down 10% (from USD 71.1 per barrel to USD 64.0) and Western Texas
Intermediate (WTI) declining by 12% (from USD 64.8 per barrel to USD 57.0).
Figure 3.1. World liquid fuels production and consumption balance and international spot
prices for crude oil, 2018-19
A. World demand and supply of crude oil B. International spot prices
(million barrels per day) (dollars per barrel)
Consumption Production West Texas Intermediate (WTI) Brent
103 85
102.3
101.7
80
101.6
102
75
100.5
101
100.3
100.2
70
99.9
100 65
99.4
60
99
55
98
50
100.0
100.3
101.3
100.8
100.5
101.1
102.3
101.9
97 45
Q1 Q2 Q3 Q4 Q1 Q2 Q3 Q4
Nov
Dec
Nov
Dec
Feb
Aug
Sep
Feb
Aug
Sep
Oct
Oct
Mar
Apr
Mar
Apr
Jan
May
May
Jun
Jan
Jun
Jul
Jul
2018 2019 2018 2019
Source: Economic Commission for Latin America and the Caribbean (ECLAC), on the basis of EIA (2020[1]) and World Bank Commodity Price
Data (The Pink Sheet), World Bank.
12 https://doi.org/10.1787/888934234860
Production levels of hydrocarbons in LAC declined in 2019, although with significantly
different trends at the country level (Table 3.1). Overall crude oil output fell substantially,
contracting by 4.9% due largely to the 37.7% plunge in production in the Bolivarian Republic of
Venezuela. While output rose slightly excluding the latter country, this reflected a rebound in
production in Brazil and to a smaller extent in Argentina, Colombia and Ecuador, while crude
oil production in Mexico fell sharply. Natural gas production also registered a decline due to
falling output in the Bolivarian Republic of Venezuela, Mexico and the Plurinational State of
Bolivia. Nevertheless, these declines were attenuated to some extent by increases in Argentina
(where output reached its highest level since 2009), Brazil, Peru, and Trinidad and Tobago.
Hydrocarbon revenues in the LAC region increased in 2019 despite the prevailing
international context, characterised by falling crude oil spot prices, and regional production
trends (Table 3.2). Overall hydrocarbon revenues in LAC reached USD 79.8 billion in 2019, up
10.4% from 2018. In relative terms, this result was relatively modest, equivalent to 2.7% of
GDP on average compared to 2.5% of GDP in 2018. Although greater production and currency
depreciations softened the impact of lower international prices in some countries, this rise in
revenues was largely due to extraordinary receipts. Brazil and Trinidad and Tobago registered
one-off oil revenues during the year equivalent to 1.0% of GDP and 1.6% of GDP, respectively.1
Excluding these transactions, hydrocarbon revenues contracted by 14.8% in US dollar (USD)
terms. This correlates with the trajectory of revenues from royalties and production levies tied to
Revenue Statistics in Latin America and the Caribbean 2021 © OECD/UNITED NATIONS/CIAT/IDB 2021
ESTADÍSTICAS TRIBUTARIAS EN AMÉRICA LATINA Y EL CARIBE 2021 © OCDE/NACIONES UNIDAS/CIAT/BID 2021 1393. Special feature/Sección especial
the commercial value of production, which fell by 12.6% in USD terms in line with international
prices and regional production dynamics. However, results at the country level were varied,
reflecting strong heterogeneity in production, export and regulatory dynamics over the year.
Table 3.1. Crude oil and natural gas production in Latin America and the Caribbean and
selected country groupings, 2018-19
Crude oil (thousand barrels daily) Natural gas (billion cubic metres)
Selected country groupings and countries 2019-2018 2019-2018
2018 2019 2018 2019
(% change) (% change)
Latin America and the Caribbean 8 012 7 632 -4.7 199 196 -1.4
excluding Venezuela 6 502 6 619 1.8 174 176 0.8
Argentina 489 509 3.9 41 43 5.7
Bolivia .. .. .. 19 17 -10.7
Brazil 2 587 2 788 7.8 22 24 9.5
Colombia 865 886 2.4 10 10 3.1
Ecuador 517 531 2.6 0 0 ..
Guatemala 9 10 4.1 .. .. ..
Mexico 1 813 1 678 -7.4 33 31 -6.8
Peru 49 53 8.4 12 13 0.7
Trinidad and Tobago 64 59 -7.3 35 36 2.1
Venezuela 1 510 1 013 -32.9 25 21 -17.1
Other LAC 115 113 -1.3 1 1 2.0
Total World 75 822 75 263 -0.7 3 946 4 093 3.7
OPEC 31 238 29 375 -6.0 .. .. ..
Saudi Arabia 10 317 9 808 -4.9 .. .. ..
Non-OPEC 44 584 45 887 2.9 .. .. ..
Russian Federation 10 527 10 625 0.9 .. .. ..
United States 10 991 12 232 11.3 .. .. ..
Source: Economic Commission for Latin America and the Caribbean (ECLAC) on the basis of OPEC (2020[2]).
12 https://doi.org/10.1787/888934235012
Oil and gas revenues in Argentina contracted in 2019, although the year-on-year
variation in relative terms was marginal (down 0.01% of GDP). Revenues from the
corporate income tax (CIT) and royalties registered sharp contractions (-19.1% and -15.9%
in USD terms, respectively), which exceeded the decline in international crude oil spot
prices and was at odds with the increase in oil and gas production. This was largely due
to the issuance of Decree No. 566/2019 of 15 August, which imposed price controls on
petroleum products for a period of 90 days. The decree established that all deliveries of
crude oil to the domestic market had to be invoiced at the price that had been agreed to
between producers and refiners as of 9 August, applying a fixed ARS-USD exchange rate
and Brent reference price to the transaction. Subsequent decrees modified the exchange
rate used to calculate payments, but domestic crude oil prices nevertheless continued to
lag international benchmarks.
Lower natural gas output and falling prices produced a significant decrease in
hydrocarbon revenues in the Plurinational State of Bolivia. Overall oil and natural gas revenues
reached 3.8% of GDP in 2019, down from 4.6% of GDP in the previous year, as a result of
falling non-tax revenues from the Direct Tax on Hydrocarbons (a royalty) and other State
participation in the commercial value of production. Maturing natural gas fields and limited
investment have led to a steady decline in output, which in 2019 reached its lowest level since
2011, 21.2% below the high attained in 2014 (Table 3.1; OPEC (2020[2])). Increased production
of natural gas in Argentina and Brazil continues to put pressure on Bolivian hydrocarbon
revenues and exports (BCB, 2020[4]).
Revenue Statistics in Latin America and the Caribbean 2021 © OECD/UNITED NATIONS/CIAT/IDB 2021
140 ESTADÍSTICAS TRIBUTARIAS EN AMÉRICA LATINA Y EL CARIBE 2021 © OCDE/NACIONES UNIDAS/CIAT/BID 20213. Special feature/Sección especial
Table 3.2. General government fiscal revenues from oil and gas exploration and production
in nine LAC countries, by type of revenue, 2018-19
Percentage of GDP unless otherwise specified
Region / country
Bolivia Trinidad
Type of revenue Period
LAC Argentina (Plurinational Brazil Colombia Ecuador Guatemala Mexico Peru and
State of) Tobago
Total revenues 2018 2.5 0.5 4.6 1.2 1.8 7.6 0.1 2.3 0.7 3.9
2019 2.7 0.5 3.8 1.9 2.4 7.2 0.0 1.8 0.5 6.5
2019-2018 0.2 0.0 -0.8 0.7 0.5 -0.4 0.0 -0.5 -0.2 2.5
(p.p. of GDP)
2019-2018 .. 43.3 -15.4 67.6 39.7 -4.8 -31.8 -20.0 -22.6 67.2
(% change in NC)
2019-2018 10.4 -16.4 -15.4 56.0 25.9 -4.8 -33.4 -20.1 -23.8 67.6
(% change in USD)
Tax revenues 2018 0.4 0.1 0.3 0.1 0.7 0.0 0.0 0.0 0.2 1.8
2019 0.5 0.1 0.2 0.1 0.6 0.0 0.0 0.0 0.1 3.1
2019-2018 0.1 0.0 0.0 0.0 -0.2 0.0 0.0 0.0 0.0 1.3
(p.p. of GDP)
Non-tax revenues 2018 2.2 0.4 4.3 1.1 1.1 7.6 0.1 2.3 0.5 2.2
2019 2.3 0.4 3.6 1.8 1.8 7.2 0.0 1.8 0.4 3.4
2019-2018 0.1 0.0 -0.7 0.7 0.7 -0.4 0.0 -0.5 -0.1 1.2
(p.p. of GDP)
of which: royalties 2018 2.1 0.4 4.3 0.8 0.7 7.6 0.1 2.3 0.5 2.2
and production 2019 1.9 0.4 3.6 0.8 0.7 7.2 0.0 1.8 0.4 2.2
levies 2019-2018 -0.2 0.0 -0.7 0.0 0.0 -0.4 0.0 -0.5 -0.1 0.0
(p.p. of GDP)
2019-2018 -12.6 -15.9 -15.7 -1.8 -4.5 -4.8 -45.5 -20.4 -24.9 3.7
(% change in USD)
Note: Data for Mexico correspond to federal government oil revenue and they exclude own revenues of Pemex, the State-owned oil and
gas producer. Data for Ecuador correspond to oil revenues of the non-financial public sector. The revenue-to-GDP ratio for Latin America
and the Caribbean (LAC) corresponds to a simple average of the countries included in the sample. Figures may not sum due to rounding.
Source: Economic Commission for Latin America and the Caribbean (ECLAC), based on data from CEPALSTAT (2020[3]).
12 https://doi.org/10.1787/888934235031
Hydrocarbon revenues surged in Brazil in 2019 on the back of extraordinary one-time
receipts. Overall fiscal revenues from crude oil and natural gas rose to 1.9% of GDP from
1.2% of GDP in 2018, an increase of 56% in USD terms. In April 2019, the federal government
and Petrobras concluded a multi-year negotiation on contractual terms for the “pré sal”
area within the framework of the initial oil-for-shares swap deal struck in 2010 (Petrobras,
2020[5]). The agreement allowed the federal government to auction production-sharing
contracts for the remainder of the oil reserves – above and beyond that which had previously
been allotted to Petrobras – in the off-shore area in November 2019. The auction resulted
in R$ 69.96 billion of signing bonuses (equivalent to 1.0% of GDP). However, revenues from
royalties and other government participations in the commercial value of production fell
slightly (-1.8% in USD terms) as rising output was offset by falling prices.
In Colombia, oil and gas revenues jumped in 2019 due to an exceptionally large
dividend payment by EcoPetrol – the State-owned producer – to the national government.
At COP 11.42 billion, equivalent to USD 3.5 billion or 1.1% of GDP, the dividend was well
above the previous year’s payment of 0.3% of GDP. As a result, overall hydrocarbon revenues
reached 2.4% of GDP in 2019, up from 1.8% of GDP in 2018. Nevertheless, revenues from other
instruments registered declines. Tax revenues in the form of CIT receipts fell, reflecting
the impact of lower prices on profit margins and the high base of comparison with the
Revenue Statistics in Latin America and the Caribbean 2021 © OECD/UNITED NATIONS/CIAT/IDB 2021
ESTADÍSTICAS TRIBUTARIAS EN AMÉRICA LATINA Y EL CARIBE 2021 © OCDE/NACIONES UNIDAS/CIAT/BID 2021 1413. Special feature/Sección especial
previous year when EcoPetrol reported strong profits. Property rents from royalties were
largely unchanged relative to GDP, but they fell in US dollar terms as a modest increase in
production was offset by lower prices.
Hydrocarbon revenues in Ecuador registered a marginal decline in 2019 (-4.8% in
USD terms) as higher production and exports by State-owned Petroamazonas (+4.4% and
+9.9%, in millions of barrels, respectively) largely offset the decline in prices (BCE, 2020[6]).
The country’s oil sector was impacted by social unrest caused by the promulgation of
Decree 883 of 11 October that eliminated fuel subsidies. Although this decree was later
revoked by Decree 894 of 14 October work stoppages across the countries continued during
the month.
Oil revenues in Guatemala fell sharply in 2019, down 33.4% in USD terms and from 0.07%
of GDP in 2018 to 0.05% of GDP, despite rising output. Non-tax revenues from the State’s
participation in the production of hydrocarbons fell sharply (-58.8% in USD terms) reflecting
the high base of comparison with the previous year when these revenues registered an
increase much greater than was budgeted (MINFIN, 2019[7]).
A confluence of factors precipitated a decline in federal government oil revenues in
Mexico, including international price dynamics, slumping production and policy measures.2
Overall hydrocarbon revenues of the federal government fell from 2.3% of GDP in 2018 to 1.8%
of GDP, as property rents from oil exploration and production activities declined. Revenues
of the Profit-Sharing Duty (Derecho por la Utilidad Compartida) paid by Petroleos Mexicanos,
which make up the bulk of non-tax oil revenues, contracted as a result of the application of
a government decree in May 2019 that allowed the company to make greater deductions for
investments (PEMEX, 2020[8]; FMPED, 2020[9]). Likewise, beginning in January 2019, the rate
used to calculate the Profit-Sharing Duty declined to 65%, from 66.25% in 2018, in line with
the changes in the oil and gas fiscal framework established in the Hydrocarbons Revenue
Law of 2014.
Oil and gas revenues in Peru declined to 0.5% of GDP in 2019 from 0.7% of GDP in
2018, principally due to flagging external demand. Revenues from royalties fell by 24.9% in
USD terms, or from 0.5% of GDP in 2018 to 0.4% of GDP, despite increased output of crude
oil. The decline in royalties was largely due to the lower value of exports of crude oil and
natural gas, which serves as the basis for the calculation of certain property rent payments.
In particular, liquified natural gas exports registered a sharp contraction as the value of sales
to Spain, a key trade partner, fell from USD 333.9 million in 2018 to just USD 35.6 million in
2019 (-89%).3 Weaker sales also translated into a decline in profit margins and, in turn, tax
revenues.
Hydrocarbon revenues in Trinidad and Tobago were up sharply in 2019, rising from
3.9% of GDP in 2018 to 6.5% of GDP, boosted by extraordinary tax and non-tax receipts. A
three-month tax amnesty that allowed taxpayers to liquidate outstanding liabilities free
of penalties and interest resulted in higher than anticipated tax revenues. Oil companies
alone made payments worth TTD 750 million (0.5% of GDP) under the programme. These
receipts and stronger revenues from income taxes reflecting higher profits obtained in the
previous fiscal year pushed oil and gas tax revenues up from 1.8% of GDP in 2018 to 3.1%
of GDP. Non-tax revenues also rose markedly, from 2.2% of GDP in 2018 to 3.4% of GDP, due
to an initial TTD 1.9 billion payment during FY2018/19, equivalent to 1.2% of GDP, by Shell
Trinidad and Tobago Limited – a subsidiary of Royal Dutch Shell – to the government as a
result of an agreement to address outstanding tax issues.
Revenue Statistics in Latin America and the Caribbean 2021 © OECD/UNITED NATIONS/CIAT/IDB 2021
142 ESTADÍSTICAS TRIBUTARIAS EN AMÉRICA LATINA Y EL CARIBE 2021 © OCDE/NACIONES UNIDAS/CIAT/BID 20213. Special feature/Sección especial
Mining revenues in LAC declined, with significant heterogeneity
at the country level
The weakening macroeconomic fundamentals that characterised the year, worsened
by rising trade tensions, served to reinforce the decline in international spot prices for a
range of industrial minerals and metals that began in mid-2018 (Figure 3.2). Prices for iron
ore, however, rose sharply as a result of record steel production in China and production
disruptions caused by the tragic Corrego do Feijão mine disaster in Brazil and Cyclone
Veronica in Australia (IMF, 2019[10]). Nickel prices also increased in the second half of the year
as Indonesia – the world’s largest exporter – announced a complete ban on exports of raw
nickel to begin in 2020 (World Bank, 2019[11]). These factors notwithstanding, price dynamics
reflected to some extent changes in market sentiment as underlying demand remained
relatively stable. For example, although global copper consumption was essentially flat in
2019 compared to 2018 (-0.4%), demand for lead, zinc and nickel all rose.4
Figure 3.2. International spot prices for selected minerals and metals, Q1 2018-Q4 2019
Quarterly growth over the previous year
A. Selected base metals B. Iron ore and nickel
Aluminum Copper Lead
% Tin Zinc % Iron ore Nickel
30 70
25
60
20
50
15
40
10
5 30
0 20
-5
10
-10
0
-15
-10
-20
-25 -20
Q1 Q2 Q3 Q4 Q1 Q2 Q3 Q4 Q1 Q2 Q3 Q4 Q1 Q2 Q3 Q4
2018 2019 2018 2019
Source: Economic Commission for Latin America and the Caribbean (ECLAC), on the basis of World Bank Commodity Price Data (The Pink
Sheet), World Bank.
12 https://doi.org/10.1787/888934234879
The impact of falling prices on mining revenues in LAC was further reinforced by lower
mining output in several countries (Table 3.3). This trend was influenced in part by ongoing
social conflicts (such as at the Las Bambas mine in Peru operated by Minerals and Metals
Group), strikes and work stoppages (as was the case with the strike by workers at Codelco’s
Chuquicamata mine in Chile), and environmental damage (most notably the Corrego do
Feijão mine disaster in Brazil). At a more structural level, mining output in the region
continues to be tempered by the progressive decline in ore grades as existing large-scale
mines mature.5 This phenomenon requires ever greater ore extraction to maintain metals
and minerals output levels. The associated higher production costs and the need for costly
Revenue Statistics in Latin America and the Caribbean 2021 © OECD/UNITED NATIONS/CIAT/IDB 2021
ESTADÍSTICAS TRIBUTARIAS EN AMÉRICA LATINA Y EL CARIBE 2021 © OCDE/NACIONES UNIDAS/CIAT/BID 2021 1433. Special feature/Sección especial
investments to improve productivity and exploit less accessible reserves, ceteris paribus,
can impact profitability and in turn tax receipts. This is especially relevant as CIT and
other profit-based instruments are the primary mechanism in the region for capturing the
economic rents arising from mining (OECD et al., 2020[12]; Hanni et al., 2018[13]).
Table 3.3. International prices and production of metals and minerals in selected
LAC countries, 2018-19
Price Production by country in thousands of metric tons unless otherwise specified
Metals Year and
(US dollars) Dominican
and minerals percent change Argentina Bolivia Brazil Chile Colombia Jamaica Mexico Peru
and % Republic
Copper 2018 6529.8 5.2 750.6 5831.6 473.6 2437.0
2019 6010.1 4.5 363.3 5787.4 486.9 2455.4
% change -8.0 -14.1 -51.6 -0.8 2.8 0.8
Zinc 2018 2922.4 519.6 381.5 1474.4
2019 2550.4 528.1 325.3 1404.4
% change -12.7 1.6 -14.7 -4.7
Lead 2018 2240.4 112.0 131.8 289.1
2019 1996.5 88.0 149.1 308.1
% change -10.9 -21.5 13.1 6.6
Tin 2018 20145.2 17.3 19.3 18.6
2019 18661.2 17.1 14.9 19.9
% change -7.4 -0.7 -23.1 6.7
Nickel 2018 13114.1 67.7 43.0
2019 13913.9 55.7 40.6
% change 6.1 -17.7 -5.8
Iron 2018 69.8 317502.4 8942.6 575.5 7085.4 9533.9
2019 93.8 255272.6 8427.2 665.2 7140.9 10120.0
% change 34.5 -19.6 -5.8 15.6 0.8 6.1
Coal 2018 107.0 86255.2 8151.8
2019 77.9 84342.8 6616.9
% change -27.2 -2.2 -18.8
Bauxite / 2018 2108.5 19437.8 10058.2
alumina 2019 1794.5 15248.5 9022.3
% change -14.9 -21.6 -10.3
Gold 2018 1269.2 59.8 6.2 85.4 37.1 35.6 32.3 91.2 140.2
(metric tons) 2019 1392.5 59.8 5.5 75.2 38.5 36.7 31.9 73.5 128.4
% change 9.7 0.0 -11.6 -11.9 3.7 3.1 -1.2 -19.5 -8.4
Silver 2018 15.7 545.5 1191.6 1370.2 16.0 169.8 3694.0 4160.2
(metric tons) 2019 16.2 715.3 1153.1 1309.3 11.7 108.7 3498.5 3860.3
% change 3.2 31.1 -3.2 -4.4 -26.9 -36.0 -5.3 -7.2
Source: Economic Commission for Latin America and the Caribbean (ECLAC), on the basis of World Bank Commodity Price Data
(The Pink Sheet), World Bank; Instituto Nacional de Estadísticas del Estado Plurinacional de Bolivia, estadísticas mineras; Agência
Nacional de Mineração do Brasil, Anuário Mineral Brasileiro: Principais Substâncias Metálicas; Comisión Chilena de Cobre (Cochilco),
Anuario de Estadísticas del Cobre y Otros Minerales 2000-2019; Agencia Nacional de Minería de Colombia, Sistema de Información Minero
Colombiano; Jamaica Bauxite Institute, Local Bauxite/Alumina; Monthly Statistical Bulletin; Instituto Nacional de Estadística y Geografía
de México, Estadística Mensual de la Industria Minerometalúrgica and Ministerio de Energía y Minas del Perú, Reporte de la producción
minera anual.
12 https://doi.org/10.1787/888934235050
Despite these overall trends, mining revenues in LAC registered a modest decline in
2019. For the year these revenues reached USD 12.7 billion, down 3.9% from USD 13.2 billion
in 2018 (Table 3.4). However, this result was due in large part to the exceptional increase in
mining revenues in Brazil (+75.1% in USD terms). Excluding Brazil, overall revenues in LAC
fell 17.3%. Mining revenues as a share of GDP registered a slight decline between years, with
a marginal increase in tax revenues offset by a greater decline in non-tax revenues. Results
at the country level, however, varied significantly.
Revenue Statistics in Latin America and the Caribbean 2021 © OECD/UNITED NATIONS/CIAT/IDB 2021
144 ESTADÍSTICAS TRIBUTARIAS EN AMÉRICA LATINA Y EL CARIBE 2021 © OCDE/NACIONES UNIDAS/CIAT/BID 20213. Special feature/Sección especial
Table 3.4. General government fiscal revenues from mining in nine LAC countries,
by type of revenue, 2018-19
Percentage of GDP unless otherwise specified
Region / country
Type of Bolivia
Period Dominican
revenue LAC Argentina (Plurinational Brazil Chile Colombia Ecuador Guatemala Jamaica Mexico Peru
Republic
State of)
Total 2018 0.39 0.04 0.85 0.10 1.40 0.45 0.21 0.08 0.01 0.04 0.23 0.90
revenues 2019 0.37 0.04 1.11 0.18 1.31 0.32 0.22 0.08 0.01 0.04 0.18 0.62
2019-2018 -0.02 0.01 0.27 0.08 -0.10 -0.13 0.02 0.00 0.00 -0.01 -0.05 -0.28
(p.p. of GDP)
2019-2018 .. 70.6 33.3 88.2 -3.3 -24.5 16.5 -0.7 -24.9 -12.9 -18.3 -28.7
(% change in NC)
2019-2018 -3.9 -0.5 33.3 75.1 -11.8 -32.0 12.4 -0.7 -26.6 -15.8 -18.3 -29.8
(% change in USD)
Tax revenues 2018 0.23 0.03 0.37 0.05 0.82 0.19 0.15 0.03 0.01 0.00 0.20 0.72
2019 0.24 0.03 0.64 0.11 0.98 0.10 0.17 0.03 0.01 0.00 0.15 0.42
2019-2018 0.01 0.00 0.27 0.06 0.16 -0.09 0.02 0.00 0.00 0.00 -0.04 -0.30
(p.p. of GDP)
Non-tax 2018 0.16 0.01 0.48 0.05 0.58 0.26 0.05 0.05 0.00 0.04 0.03 0.19
revenues 2019 0.13 0.01 0.48 0.07 0.32 0.21 0.05 0.05 0.00 0.04 0.03 0.20
2019-2018 -0.03 0.00 0.00 0.02 -0.26 -0.05 0.00 0.00 0.00 -0.01 0.00 0.01
(p.p. of GDP)
of which: 2018 0.14 0.01 0.48 0.05 0.38 0.26 0.05 0.03 0.00 0.04 0.03 0.18
royalties and 2019 0.13 0.01 0.48 0.07 0.32 0.21 0.05 0.03 0.00 0.04 0.03 0.20
production 2019-2018 -0.01 0.00 0.00 0.02 -0.06 -0.05 0.00 0.00 0.00 -0.01 0.00 0.02
levies (p.p. of GDP)
2019-2018 -1.4 28.1 0.9 33.3 -19.2 -20.0 -1.1 -4.1 -49.8 -15.8 -7.0 11.3
(% change in USD)
Note: The revenue-to-GDP ratio for Latin America and the Caribbean (LAC) corresponds to a simple average of the countries included in
the sample. Figures may not sum due to rounding.
Source: Economic Commission for Latin America and the Caribbean (ECLAC), based on data from CEPALSTAT (2020[3]).
12 https://doi.org/10.1787/888934235069
Fiscal revenues from mining rose significantly in the Plurinational State of Bolivia despite
falling output volumes and weak international prices. During the year, production at the
San Cristóbal mine – one of the largest in the country – was impacted by a month-long strike
in August 2019 as well as scheduled maintenance in October (BCB, 2020[4]). Nevertheless,
overall mining fiscal revenues rose from 0.85% of GDP in 2018 to 1.11% of GDP in 2019 on
the back of buoyant tax revenues bolstered by strong 2018 fiscal year financial results and a
large advance payment on 2020 taxes made at the end of 2019 (BCB, 2019[14]; MSC, 2020[15]).
Tax revenues were also likely boosted by a general tax amnesty, established by Law #1105
Regularization of Taxes at the Central Level of the State (Regularización de Tributos del Nivel
Central del Estado), that was enacted during the year.
During 2019, the mining sector in Brazil was marked by a tailings dam failure at the
Corrego do Feijão mine operated by Vale S.A. in Brumadinho that occurred on 25 January.
The resulting mudflow inundated local communities and farms, leading to the death of
270 individuals and significant damage to the local eco-system. Despite lower production
because of the disaster, the jump in iron ore prices globally resulted in a significant increase
in mining revenues, which rose to 0.18% of GDP from 0.10% of GDP in 2018, a 75.1% increase
in USD terms. CIT payments by Vale more than doubled, despite recording a financial loss
for the year, as financial provisions for the Brumadinho disaster could not be deducted from
the calculation of taxable income until they are effectively incurred (Vale, 2020[16]). Royalty
payments from the Compensation for Exploitation of Mineral Resources (Compensação
Revenue Statistics in Latin America and the Caribbean 2021 © OECD/UNITED NATIONS/CIAT/IDB 2021
ESTADÍSTICAS TRIBUTARIAS EN AMÉRICA LATINA Y EL CARIBE 2021 © OCDE/NACIONES UNIDAS/CIAT/BID 2021 1453. Special feature/Sección especial
Financeira pela Exploração de Recursos Minerais) and the Rate for Controlling, Monitoring
and Supervision of Exploration and Mining Activities of Mineral Resources (Taxa de
Fiscalização de Recursos Minerários) of the State of Minas Gerias reached a record level,
rising 33.3% in USD terms.
Fiscal revenues from mining in Chile declined in 2019 as a result of lower copper output
and falling international prices. During the year, total revenues dropped to 1.31% of GDP
compared to 1.40% of GDP in 2018. Nevertheless, this overall trend belies a more complex
dynamic at the level of individual fiscal instruments. Non-tax revenues contracted sharply
as dividend payments by Codelco, the State-owned copper producer, fell to nil. In 2018, the
company made excess payments that were subsequently deducted from those that were
due for 2019 (DIPRES, 2019[17]). Tax revenues, in contrast, rose as the liquidation of prior year
tax liabilities of private producers strengthened due in part to the final increase in the CIT
rate as established in the 2014 tax reform.6
The collapse in international prices for coal provoked a sharp decrease in mining
revenues in Colombia. Lower tax and non-tax receipts contributed to the decline in overall
revenues, which reached 0.32% of GDP compared to 0.45% of GDP in 2018. CIT payments of
companies operating in the coal sector, who accounted for 79% of mining CIT receipts in
2018, more than halved (-58%) as profits were impacted by lower prices. Likewise, non-tax
revenues from royalties associated with coal production registered a significant decline, in
line with coal prices, although this was offset in part by higher receipts from gold production.
Robust gold prices buoyed mining revenues in the Dominican Republic in 2019, which
rose to 0.22% of GDP from 0.21% of GDP in 2018, or an increase of 12.4% in USD terms. While
gold production contracted slightly, the near 10% increase in the annual average price more
than compensated, bolstering profitability and CIT receipts. During the year, the government
proposed new legislation for regulating the mining sector – National Mining Law (Ley de
Minería) – that would establish a minimum State participation in mining rents among other
modifications.
In Ecuador, revenues from mining contracted marginally (-0.7% in USD terms) in 2019
due to lower property rents. Royalty payments have exhibited significant swings in the
preceding years as operators of new mines liquidate advance payments as part of their
agreements with the government. Excluding these advance payments, revenues from
royalties rose 23.9% in USD terms, reflecting higher production and the favourable increase
in the price of gold. Several large-scale mining operations commenced production during
the year. The Mirador open-pit copper and gold mine, owned by a consortium of companies
led by Tongling Nonferrous Metals Group (China), commenced production in June. This was
followed in November, when the Fruta del Norte mine, operated by Lundin Gold (Canada),
began production with exports of gold commencing by year’s end.
Mining revenues continued to fall in Guatemala, as the country grappled with social
conflicts associated with the sector. Several of the country’s largest mines remain closed.
A consultative process with local communities, being held within the framework of ILO-
Convention 169, is ongoing.
In Jamaica, mining revenues from bauxite and alumina showed little dynamism,
continuing the trend observed in recent years. While total revenues were essentially
unchanged relative to GDP, they contracted 15.8% in USD terms as receipts of the bauxite
levy fell to nil.
Revenue Statistics in Latin America and the Caribbean 2021 © OECD/UNITED NATIONS/CIAT/IDB 2021
146 ESTADÍSTICAS TRIBUTARIAS EN AMÉRICA LATINA Y EL CARIBE 2021 © OCDE/NACIONES UNIDAS/CIAT/BID 20213. Special feature/Sección especial
Fiscal revenues from mining in Mexico contracted in 2019, as lower precious metals
output and falling prices for industrial metals reduced the profitability of the sector. During
the year several mines, such as Peñasquito gold and silver mine in Zacatecas operated by
Newmont-Goldcorp, were temporarily shuttered as a result of protests (Camimex, 2020[18]).
These price and production dynamics served to reduce CIT receipts, which in turn left total
revenues at 0.18% of GDP, down from 0.23% of GDP in 2018.
Mining revenues in Peru contracted significantly during the year as falling prices offset
production gains for some of the country’s key export goods. Total fiscal revenues from
mining fell to 0.62% of GDP from 0.9% of GDP in 2018, led by a 0.3 percentage point decline
in tax receipts from the sector. CIT receipts weakened as a result of lower profits caused by
social conflicts, environmental issues and reduced production.7 Rising non-tax revenues
offset this decline in part, although this increase was due largely to extraordinary receipts.
During the year, mining companies liquidated a significant amount of accumulated royalty
liabilities from previous periods (MEF Peru, 2020[19]). These receipts accounted for 12% of
royalty revenue in 2019 and in their absence revenues from this instrument would have
registered no change compared to 2018 as a percentage of GDP.
The outbreak of the COVID-19 pandemic and the resulting economic paralysis
has strongly impacted the region’s non-renewable natural resources related
revenues
The COVID-19 pandemic has created an unprecedented human, social and economic
crisis that has enveloped the entire world. Public health measures to prevent the spread
of the virus and protect human life have resulted in the paralysation of economic activity,
rising unemployment and increasing poverty in many countries. In LAC, the crisis is forecast
to result in a 7.7% contraction of GDP in 2020, the largest decline in the last century (ECLAC,
2021[20]). Governments in LAC have responded to the crisis by implementing ambitious
packages of fiscal and financial measures – including tax relief, public spending and liquidity
measures – to bolster public health systems, support families and limit damage to productive
capacity (ECLAC, 2020[21]).
This context notwithstanding, the impact of the crisis on international commodity
markets has been mixed. During the first half of the year, spot prices fell sharply as economic
activity and private consumption collapsed (Figure 3.3). Nevertheless, the prices of many
minerals and metals rebounded and exceed their pre-pandemic levels by year’s end, largely
due to accelerating industrial output and investment in China and supply disruptions for
some minerals and metals caused by the pandemic (World Bank, 2020[22]). Oil markets,
however, were turbulent after experiencing a sharp drop in spot prices in March and April.
In April, OPEC and non-OPEC partners agreed to a large-scale cut in production – 9.7 million
barrels per day – during May and June, which would be slowly tapered over time. Nevertheless,
the price of crude oil was slow to rebound, reflecting in part continued weakness in demand,
particularly among advanced economies.
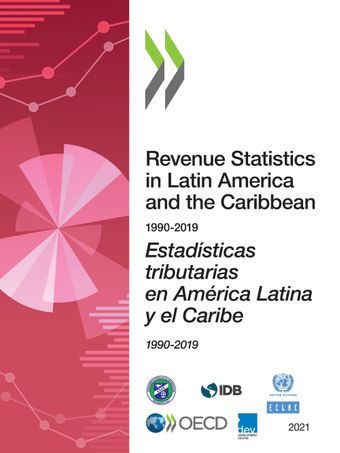
Fiscal revenues from non-renewable natural resources in LAC largely moved with global
market conditions in 2020 (Figure 3.4). In the first half of the year oil and gas revenues in
Ecuador and Mexico, essentially property rents tied to the commercial value of production,
tumbled as a result of the decline in spot prices and lower production levels. In Mexico,
hydrocarbons output slowed between May and July in line with commitments made under
the OPEC+ agreement in April, although the country declined to extend these reductions
Revenue Statistics in Latin America and the Caribbean 2021 © OECD/UNITED NATIONS/CIAT/IDB 2021
ESTADÍSTICAS TRIBUTARIAS EN AMÉRICA LATINA Y EL CARIBE 2021 © OCDE/NACIONES UNIDAS/CIAT/BID 2021 1473. Special feature/Sección especial
beyond June (PEMEX, 2020[8]). Additionally, receipts from the Profit-Sharing Duty – the largest
single generator of oil and gas revenues – fell as the levy rate declined from 65% to 58%
as stipulated as part of the Hydrocarbons Revenue Law of 2014. Oil production in Ecuador
also contracted sharply in the first half of the year – by 60% year-on-year in April and 37%
in May – due in part to the rupture of hydrocarbons transport infrastructure in April (BCE,
2020[23]; MEF Ecuador, 2020[24]).8 By mid-year the rate of decline in oil and gas revenues was
attenuated by an increase in prices, but revenues for the year were sharply lower, down 38%
in real terms in Ecuador and 56% in Mexico.
Figure 3.3. International spot prices for crude oil and selected minerals and metals, 2020
Index = 100 based on US dollars at current prices
Iron ore Copper Tin Nickel Zinc Crude oil, Brent
180
160
140
120
100
80
60
40
20
0
Jan Feb Mar Apr May Jun Jul Aug Sep Oct Nov Dec
Source: Economic Commission for Latin America and the Caribbean (ECLAC), on the basis of World Bank Commodity Price Data (The Pink
Sheet), World Bank.
12 https://doi.org/10.1787/888934234898
Mining revenues also contracted sharply in the first half of the year. Tax revenues, in
particular CIT receipts, declined due to falling prices, lower estimated tax payments and
COVID-19 related tax relief measures such as tax deferrals. As a result, overall mining
revenues in Chile and Peru fell between April and July, reflecting the important role the CIT
plays in capturing the economic rents generated by the sector. However, in contrast to the
tepid recovery of crude oil prices, the dynamism of minerals and metals prices in the second
half of year supported a rebound in revenues. The fourth quarter was especially strong in
Chile, although this was due in part to a USD 200 million advance payment of 2021 dividends
by the State-owned producer Codelco (DIPRES, 2020[25]). In Peru, despite registering a more
modest increase in the last three months of the year, due to weak CIT receipts, non-tax
revenues from royalties rose sharply (+20% year-on-year in real terms). Nevertheless, taken
as a whole mining revenues declined markedly in 2020 in real terms, by 21.6% in Peru and
12.5% in Chile.
Revenue Statistics in Latin America and the Caribbean 2021 © OECD/UNITED NATIONS/CIAT/IDB 2021
148 ESTADÍSTICAS TRIBUTARIAS EN AMÉRICA LATINA Y EL CARIBE 2021 © OCDE/NACIONES UNIDAS/CIAT/BID 20213. Special feature/Sección especial
Figure 3.4. General government fiscal revenues from non-renewable natural resources
in selected Latin American countries, by commodity, 2020
Year-on-year real variation in percentage
A. Hydrocarbons B. Mining
Ecuador Mexico Chile Peru
% %
20 100
80
0
60
-20 40
20
-40
0
-60
-20
-80 -40
-60
-100
-80
-120 -100
Source: Economic Commission for Latin America and the Caribbean (ECLAC), on the basis of official figures.
12 https://doi.org/10.1787/888934234917
Projecting fiscal revenues from non-renewable natural resources for Latin America and
the Caribbean in this environment is fraught with peril. The evolution of the pandemic at
the global level and in the region remains uncertain. An up-tick in cases could precipitate
another round of closures that would impact economic activity, putting downward pressure
on demand for commodities. Geopolitical and trade tensions remain high and could upset
market conditions, particularly in the global oil market. Tax relief measures, whose effect is
difficult to model, could shift revenues from 2020 to 2021. Likewise, the expected financial
losses of companies operating in the sector could sharply reduce revenues and, in some
cases, may result in tax refunds if pre-payments exceed final tax liabilities. Based on results
in Ecuador and Mexico, oil revenues in LAC on average are likely to have ended 2020 well
below their 2019 levels. Similarly, mining revenues are likely to have contracted, as revealed
by final data in Chile and Peru, as a result of falling CIT receipts and lower production despite
the quick rebound in international prices.
Notes
1. The importance of these extraordinary revenues on overall public revenues cannot be overstated.
In Brazil, total revenues of the federal government rose from 21.6% of GDP in 2018 to 22.5% of
GDP in 2019, an increase of 0.9 percentage points of GDP. Excluding the receipts from oil and gas
concession signing bonuses (1.0% of GDP) would have left federal government revenues essentially
flat, with consequences for the overall and primary balances. Likewise, in Trinidad and Tobago central
government total revenues rose from 27.2% of GDP in 2018 to 28.8% of GDP in 2019, an increase of
1.6 percentage points of GDP, largely on the back of extraordinary oil revenues (1.7% of GDP) that
offset declines in other sources.
Revenue Statistics in Latin America and the Caribbean 2021 © OECD/UNITED NATIONS/CIAT/IDB 2021
ESTADÍSTICAS TRIBUTARIAS EN AMÉRICA LATINA Y EL CARIBE 2021 © OCDE/NACIONES UNIDAS/CIAT/BID 2021 1493. Special feature/Sección especial
2. Statistics in ECLAC’s Fiscal Revenues from Non-Renewable Natural Resources in Latin America and
the Caribbean database for Mexico have been updated to refer solely to federal government oil and
gas revenues.
3. UN Comtrade Database.
4. World Bureau of Metal Statistics press release, “January to December 2019 Metals Balances”,
19th of February 2020.
5. Ore grade refers to the concentration of metal or mineral in the ore.
6. Servicios de Impuestos Internos (SII) press release, “Impuestos declarados en Operación Renta
aumentaron un 16,2% real respecto del año anterior”, 18th of July 2019.
7. SUNAT press release “RECAUDACIÓN TRIBUTARIA CONSOLIDÓ SU RECUPERACIÓN Y CRECIÓ 3,7%
EL 2019”, Nota de Prensa N° 003-2020.
8. Ecuador did not participate in the OPEC+ production cuts of 2020. The country officially exited OPEC
effective 1st of January 2020.
References
BCB (2020), Memoria 2019, Banco Central de Bolivia, https://www.bcb.gob.bo/?q=pub_memorias-
institucionales.[4]
BCB (2019), Memoria 2018, Banco Central de Bolivia, https://www.bcb.gob.bo/?q=pub_memorias-
institucionales.[14]
BCE (2020), Información Estadística Mensual No. 2026 – Diciembre 2020, Banco Central de Ecuador, https://
contenido.bce.fin.ec/home1/estadisticas/bolmensual/IEMensual.jsp.[23]
BCE (2020), Reporte del Sector Petrolero, IV Trimestre de 2019, Banco Central de Ecuador, https://contenido.
bce.fin.ec/documentos/Estadisticas/Hidrocarburos/ASP201906.pdf.[6]
Camimex (2020), Informe Anual 2020, Cámara Minera de México, https://camimex.org.mx/application/
files/4416/0204/8995/02_info_2020.pdf.[18]
DIPRES (2020), Informe de Ejecución del Gobierno Central Cuarto Trimestre 2020, Dirección de Presupuestos,
Ministerio de Hacienda, Chile, http://bibliotecadigital.dipres.gob.cl/handle/11626/17632.[25]
DIPRES (2019), Informe de Ejecución del Gobierno Central Cuarto Trimestre 2019, Dirección de Presupuestos,
Ministerio de Hacienda, Chile, https://www.dipres.gob.cl/598/articles-187247_doc_pdf_Presentacion_
IT.pdf.[17]
ECLAC (2021), Preliminary Overview of the Economies of Latin America and the Caribbean 2020, United Nations
Economic Commission for Latin America and the Caribbean, https://www.cepal.org/en/publications/
46504-preliminary-overview-economies-latin-america-and-caribbean-2020.[20]
ECLAC (2020), “Fiscal revenues from non-renewable natural resources”, CEPALSTAT (database), United Nations
Economic Commission for Latin America and the Caribbean, https://estadisticas.cepal.org/cepalstat/
web_cepalstat/estadisticasIndicadores.asp?idioma=i.[3]
ECLAC (2020), Fiscal Panorama of Latin America and the Caribbean 2020, United Nations Economic
Commission for Latin America and the Caribbean, https://www.cepal.org/en/publications/45731-fiscal-
panorama-latin-america-and-caribbean-2020-fiscal-policy-amid-crisis.[21]
EIA (2020), Short-Term Energy Outlook, October 2020, United States Energy Information Administration,
https://www.eia.gov/outlooks/steo/data.php?type=figures.[1]
FMPED (2020), Informe anual 2019, Fondo Mexicano del Petróleo para la Estabilización y el Desarrollo,
https://www.fmped.org.mx/transparencia/%7BE2BBCC11-A6A2-F5FF-25D7-F1E291954902%7D.pdf.[9]
Hanni, M., J. Jimenez and I. Ruelas (2018), Ciclo de precios y regímenes fiscales vinculados con los recursos
naturales no renovables en América Latina y el Caribe, Serie de Macroeconomía del Desarrollo,
United Nations Economic Commission for Latin America and the Caribbean, https://www.cepal.org/
es/publicaciones/44239-ciclo-precios-regimenes-fiscales-vinculados-recursos-naturales-renovables.[13]
IMF (2019), World Economic Outlook, October 2019: Global Manufacturing Downturn, Rising Trade Barriers,
International Monetary Fund, Washington, D.C., https://www.imf.org/en/Publications/WEO/Issues/
2019/10/01/world-economic-outlook-october-2019.[10]
Revenue Statistics in Latin America and the Caribbean 2021 © OECD/UNITED NATIONS/CIAT/IDB 2021
150 ESTADÍSTICAS TRIBUTARIAS EN AMÉRICA LATINA Y EL CARIBE 2021 © OCDE/NACIONES UNIDAS/CIAT/BID 20213. Special feature/Sección especial
MEF Ecuador (2020), Informe Semestral de Ejecución, Presupuesto General del Estado, Enero-Junio 2020,
Ministry of Economy and Finance of Ecuador, https://www.finanzas.gob.ec/wp-content/uploads/
downloads/2020/09/28092020-Informe-semestral-ejecucion-2020-CNv6-RL.pdf.[24]
MEF Peru (2020), Marco Macroeconómico Multianual 2020-2023, Ministry of Economy and Finance of Peru,
https://www.mef.gob.pe/contenidos/pol_econ/marco_macro/MMM_2020_2023.pdf.[19]
MINFIN (2019), Liquidación del Presupuesto, General de Ingresos y Egresos del Estado y Cierre Contable, Ejercicio
fiscal Enero – Diciembre 2018, Ministry of Finance of Guatemala, https://www.minfin.gob.gt/images/
archivos/liquidacion/2018/enero_diciembre2018.pdf.[7]
MSC (2020), Reporte de Sostenibilidad 2019, Minera San Cristobal, https://www.minerasancristobal.com/v3/
es/wp-content/uploads/2020/09/Reporte_de_Sostenibilidad_2019_MSC.pdf.[15]
OECD et al. (2020), Revenue Statistics in Latin America and the Caribbean 2020, OECD Publishing, Paris, https://
dx.doi.org/10.1787/68739b9b-en-es.[12]
OPEC (2020), Annual Statistical Bulletin 2020, Organization of the Petroleum Exporting Countries, https://
www.opec.org/opec_web/en/publications/202.htm.[2]
PEMEX (2020), Annual Report submitted to the United States Securities and Exchange Commission (20-F),
Petróleos Mexicanos, https://www.pemex.com/en/investors/regulatory-filings/Paginas/sec-filings.
aspx.[8]
Petrobras (2020), Annual Report and Form 20-F, Petróleo Brasileiro S.A., https://www.investidorpetrobras.com.
br/en/results-and-notices/annual-reports/.[5]
Vale (2020), Relatório de Transparência Fiscal 2019, Vale S.A., http://www.vale.com/esg/pt/Documents/
Relat%C3%B3rio%20de%20Transpar%C3%AAncia%20Fiscal%202019_pt%201.pdf.[16]
World Bank (2020), Commodity Markets Outlook, October 2020, World Bank, Washington, D.C., https://
openknowledge.worldbank.org/handle/10986/34621.[22]
World Bank (2019), Commodity Markets Outlook, October 2019, World Bank, Washington, D.C., https://
openknowledge.worldbank.org/handle/10986/32633.[11]
Revenue Statistics in Latin America and the Caribbean 2021 © OECD/UNITED NATIONS/CIAT/IDB 2021
ESTADÍSTICAS TRIBUTARIAS EN AMÉRICA LATINA Y EL CARIBE 2021 © OCDE/NACIONES UNIDAS/CIAT/BID 2021 151Revenue Statistics in Latin America and the Caribbean 2021/
Estadísticas tributarias en América Latina y el Caribe 2021
Capítulo 3
SECCIÓN ESPECIAL
Ingresos fiscales provenientes de recursos
naturales no renovables en América Latina
y el Caribe
Esta sección especial fue preparada por Michael Hanni, Oficial de Asuntos Económicos, Unidad de Asuntos Fiscales,
División de Desarrollo Económico, Comisión Económica para América Latina y el Caribe (CEPAL).
1533. Special feature/Sección especial
Principales hallazgos
Tendencias de los ingresos fiscales provenientes de recursos naturales no renovables
en 2019
Los ingresos fiscales provenientes de la exploración y producción de petróleo y gas en
América Latina y el Caribe (ALC) aumentaron en 2019 a pesar de las desfavorables condiciones
del mercado global. El aumento de los ingresos por hidrocarburos, que alcanzaron el 2.7%
del PIB en promedio en comparación con el 2.5% del PIB en 2018, se debió en gran parte a los
ingresos extraordinarios. Las bonificaciones de firma para nuevas concesiones de petróleo y
gas generaron un exceso de ingresos equivalente al 1% del PIB en Brasil. En Trinidad y Tobago,
los pagos en virtud de un programa de amnistía fiscal y los ingresos derivados de un acuerdo
negociado con un gran productor dieron como resultado un aumento único equivalente al
1.6% del PIB. Sin embargo, las rentas de la propiedad cayeron durante el año en línea con los
precios internacionales, ya que la producción regional se mantuvo en gran medida plana.
Los bajos precios internacionales para una variedad de minerales y metales industriales y la
menor producción llevaron a una disminución de los ingresos mineros de ALC durante 2019.
La variación interanual en relación con el PIB fue marginal: los ingresos promedio cayeron
a 0.37% del PIB desde un 0.39% durante 2018. Del mismo modo, los ingresos agregados en
dólares estadounidenses disminuyeron levemente (-3.9%), aunque la magnitud de la caída
se redujo debido a un fuerte aumento en Brasil (+75.1%). Excluyendo Brasil, los ingresos
totales disminuyeron un 17.3% en términos de dólares estadounidenses, con importantes
contracciones registradas en Chile, Colombia, Guatemala, Jamaica, México y Perú.
El impacto de la pandemia COVID-19 en los ingresos provenientes de actividades
extractivas
La pandemia COVID-19 ha provocado una de las mayores crisis sociales y económicas
de los tiempos modernos. También ha creado una gran agitación en los mercados de
productos básicos. Los mercados petroleros se han visto especialmente afectados con la
disminución significativa de la demanda, principalmente en las economías avanzadas, lo
que ha provocado una fuerte caída de los precios spot del crudo. Por el contrario, los precios
internacionales de los minerales y metales se recuperaron rápidamente después de una
caída inicial, gracias a la aceleración de la producción industrial en China. Los datos de alta
frecuencia para una muestra de países sugieren que es probable que haya una disminución
significativa en los ingresos fiscales de los recursos naturales no renovables a nivel regional
para el año en relación con 2019.
Aumentan los ingresos provenientes de hidrocarburos en América Latina,
impulsados por ingresos extraordinarios
Los mercados mundiales de petróleo se estabilizaron hasta cierto punto durante 2019,
tras la volatilidad observada en el cuarto trimestre de 2018 relacionada con un exceso de
oferta significativa. En diciembre de 2018, los miembros de la OPEP y los países productores
de petróleo aliados, sobre todo la Federación de Rusia, se comprometieron a reducir su
volumen total de producción en 1.2 millones de barriles diarios combinados (0.8 millones
Revenue Statistics in Latin America and the Caribbean 2021 © OECD/UNITED NATIONS/CIAT/IDB 2021
154 ESTADÍSTICAS TRIBUTARIAS EN AMÉRICA LATINA Y EL CARIBE 2021 © OCDE/NACIONES UNIDAS/CIAT/BID 20213. Special feature/Sección especial
para los miembros de la OPEP) durante el primer semestre de 2019. En general el acuerdo fue
exitoso y la producción mundial de combustibles líquidos se desaceleró notablemente en el
primer trimestre de 2019 (Gráfico 3.1). Los precios spot del petróleo crudo se recuperaron a
medida que el mercado se movió hacia un mayor equilibrio durante los primeros meses del
año. No obstante, los precios volvieron a mostrar una tendencia a la baja en mayo debido
al debilitamiento de los fundamentos macroeconómicos, el aumento de las tensiones
comerciales entre China y Estados Unidos y la acumulación de reservas de crudo en Estados
Unidos. En respuesta, la OPEP y los exportadores aliados acordaron en julio extender
los recortes de producción de petróleo crudo hasta 2020. A pesar de estas tendencias, el
consumo de petróleo se disparó en la segunda mitad del año, impulsado en gran medida
por las importaciones récord de petróleo crudo en China, como resultado de la entrada en
funcionamiento de nuevas megarrefinerías. A pesar del repunte registrado en el cuarto
trimestre, los precios spot del petróleo crudo en promedio presentaron una caída durante el
año, el Brent cayó un 10% (de USD 71.1 por barril a USD 64.0) y el Western Texas Intermediate
(WTI) disminuyó en un 12% (desde USD 64.8 por barril a USD 57.0).
Gráfico 3.1. Balanza mundial de producción y consumo de combustibles líquidos y precios spot
internacionales del petróleo crudo, 2018-19
A. Oferta y demanda mundial de petróleo crudo B. Precios spot internacionales
(millones de barriles por día) (dólares por barril)
Consumo Producción Western Texas Intermediate (WTI) Brent
103 85
102.3
101.7
80
101.6
102
75
100.5
101
100.3
100.2
70
99.9
100 65
99.4
60
99
55
98
50
100.0
100.3
101.3
100.8
100.5
101.1
102.3
101.9
97 45
T1 T2 T3 T4 T1 T2 T3 T4
Nov
Nov
Ene
Feb
Ago
Sep
Ene
Feb
Ago
Sep
Oct
Oct
Mar
Abr
Mar
Abr
May
Dic
May
Dic
Jun
Jun
Jul
Jul
2018 2019 2018 2019
Fuente: Comisión Económica para América Latina y el Caribe (CEPAL), sobre la base de EIA (2020[1]) y Datos de Precios de Materias Primas
del Banco Mundial (The Pink Sheet), Banco Mundial.
12 https://doi.org/10.1787/888934234936
Los niveles de producción de hidrocarburos en ALC variaron significativamente a nivel
de país en 2019 (Cuadro 3.1). La producción total de petróleo crudo se redujo sustancialmente,
contrayéndose en un 4.9% debido en gran parte a la caída del 37.7% de la producción en la
República Bolivariana de Venezuela. Aunque la producción aumenta ligeramente al excluir
a Venezuela, principalmente por el repunte de la producción en Brasil y, en menor medida,
en Argentina, Colombia y Ecuador, mientras que la producción de petróleo crudo en México
se redujo significativamente. La producción total de gas natural también registró una
Revenue Statistics in Latin America and the Caribbean 2021 © OECD/UNITED NATIONS/CIAT/IDB 2021
ESTADÍSTICAS TRIBUTARIAS EN AMÉRICA LATINA Y EL CARIBE 2021 © OCDE/NACIONES UNIDAS/CIAT/BID 2021 1553. Special feature/Sección especial
disminución debido a la caída de la producción en la República Bolivariana de Venezuela,
México y el Estado Plurinacional de Bolivia. Sin embargo, estas caídas fueron atenuadas en
cierta medida por aumentos en Argentina (donde la producción alcanzó su nivel más alto
desde 2009), Brasil, Perú y Trinidad y Tobago.
Cuadro 3.1. Producción de petróleo crudo y gas natural en América Latina y el Caribe y grupos
de países seleccionados, 2018-19
Petróleo crudo Gas natural
(miles de barriles diarios) (miles de millones de metros cúbicos)
Grupos de países seleccionados
2019-2018 2019-2018
2018 2019 2018 2019
(variación %) (variación %)
América Latina y el Caribe 8 012 7 632 -4.7 199 196 -1.4
excluyendo a Venezuela 6 502 6 619 1.8 174 176 0.8
Argentina 489 509 3.9 41 43 5.7
Bolivia .. .. .. 19 17 -10.7
Brasil 2 587 2 788 7.8 22 24 9.5
Colombia 865 886 2.4 10 10 3.1
Ecuador 517 531 2.6 0 0 ..
Guatemala 9 10 4.1 .. .. ..
México 1 813 1 678 -7.4 33 31 -6.8
Perú 49 53 8.4 12 13 0.7
Trinidad y Tobago 64 59 -7.3 35 36 2.1
Venezuela 1 510 1 013 -32.9 25 21 -17.1
Otros 115 113 -1.3 1 1 2.0
Total mundial 75 822 75 263 -0.7 3 946 4 093 3.7
OPEP 31 238 29 375 -6.0 .. .. ..
Arabia Saudita 10 317 9 808 -4.9 .. .. ..
No-OPEP 44 584 45 887 2.9 .. .. ..
Federación Rusa 10 527 10 625 0.9 .. .. ..
Estados Unidos 10 991 12 232 11.3 .. .. ..
Fuente: Comisión Económica para América Latina y el Caribe (CEPAL) sobre la base de OPEP (2020 [2]).
12 https://doi.org/10.1787/888934235088
Los ingresos fiscales de la exploración y producción de petróleo y gas en ALC
aumentaron en 2019 a pesar del contexto internacional imperante, caracterizado por
la caída de los precios spot del petróleo crudo y las tendencias de producción regional
(Cuadro 3.2). Los ingresos totales provenientes de hidrocarburos en la región alcanzaron
USD 79.8 mil millones en 2019, un 10.4% más que en 2018. En términos relativos, este
resultado fue relativamente modesto, equivalente al 2.7% del PIB en promedio en
comparación con el 2.5% del PIB en 2018. Si bien la mayor producción y las depreciaciones
monetarias lograron suavizar el impacto de los menores precios internacionales en algunos
países, el aumento de los ingresos se debió en gran parte a los ingresos extraordinarios.
Brasil y Trinidad y Tobago registraron ingresos petroleros extraordinarios durante el
año equivalentes al 1.0% del PIB y al 1.6% del PIB, respectivamente1. Excluyendo estas
transacciones, los ingresos por hidrocarburos se contrajeron un 14.8% en términos de
dólares estadounidenses (USD). Esto se correlaciona con la trayectoria de los ingresos
por regalías y gravámenes a la producción ligados al valor comercial de la producción,
los cuales cayeron 12.6% en términos de USD en línea con los precios internacionales y la
Revenue Statistics in Latin America and the Caribbean 2021 © OECD/UNITED NATIONS/CIAT/IDB 2021
156 ESTADÍSTICAS TRIBUTARIAS EN AMÉRICA LATINA Y EL CARIBE 2021 © OCDE/NACIONES UNIDAS/CIAT/BID 2021You can also read