Spray solution pH and soybean injury as influenced by synthetic auxin formulation and spray additives
←
→
Page content transcription
If your browser does not render page correctly, please read the page content below
Weed Technology                                       Spray solution pH and soybean injury as
        www.cambridge.org/wet
                                                              influenced by synthetic auxin formulation
                                                              and spray additives
                                                              Sarah Striegel1 , Maxwel C. Oliveira2 , Nicholas Arneson3 , Shawn P. Conley4 ,
        Research Article
                                                              David E. Stoltenberg4                and Rodrigo Werle5
        Cite this article: Striegel S, Oliveira MC,
        Arneson N, Conley SP, Stoltenberg DE, Werle R         1
                                                               Graduate Student, Department of Agronomy, University of Wisconsin-Madison, Madison, WI, USA; 2Postdoctoral
        (2020) Spray solution pH and soybean injury as
        influenced by synthetic auxin formulation and         Researcher, Department of Agronomy, University of Wisconsin-Madison, Madison, WI, USA; 3Research Associate,
        spray additives. Weed Technol. doi: 10.1017/          Department of Agronomy, University of Wisconsin-Madison, Madison, WI, USA; 4Professor, Department of
        wet.2020.89                                           Agronomy, University of Wisconsin-Madison, Madison, WI, USA and 5Assistant Professor, Department of
                                                              Agronomy, University of Wisconsin-Madison, Madison, WI, USA
        Received: 31 May 2020
        Revised: 21 July 2020
        Accepted: 28 July 2020
                                                                  Abstract
                                                                  Use of synthetic auxin herbicides has increased across the midwestern United States after adop-
        Associate Editor:                                         tion of synthetic auxin-resistant soybean traits, in addition to extensive use of these herbicides
        William Johnson, Purdue University
                                                                  in corn. Off-target movement of synthetic auxin herbicides such as dicamba can lead to severe
        Nomenclature:                                             injury to sensitive plants nearby. Previous research has documented effects of glyphosate on
        2,4-D; dicamba; glyphosate; corn; Zea mays L.;            spray-solution pH and volatility of several dicamba formulations, but our understanding of
        soybean; Glycine max L. Merr.                             the relationships between glyphosate and dicamba formulations commonly used in corn
        Keywords:                                                 and for 2,4-D remains limited. The objectives of this research were to (1) investigate the roles
        Off-target movement; spray additives; spray               of synthetic auxin herbicide formulation, glyphosate, and spray additives on spray solution pH;
        solution; synthetic auxins; vapor drift                   (2) assess the impact of synthetic auxin herbicide rate on solution pH; and (3) assess the influ-
                                                                  ence of glyphosate and application time of year on dicamba and 2,4-D volatility using soybean
        Author for correspondence:
        Rodrigo Werle, Department of Agronomy,
                                                                  as bioindicators in low-tunnel field volatility experiments. Addition of glyphosate to a synthetic
        University of Wisconsin-Madison, 1575 Linden              auxin herbicide decreased solution pH below 5.0 for four of the seven herbicides tested (range of
        Drive, Madison, WI 53705.                                 initial pH of water source, 7.45–7.70). Solution pH of most treatments was lower at a higher
        (Email: rwerle@wisc.edu)                                  application rate (4× the labeled POST rate) than the 1× rate. Among all treatment factors, inclu-
                                                                  sion of glyphosate was the most important affecting spray solution pH; however, the addition of
                                                                  glyphosate did not influence area under the injury over distance stairs (P = 0.366) in low-tunnel
                                                                  field volatility experiments. Greater soybean injury in field experiments was associated with
                                                                  high air temperatures (maximum, >29 C) and low wind speeds (mean, 0.3–1.5 m s−1) during
                                                                  the 48 h after treatment application. The two dicamba formulations (diglycolamine with
                                                                  VaporGrip® and sodium salts) resulted in similar levels of soybean injury for applications that
                                                                  occurred later in the growing season. Greater soybean injury was observed after dicamba than
                                                                  after 2,4-D treatments.

                                                              Introduction
                                                              Corn and soybean are important components of annual cropping systems throughout much of
                                                              the United States, accounting for 36.3 and 30.8 million ha planted in 2019 (USDA-NASS 2019),
                                                              approximately 90% and 94% were herbicide-resistant (HR) hybrids and cultivars, respectively
                                                              (USDA-ERC 2019). After registration of 2,4-D in the 1940s and dicamba in the 1960s (Busi et al.
                                                              2018; EPA 2014, 2019), synthetic auxin herbicides have been commonly used for selective
                                                              broadleaf weed control in grass crops such as corn, small grains, pasture, and turf. Synthetic
                                                              auxins represent the third most used herbicide site of action (SOA) globally, accounting for
                                                              366 million treated ha (Busi et al. 2018). Approximately 15.8 million corn ha were treated with
                                                              synthetic auxin herbicides in the United States in 2018 (USDA-NASS 2019). Despite the inten-
                                                              sive use of synthetic auxins, resistance has been slow to evolve compared with other herbicide
                                                              sites of action (Busi et al. 2018). Recently commercialized soybean cultivars with stacked resis-
                                                              tance to synthetic auxin herbicides confer resistance to either glyphosate and dicamba
                                                              (Roundup Ready 2 Xtend®; Bayer Crop Science, St. Louis, MO) or glyphosate, glufosinate,
        © The Author(s), 2020. Published by Cambridge         and 2,4-D (Enlist E3™; Corteva Agriscience, Wilmington, DE). Adoption of these novel tech-
        University Press on behalf of Weed Science            nologies provide US soybean growers additional options to manage weed populations that have
        Society of America.                                   evolved resistance to glyphosate and other herbicides (Behrens et al. 2007).
                                                                  As of 2019, four dicamba products with reduced volatility were registered for use in dicamba-
                                                              resistant (DR) soybean: XtendiMax® with VaporGrip® technology (Bayer Crop Science),
                                                              FeXapan® with VaporGrip® technology (Corteva Agriscience), Tavium® with VaporGrip® tech-
                                                              nology (premix with S-metolachlor; Syngenta, Greensboro, North Carolina), and Engenia®
                                                              (BASF, Research Triangle Park, NC) (EPA 2019). XtendiMax®, FeXapan®, and Tavium® are

Downloaded from https://www.cambridge.org/core. IP address: 134.215.147.19, on 28 Sep 2020 at 13:52:02, subject to the Cambridge Core terms of use, available at
https://www.cambridge.org/core/terms. https://doi.org/10.1017/wet.2020.89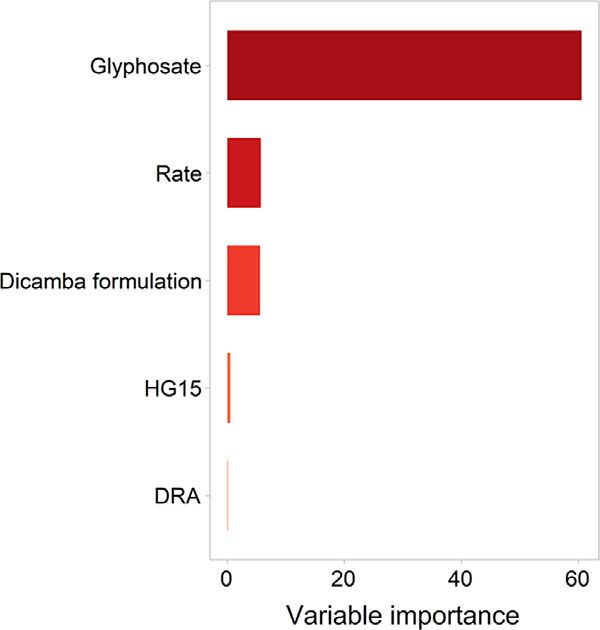
2                                                                                                                       Striegel et al.: Auxin solution pH and injury

        formulated as the diglycolamine (DGA) salt with an included acetic                         reduction agent [DRA], adjuvant) to broaden the spectrum of
        acid–acetate buffering system, VaporGrip® (hereafter, DGAþVG),                             weed control and improve performance (Anonymous 2019b;
        which reduces changes in spray-solution pH by scavenging available                         Anonymous 2019a; Roskamp et al. 2013; Spaunhorst et al.
        protons (Abraham 2018; MacInnes 2016). The Engenia® formu-                                 2014). Glyphosate is a common tank-mix partner used to broaden
        lation contains a novel dicamba salt, N,N-Bis-(3-aminopropyl)                              the spectrum of weed control (e.g., grass species) (Underwood et al.
        methylamine (BAPMA), which is reported to have reduced volatility                          2017). Glyphosate is a weak acid (Shaner et al. 2014) that is formu-
        (Westberg and Adams 2017). The 2,4-D salt formulation with                                 lated as various salts (e.g., isopropylamine, potassium) with low
        reduced volatility was approved for use in EnlistTM crops (including                       formulation pH. Excess protons present in solution at lower pH
        Enlist E3™ soybean) in 2019: Enlist One® with Colex-D® technology                          levels increase the potential for volatility of dicamba acid once dis-
        (Corteva Agriscience) and Enlist Duo® with Colex-D® technology                             sociated from the salt (Abraham 2018; Zollinger 2018). Recent
        (premix with dimethylammonium salt of glyphosate; Corteva                                  work from Mueller and Steckel (2019b) reported inclusion of
        Agriscience) (Simpson 2019). Although POST applications of                                 glyphosate with either DGA, DGAþVG or BAPMA decreased
        dicamba and 2,4-D in corn typically occur early in the growing sea-                        spray-solution pH; final solution pH depended on the initial pH
        son for much of the U.S. Midwest (i.e., before V5 growth stage)                            of the water source. Mueller and Steckel (2019a) further evaluated
        (Anonymous 2010), products approved for use in DR and Enlist                               DGAþVG in a humidome study and reported the addition of
        E3TM soybean permit applications until R1 or through 45 d after                            glyphosate increased detectable dicamba air concentrations 2.9
        planting, whichever occurs first (with exception of Tavium®, which                         to 9.3 times across a series of temperatures. Bish et al. (2019) con-
        is approved for use through V4) and through R2, respectively.                              firmed these results in a field setting, reporting lower detectable
        Additional label restrictions to mitigate potential for off-target                         dicamba concentrations in air when DGAþVG was applied with-
        movement (OTM) to nontarget vegetation (i.e., weather conditions,                          out glyphosate.
        nozzle selection, buffer requirements, time-of-day constraints, and                             Dicamba product labels for use in DR crops recommend avoid-
        language prohibiting applications when susceptible crops are down-                         ing low-pH spray mixtures (e.g., pH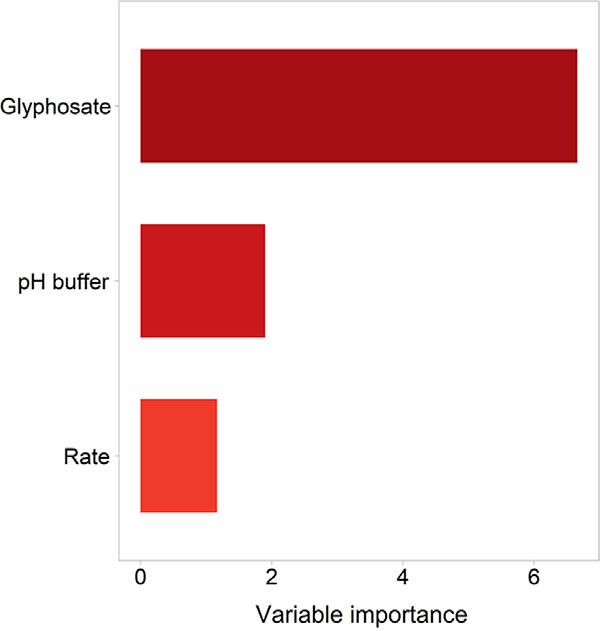
Weed Technology 3
Table 1. Product information for treatments included in the laboratory and low-tunnel field volatility experiments conducted in Wisconsin during 2019 to evaluate the
influence of synthetic auxin formulation and additives on spray-solution pH and soybean injury.
Abbreviation used
Producta in text Rate (4× and 1×) Trade name Company Experiment
−1
g ae/ai ha , other
DGA salt of dicamba with VaporGrip® (acetic DGAþVG 2,244 and 561 Xtendimax with VaporGrip Bayer Crop Scienceb LE1, LE2, FE
acid–acetate buffer) technology
N,N-Bis-(3-aminopropyl) methylamine salt of BAPMA 2,244 and 561 Engenia BASFc LE1
dicamba
DGA salt of dicamba DGA 2,244 and 561 Clarity BASF LE3
DGA salt of dicamba þ CYP (safener) DGAþCYP 2,244 and 561 DiFlexx Bayer Crop Science LE3
Sodium salt of dicamba þ sodium salt NAþDIF 1,402 and 351 Status BASF LE3, FE
of DIF þ isoxadifen(safener)
DGA salt of dicamba þ CYP (safener) þ TMB DGAþTMB 2,075 and 519 (DGA); DiFlexx DUO Bayer Crop Science LE3
303 and 76 (TMB)
2,4-D choline salt 2,4-D 3,197 and 799 Enlist One with Colex-D Corteva Agriscienced LE4, FE
technology
2,4-D choline salt þ dimethylammonium 2,4-DþGLY 3,141 and 785 (2,4-D); Enlist DUO with Colex-D Corteva Agriscience LE4, FE
salt of GLY 3,337 and 834 (GLY) technology
Potassium salt of GLY GLY-K 4,487 and 1,122 Roundup Powermax II Bayer Crop Science LE1, LE2, LE3,
LE4, FE
DMA salt of GLY GLY-DMA 4,487 and 1,122 Durango DMA Corteva Agriscience LE1, LE3, LE4
Clethodim DIM 421 and 105 Select Max with Inside Valente LE1, LE4
Technology
Acetochlor ACE 6,731 and 1,683 Warrant Bayer Crop Science LE1
Pyroxasulfone PYR 489 and 122 Zidua SC BASF LE1
Ammonium sulfate (21 N, 0 P, 0 K, 24 S) AMS 584 and 146 g L−1 S-Sul American Plant Food LE3, LE4
Corp.f
Adjuvant MON 51817 4.0% and 1.0% vol/vol MON 51817 Bayer Crop Science LE2
Drift reduction agent DRA 2.0% and 0.5% vol/vol Intact Precision Laboratoriesg LE1, LE2
a
Abbreviations: 2,4-D, 2,4-dichlorophenoxyacetic acid; CYP, cyprosulfamide; DGA, diglycolamine; DIF, diflufenzopyr; DMA, dimethylamine; FE, field experiment; GLY, glyphosate; LE, laboratory
experiment; TMB, tembotrione.
b
St. Louis, MO.
c
Research Triangle Park, NC.
d
Wilmington, DE.
e
Walnut Creek, CA
f
Galena Park, TX.
g
Waukegan, IL.
Materials and Methods measurements were within the lowest and highest standards; mea-
surements were completed at an air temperature of 21 C. Products
Four laboratory experiments were conducted to evaluate the
and rates used in experiments are listed in Table 1. Treatments
impact of various spray components and additives in combination
were included at 1× and 4× labeled POST rates. The 4× POST rate
with six commercial formulations of dicamba and 2,4-D on spray-
has been used previously in low-tunnel dicamba field volatility
solution pH. Laboratory experiments were conducted from
experiments (Bernards et al. 2020; Osterholt and Young 2019).
January through August 2019. Select treatments from these labo-
Four experiments were conducted and are described in the follow-
ratory experiments were then evaluated in a replicated low-tunnel
ing paragraphs. Treatments were replicated three times, and each
field volatility experiment in 2019 to evaluate soybean injury in
experiment was repeated in time (two experimental runs).
response to spray-mixture treatment and application time of
Additional components were also tested alone in solution at the
the year.
simulated 140 L ha−1 carrier volume to evaluate their individual
impact on solution pH (Table 2).
Laboratory Experiments
Experiments were conducted under laboratory conditions at Experiment 1: DR-Soybean Dicamba Products þ Spray
the University of Wisconsin-Madison, WI. Herbicide spray solu- Components
tions were prepared by mixing tap water in a plastic container This experiment determined the effect of two DR-soybean
(26–53 cm3) with additional components according to the label dicamba formulations, mix components, and spray additives on
recommendations to a total volume of 100 mL, simulating a spray-solution pH, totaling 32 treatments (including the 1× and
140 L ha−1 carrier volume rate. Treatment solution was thoroughly 4× rates) in a completely randomized design (CRD). The two
agitated before pH measurement. The solution pH was measured dicamba formulations were DGAþVG and BAPMA salts. A com-
using an Oakton pHTestr® 50 Waterproof Pocket pH Tester ponent for grass control was included at four levels: no addition,
Premium 50 Series probe (Oakton Instruments, Vernon Hills, potassium salt of glyphosate (GLY-K), dimethylamine salt of
IL). Between measurements, the electrode was rinsed with distilled glyphosate (GLY-DMA), and clethodim (DIM). A DRA was
water and gently wiped clean of any debris and remaining solution. included with DGAþVG and BAPMA solutions at two levels of
The pH meter was calibrated daily before use. The National the grass control component: GLY-K and DIM. The effect of a
Institute of Standards and Technology (Gaithersburg, MD) residual component was also determined by including two
buffer standards of 4.01, 7.00, and 10.01 were used. Most pH Group 15 residual herbicides (HG15) based on company
Downloaded from https://www.cambridge.org/core. IP address: 134.215.147.19, on 28 Sep 2020 at 13:52:02, subject to the Cambridge Core terms of use, available at
https://www.cambridge.org/core/terms. https://doi.org/10.1017/wet.2020.89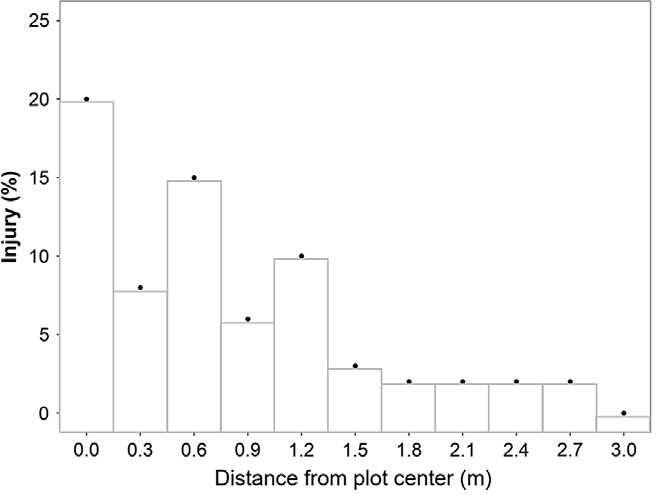
4                                                                                                                                   Striegel et al.: Auxin solution pH and injury

        Table 2. Mean solution pH and 95% CIs for herbicides and additional spray additives in the absence of dicamba and 2,4-D in laboratory experiments.a

                                                                    pH at 1× rate                                                                             pH at 4× rate
        Componentb                      Mean pH                                       95% CI                                      Mean pH                                       95% CI
                                                                     lower limit                   upper limit                                                 lower limit                   upper limit
        AMS                                7.23                         7.19                          7.27                           7.12                         7.09                          7.14
        GLY-DMA                            5.01                         5.00                          5.03                           4.74                         4.73                          4.76
        GLY-K                              4.91                         4.89                          4.93                           4.66                         4.64                          4.67
        DIM                                6.84                         6.80                          6.89                           6.92                         6.86                          6.97
        DRA                                7.34                         7.30                          7.38                           7.24                         7.22                          7.27
        ACE                                7.52                         7.50                          7.55                           7.75                         7.74                          7.76
        PYR                                7.51                         7.50                          7.52                           7.48                         7.48                          7.49
        TMB                                6.89                         6.86                          6.92                           6.24                         6.19                          6.29
        a
         Average pH of water source used was 7.54.
        b
         Abbreviations: 2,4-D, 2,4-dicholrophenoxyacetic acid; ACE, acetochlor; AMS, ammonium sulfate (21 N; 0 P; 0 K; 24 S); CI, confidence interval; DIM, clethodim; DRA, drift reduction agent; GLY-DMA,
        dimethylamine salt of glyphosate; GLY-K, potassium salt of glyphosate; PYR, pyroxasulfone; TMB, tembotrione.

        portfolios: acetochlor (ACE; Warrant®; Bayer Crop Science) was                                      AMS (for treatments with AMS addition). The pH values for all
        included with DGAþVG plus GLY-K or DIM plus DRA and                                                 experimental units were measured as previously described.
        pyroxasulfone (PYR; Zidua®; BASF) was included with BAPMA
        plus GLY-K or DIM plus DRA. The pH values for all experimental
        units were measured as described earlier under Laboratory                                           Low-Tunnel Field Volatility Experiment
        Experiments.                                                                                        A low-tunnel field experiment was conducted in 2019 at the
                                                                                                            University of Wisconsin-Madison Arlington Agricultural
        Experiment 2: pH Buffer                                                                             Research Station near Arlington, WI (43°18 0 N, 89°20 0 W and
        This experiment determined the role of a pH buffer additive and                                     43°18 0 N, 89°19 0 W), to determine the effect of application time
        consisted of eight treatments (including the 1× and 4× rates) in a                                  of year, active ingredient, formulation, and addition of glyphosate
        CRD. Treatments included DGAþVG in combination with a DRA                                           to the spray solution on volatility via subsequent assessments of
        at two levels of glyphosate, including no addition and GLY-K. The                                   dicamba or 2,4-D injury on susceptible soybean. This methodology
        final component included no addition or addition of a pH buffer                                     commonly has been used by academics and industry (e.g., Bayer
        (MON 51817). MON 51817 is currently listed as an approved adju-                                     Crop Science) to study dicamba volatility (Bernards et al. 2020;
        vant for use with DGAþVG (Anonymous 2019a) and reduced soy-                                         Browne et al. 2020; Langemeier et al. 2020; Latorre et al. 2017;
        bean injury from dicamba volatility in previous low-tunnel field                                    Long 2017; Norsworthy and Barber 2019; Oseland et al. 2018;
        volatility experiments (Oakley et al. 2020; Werle et al. 2019).                                     Oseland et al. 2020; Osterholt and Young 2019; Rice and
        The pH values for all experimental units were measured as previ-                                    Billman 2019; Young et al. 2017; Zaccaro et al. 2019). Similar meth-
        ously described.                                                                                    odology has also been used to quantify clomazone volatility and
                                                                                                            sorghum injury (Schreiber et al. 2016).
        Experiment 3: Corn Dicamba Products þ Spray Components þ                                                The experiment consisted of 14 treatments, replicated three
        AMS                                                                                                 times and organized in a randomized complete block design.
        This experiment determined the effect of several dicamba formu-                                     Treatments were composed of two main factors: herbicide treat-
        lations and additional components commonly used in corn pro-                                        ment and application time of year as main factors, resulting in a
        duction systems on solution pH, totaling 48 treatments                                              7 × 2 factorial, respectively. The experiment consisted of six her-
        (including the 1× and 4× rates) in a CRD. The four dicamba for-                                     bicide treatments (three synthetic auxin herbicides × two levels of
        mulations were DGA, DGAþCYP, DGAþTMB, and NAþDIF.                                                   glyphosate) and one nontreated control (NTC): (1) DGAþVG, (2)
        Glyphosate was the second component and was included at three                                       DGAþVG plus GLY-K, (3) NAþDIF, (4) NAþDIF plus GLY-K,
        levels: no addition, GLY-K, and GLY-DMA. The final component                                        (5) 2,4-D, (6) 2,4-DþGLY, and (7) NTC. Commercial formula-
        used was spray-grade AMS. The first component added to the                                          tions and the 4× rate for these herbicides are listed in Table 1.
        treatment solution was AMS (for treatments with AMS addition).                                      Application time of year was included at two levels: early (mid
        The pH values for all experimental units were measured as previ-                                    to late June) and late (early to mid July) in the season. Planting
        ously described.                                                                                    dates were staggered so applications would occur at the V3 to
                                                                                                            V5 soybean growth stage, regardless of application time of year.
        Experiment 4: 2,4-D þ Spray Components                                                              The experiment was repeated in space (i.e., in separate, adjacent
        This experiment determined the effect of the new 2,4-D products                                     fields).
        and additional components approved for use in corn and 2,4-D–                                           A glyphosate-resistant soybean cultivar, DSR-1950 R2Y
        resistant soybean, corn, and cotton systems (EnlistTM crops) on                                     (Dairyland Seed Co., Inc., West Bend, WI) was planted at
        spray-solution pH and consisted of 20 treatments (including the                                     296,400 seeds ha−1 in rows spaced 76 cm apart on May 5 (early
        1× and 4× rates) in a CRD. The 2,4-D choline salt (2,4-D) and                                       application time) and May 31 (late application time) in experiment
        2,4-D choline salt premixed with dimethylammonium salt of                                           1, and on May 7 (early application time) and June 4 (late applica-
        glyphosate (2,4-DþGLY) were evaluated. A component for grass                                        tion time) in experiment 2. Only the center two rows of each
        control was included at four levels: no addition, GLY-K, GLY-                                       4-row-wide plot were planted, allowing extra space between plots
        DMA, and DIM. The final treatment component used was                                                for ease of access and low-tunnel assembly and placement. Field
        AMS. The first component added to the treatment solution was                                        plot size was 1.5 m by 15 m. Plots were maintained weed free

Downloaded from https://www.cambridge.org/core. IP address: 134.215.147.19, on 28 Sep 2020 at 13:52:02, subject to the Cambridge Core terms of use, available at
https://www.cambridge.org/core/terms. https://doi.org/10.1017/wet.2020.89
Weed Technology 5
all individuals, with exception of the applicator, changed personal
protective equipment between treatments.
Early and late treatment timings were June 21 and July 7, 2019,
respectively, for experiment 1, and June 26 and July 16, 2019,
respectively, for experiment 2. For all treatment timings, soybeans
were at V3 to V5 growth stage as previously described. All
treatments were applied between 6:30 AM and 9:30 AM. Soil-flat
location was demarcated with a stake upon flat removal 48 h after
soil-flat placement. Tunnels were removed immediately after soil-
flat removal. Tunnel removal on June 23 was delayed 5 h because of
weather conditions (rain storm) following the June 21 application
(early application time, experiment 1). Weather data were collected
using WatchDog 2700 weather station (Spectrum Technologies,
Aurora, IL) equipped with internal sensors collecting air temper-
ature, relative humidity, wind speed and direction, and rainfall.
The station was also equipped with external sensors collecting
soil-flat temperature and air temperature 15 cm above soil flats
inside one of the low tunnels. Data were collected at 15-min inter-
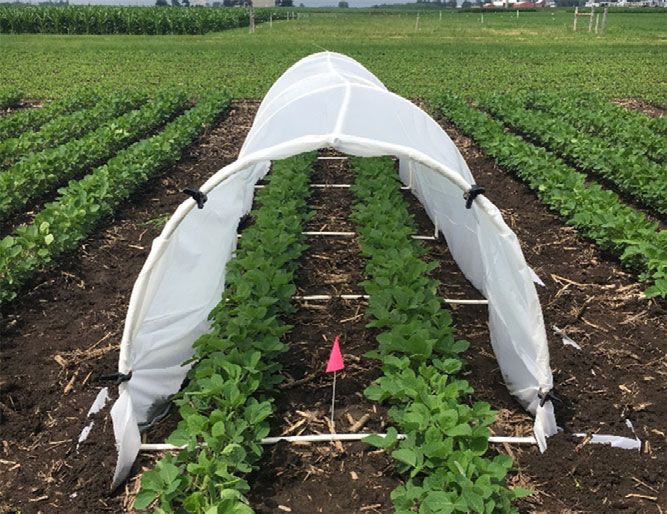
Figure 1. A low-tunnel before treatment application and flat placement in 2019 at
University of Wisconsin-Madison Arlington Agricultural Research Station, Arlington, WI.
vals for the 0 to 24 and 24 to 48 h periods after flat placement for
each of the applications (Table 3).
Soybean injury was assessed visually on a scale from 0 to 100
throughout the season via mechanical and chemical control mea- (Andersen et al. 2004; Behrens and Lueschen 1979) 28 d after treat-
sures; acetochlor (1,262 g ai ha−1) þ metribuzin (555 g ai ha−1) ment (DAT; when injury was most apparent), where 0 represents
were applied PRE to the entire experiment area on the early plant- no injury and 100 represents dead plants, similar to previous work
ing date for each experiment, followed by (fb) glyphosate (1,060 (Egan and Mortensen 2012; Jones et al. 2019b; Oseland et al. 2020).
g ae ha−1) þ S-metolachlor (1,607 g ai ha−1) þ AMS (579 g ha−1) Soybean injury included leaf crinkling, malformation, and cupping
applied early POST on June 11 to the entire experiment area. of trifoliates that had formed after exposure to treated flats.
Low tunnels were constructed using a framework of polyvinyl Soybean were at the R2 to R4 growth stage at the time of data col-
chloride (PVC) pipe (1.25 cm diam) consisting of five arches, lection. The center of the demarcated flat location was designated
1.5-m wide by 2.47-m long, and connected by four 1.5-m long as distance zero; the plot was then split into four quadrants by con-
PVC pipes between arches parallel with the plot; the tunnel was sidering each row separately in either direction from distance zero.
6.1 m long when fully assembled (Latorre et al. 2017; Long 2017). The quadrant with the most severe and extensive injury was
The framework was oriented such that the peak of the arch was cen- selected for data collection; this quadrant therefore represents
tered between the two rows of soybean and the tunnel was parallel to the experimental unit in this experiment. Data were collected on
the soybean rows in each 15-m long plot. Corners and center arches soybean plants at distance zero and in 30-cm increments for a total
were staked to the ground to secure the position of the tunnel. Clear of 3 m evaluated within each low tunnel (a total of 11 plants were
plastic sheeting (6-mL thick) was secured to the PVC framework evaluated within each experimental unit).
using spring clamps and plastic cable ties. Excess sheeting parallel Visual injury is a commonly used method to quantify soybean
to the framework was covered with soil and, to allow air movement, injury from volatility (Behrens and Lueschen 1979; Egan and
tunnel entrances were not covered. Tunnels were established the day Mortensen 2012; Oseland et al. 2020; Sciumbato et al. 2004a;
before application and oriented north-south according to soybean Sciumbato et al. 2004b; Soltani et al. 2020). The two meta-analyses
row orientation and the predominant wind direction at the field on dicamba volatility focused on visual injury and soybean yield
experiment location (Figure 1). (Egan et al. 2014; Kniss 2018). Sall et al. (2020) recently reported
Treatments were applied using a CO2-pressurized backpack that no impact on plant height or soybean yield was detected after
sprayer equipped with a 2.0-m wide, hand-held spray boom exposure to dicamba volatility in 23 field studies. The low-tunnel
with TTI 110015 nozzles (TeeJet Technologies, Spraying methodology used in the current study is a valuable tool to com-
Systems Co., Wheaton, IL) on 50.8-cm spacing calibrated to deliver pare the effect of dicamba volatility on soybean.
140 L ha−1 carrier volume at 262 kPa and a walking speed of
4.8 km h−1. Each treatment was applied at an offsite location to Statistical Analysis
six 60- × 30-cm flats filled with soil from the field experiment loca-
tion (Plano-silt loam; pH, 6.6; 3.5% organic matter; silt loam: 10% All analyses were completed with R statistical software, version
sand, 64% silt, 26% clay). Soil in the flats was free of vegetation and 4.0.0 (R Foundation for Statistical Computing, Vienna, Austria).
watered to field capacity the day before treatments were applied.
Three teams of at least two individuals handled distinct tasks for Laboratory Experiments: ANOVA
application and placement. Team 1 treated the soil flats, team For each experiment, a linear mixed model with a normal distri-
2 transported soil flats to the field immediately after treatments bution (“lme4” package) was fit to pH data as a two-way factorial
were applied, and team 3 placed two soil flats in each low tunnel. with treatment and rate as fixed effects and replications nested
Soil flats were placed with the 60-cm edge parallel to and centered within experimental runs as random effects. Model assumptions
between the two soybean rows in the middle of each respective low were evaluated using the Pearson chi-square test for normality
tunnel by the placement team. The flat-placement protocol was (“nortest” package) and the Levene test for homogeneity of vari-
designed to prevent contact of soil flats and personal protective ance (“car” package). A two-way ANOVA (“car” package) was per-
equipment with low tunnels and soybean vegetation. Moreover, formed and means were separated using Tukey honest significant
Downloaded from https://www.cambridge.org/core. IP address: 134.215.147.19, on 28 Sep 2020 at 13:52:02, subject to the Cambridge Core terms of use, available at
https://www.cambridge.org/core/terms. https://doi.org/10.1017/wet.2020.896 Striegel et al.: Auxin solution pH and injury
Table 3. Weather data summary for the 48 h after treatment applications in the low-tunnel volatility experiment conducted in 2019.a
Air temperature
Dateb Periodc Soil-flat temperatured 15 cmde 1 mde Relative humidityd Wind speedd Rainfall
−1
HAA ———————————— C ——————————————— % ms mm
21-Jun 0–24 19.6 (11.1–30.0) 19.1 (11.3–29.0) 17.4 (11.7–23.4) 59.5 (45.9–75.0) 1.6 (0.0–3.1) 0
21-Jun 24–48 23.7 (16.4–33.2) 22.3 (16.5–29.4) 20.4 (16.4–24.7) 64.2 (50.5–82.2) 2.8 (0.4–5.4) 0
26-Jun 0–24 23.7 (16.2–32.4) 22.6 (14.8–30.6) 21.9 (15.0–29.1) 69.9 (41.0–97.2) 0.3 (0.0–1.3) 1.3
26-Jun 24–48 24.0 (17.8–36.0) 23.1 (17.3–32.7) 21.8 (17.1–30.5) 82.3 (54.3–97.2) 1.5 (0.0–4.0) 23.9
9-Jul 0–24 25.6 (21.7–31.7) 25.4 (21.3–31.5) 24.3 (21.1–29.2) 78.1 (56.3–96.5) 1.8 (0.0–4.0) 2.5
9-Jul 24–48 28.5 (18.9–39.6) 24.8 (17.5–33.6) 23.7 (17.2–30.5) 72.1 (42.8–94.6) 1.8 (0.0–5.4) 0
16-Jul 0–24 26.1 (19.8–34.0) 26.0 (20.1–33.2)f 25.1 (19.5–31.8) 76.0 (53.3–93.9) 0.7 (0.0–2.2) 2.8
16-Jul 24–48 26.2 (20.4–37.2) 26.1 (20.6–26.1)f 25.1 (20.1–31.1) 81.6 (59.4–96.4) 0.9 (0.0–3.6) 56.4
a
Weather parameters are summarized as mean(minimum-maximum) values for the corresponding date and period following application.
b
Dates presented represent combinations of experiment (1 or 2) and time (early or late) conducted over time.
c
Abbreviation: HAA: hours after application.
d
Denoted parameters were collected using external sensors and were located within one of the low tunnels for each application timing and experimental run.
e
Distance recorded above soil surface.
f
Air temperature 15 cm above soil surface not recorded due to sensor error. Values are estimated using the following formula derived from weather data collected over three experiments:
y = 0.73010x þ 0.30327y – 1.44638, using values for air temperature at 1 m and soil-flat temperature values as x and y, respectively (both predictors were significant in the model, adjusted
R2= 0.949).
difference (“emmeans” package) when P < 0.05 for the interaction
or main effects.
Laboratory Experiments: Random Forest
Because the laboratory experiments were not all designed as com-
plete factorials, main effects could not be tested by multifactor
ANOVA; thus, random forest analyses (“tidymodels” package)
(Kuhn and Wickham 2020) were performed to determine the effects
of tank-mix partners on pH change of treatment solutions. Random
forest is a machine-learning algorithm that generates multiple deci-
sion trees using a subsample of bootstrapped observations from ran-
domly selected explanatory variables (Breiman 2001). Random
forest is a useful tool for variable selection in large and complex data
sets for quantitative, discrete, and qualitative variables and has been
used for response variables such as Amaranthus spp. resistance
(Vieira et al. 2018), weed biomass in cover crops (Baraibar et al.
2018), soybean yield (Smidt et al. 2016), soybean injury from Figure 2. Soybean injury as a function of distance from plot center as determined by
area under injury over distance stairs (AUIDS) analysis in the low-tunnel field experi-
dicamba (Zhang et al. 2019), and Goss’s bacterial wilt and leaf blight ment in 2019. Values were calculated from the equation AUIDS = D × n (n − 1)−1, where
development (Langemeier et al. 2017). D is soybean injury rating and n is distance from plot center. The experimental unit
We conducted separate random forest analyses for each experi- shown received a late application in experiment 2 and had an AUIDS value of 70.
ment, with pH unit as the response (continuous) variable, and a
number of qualitative explanatory variables specifying assigned
levels of factors included in the treatment structure. For these zero indicate the variable is not important (Bourgoin et al. 2018;
analyses, trees (the number of decision trees) was set to 1000, Louppe et al. 2013). Variable importance plots were constructed
and mtry (the number of different predictors sampled at each split) in a way similar to that described by Langemeier et al. (2017).
and min_n (the minimum number of data points in a node
required for additional splits) were tuned during model training Low-Tunnel Field Volatility Experiments: Area Under the
and set according to the final model selection (Kuhn and Disease Progress Stairs
Wickham 2020). The best model was selected using the root mean Soybean injury data across distances within an experimental unit
square error (RMSE) criterion (Bourgoin et al. 2018), which is esti- collected 28 DAT were used to calculate an adaption of the absolute
mated as the square root of the average difference between the area under the disease-progress stairs (“agricolae” package),
observed and the predicted value squared for all observations referred to here as area under injury over distance stairs
(Zhou et al. 2019). Lower RMSE scores indicate better model per- (AUIDS) (Figure 2). This approach has been used commonly in
formance (Zhou et al. 2019). Variable importance (VI) scores were plant pathology to describe disease progression over time
determined by the impurity measure (“ranger” package), which (Shaner and Finney 1977; Simko and Piepho 2012) and has previ-
provides an estimate of the change in prediction accuracy should ously been adapted to describe soybean canopy development
the variable be excluded from the model (Wright 2020). Higher VI (Miller et al. 2018), desiccation progress (Zhang et al. 2016),
values indicate the variable is important in the model and in and dry-down rate in corn (Yang et al. 2010). Applying the concept
explaining variability of the response variable, whereas values near of area under the disease-progress stairs to our data set resulted in
Downloaded from https://www.cambridge.org/core. IP address: 134.215.147.19, on 28 Sep 2020 at 13:52:02, subject to the Cambridge Core terms of use, available at
https://www.cambridge.org/core/terms. https://doi.org/10.1017/wet.2020.89Weed Technology 7
Table 4. Mean solution pH and 95% CIs for laboratory experiment 1 as affected by dicamba formulation, GLY formulation, DIM, DRA, and Group 15 herbicide.
Treatment solution componentsa 1× Treatment rate 4× Treatment rate
Dicamba GLY formulation
formulation or DIM DRA Group 15 herbicide Mean pHbc 95% CI Mean pHbc 95% CI
yes/no lower limit upper limit lower limit upper limit
DGAþVG none No None 6.45 6.32 6.58 5.69 5.55 5.82
DGAþVG GLY-DMA No None 5.19 5.06 5.32 5.07 4.94 5.20
DGAþVG GLY-K No None 5.17 5.03 5.30 5.12 4.98 5.25
DGAþVG DIM No None 6.42 6.29 6.55 5.64 5.51 5.78
BAPMA none No None 6.68 6.55 6.82 6.59 6.45 6.72
BAPMA GLY-DMA No None 5.09 4.96 5.22 4.77 4.63 4.90
BAPMA GLY-K No None 4.96 4.83 5.10 4.74 4.60 4.87
BAPMA DIM No None 6.66 6.53 6.79 6.58 6.44 6.71
DGAþVG GLY-K Yes None 5.16 5.02 5.29 5.11 4.97 5.24
DGAþVG DIM Yes None 6.39 6.26 6.52 5.62 5.49 5.76
BAPMA GLY-K Yes None 4.94 4.81 5.07 4.74 4.61 4.88
BAPMA DIM Yes None 6.68 6.54 6.81 6.57 6.43 6.70
DGAþVG GLY-K Yes ACE 5.19 5.06 5.32 5.17 5.04 5.30
DGAþVG DIM Yes ACE 6.49 6.35 6.62 5.90 5.76 6.03
BAPMA GLY-K Yes PYR 4.96 4.83 5.09 4.74 4.61 4.87
BAPMA DIM Yes PYR 6.66 6.53 6.79 6.57 6.44 6.70
HSD 0.04
a
Abbreviations: ACE, acetochlor; BAPMA, N,N-Bis-(3-aminopropyl)methylamine salt of dicamba; CI, confidence interval; DGA, diglycolamine salt of dicamba; DIM, clethodim; DMA, dimethylamine
salt; DRA, drift reduction agent; GLY, glyphosate; GLY-K, potassium salt of glyphosate; HSD, honest significant difference; PYR, pyroxasulfone; VG, VaporGrip® (acetic acid-acetate buffer).
b
Means separation used was Tukey HSD at P < 0.05.
c
Average pH of water source used was 7.46.
one value per experimental unit representing symptom severity reported initial pH levels from several water sources in
and consistency of soybean injury over distance. The AUIDS val- Tennessee ranged from 4.53 to 8.35 and indicated the initial pH
ues for experimental units were standardized in reference to of the water source can affect final spray-solution pH.
respective NTC average value and represent the response variable
in the low-tunnel field volatility experiment. Experiment 1: DR Soybean Dicamba Products þ Spray
Components
Low-Tunnel Field Volatility Experiments: ANOVA
The treatment by rate interaction was significant for all laboratory
A linear mixed model with a normal distribution (“lme4” package)
experiments (P < 0.0001) (Tables 4–7); thus, treatment results are
was fit to AUIDS data as a 3 × 2 × 2 × 2 factorial with synthetic
presented by rate for each experiment. The pH of treatment solu-
auxin herbicide, glyphosate level, application time of year, and
tions ranged from 4.94 to 6.68 (Table 4).
experiment as fixed effects. Replications nested within experiments
were considered random effects. The NTC were not included in the
1× Treatment Rate
analysis. Model assumptions were evaluated as described for the
Treatments that included glyphosate were associated with the low-
laboratory experiments ANOVA. A square-root transformation
est solution pH values (Table 4). Inclusion of GLY-DMA was asso-
of the response variable satisfactorily met model assumptions of
ciated with a reduction of 1.26 and 1.59 pH units for DGAþVG
normality and homogeneity of variances. The ANOVA (four-
and BAPMA, respectively, compared with the dicamba formula-
way factorial) and means separations were completed as described
tions alone. Similar reductions were observed for GLY-K, corrobo-
for the laboratory experiments. Back-transformed means are pre-
rating the findings of Mueller and Steckel (2019b) for GLY-K and
sented for ease of interpretation.
GLY-IPA salts. The GLY-DMA and GLY-IPA salts are ammonia-
based formulations and are not approved mix partners for DR-
Results and Discussion soybean dicamba products (Anonymous 2019a). This label change
was due to 2017 reports of ammonia-based glyphosate formula-
Laboratory Experiments
tions increasing the potential for dicamba volatility (Latorre
pH of Water Source et al. 2017; Young et al. 2017; Zollinger 2018). Solution pH for
The pH of the water source used in these experiments ranged from the two dicamba salts plus glyphosate was lower for BAPMA than
7.45 to 7.70. This pH range indicates alkalinity and the presence of DGAþVG. This suggests that DGAþVG may maintain a higher
basic cations, such as calcium and magnesium, which constitute spray-solution pH than BAPMA when glyphosate is tank mixed
water hardness (Roskamp et al. 2013). Approximately 60% of using water sources with a high initial pH (7.46), and the finding
groundwater in the United States is classified as hard or very hard is supported by those of Mueller and Steckel (2019b) for deionized
(120–180 and >180 mg L−1 CaCO3, respectively), which is typical and low initial pH water sources.
for much of the U.S. Midwest (DeSimone et al. 2014). Furthermore, Treatments with DIM in replacement of a glyphosate formu-
82% of U.S. groundwater sources have a pH ranging from 6.5 to 8.0 lation had minimal effect on solution pH (0.02–0.03 unit change)
(DeSimone et al. 2014). Therefore, findings herein are relevant for compared with the dicamba formulation alone. Inclusion of a DRA in
most private and commercial pesticide applicators from across the solution with either BAPMA or DGAþVG with DIM had no influ-
U.S. Midwest and other regions using water sources with relatively ence on solution pH. Treatments with DGAþVG and BAPMA with
high pH for herbicide applications. Mueller and Steckel (2019b) or without GLY-K and a DRA at the 1× rate corroborate findings of
Downloaded from https://www.cambridge.org/core. IP address: 134.215.147.19, on 28 Sep 2020 at 13:52:02, subject to the Cambridge Core terms of use, available at
https://www.cambridge.org/core/terms. https://doi.org/10.1017/wet.2020.898 Striegel et al.: Auxin solution pH and injury
Table 5. Mean solution pH and 95% CIs for laboratory experiment 2 as affected by GLY-K and pH buffer addition.
Treatment solution componentsab 1× Treatment rate 4× Treatment rate
Dicamba formulation GLY formulation DRA pH buffer Mean pHc 95% CI Mean pHc 95% CI
yes/no lower limit upper limit lower limit upper limit
DGAþVG None Yes None 6.17 6.14 6.20 5.48 5.45 5.51
DGAþVG GLY-K Yes None 4.96 4.93 4.98 4.80 4.77 4.83
DGAþVG None Yes MON 51817 6.30 6.27 6.33 6.12 6.09 6.14
DGAþVG GLY-K Yes MON 51817 5.34 5.31 5.37 5.42 5.39 5.45
HSD 0.01
a
Abbreviations: DGA, diglycolamine salt of dicamba; CI, confidence interval; DRA, drift reduction agent; GLY, glyphosate; GLY-K, potassium salt of glyphosate; HSD, honest significant difference;
VG, VaporGrip® (acetic acid-acetate buffer).
b
Average pH of water source used was 7.70.
c
Means separation used was Tukey HSD at P < 0.05.
Table 6. Mean solution pH and 95% CIs for laboratory experiment 3 as affected by dicamba formulation, GLY formulation, and AMS.
Treatment solution componentsab 1× Treatment rate 4× Treatment rate
bc bc
Dicamba formulation GLY formulation AMS Mean pH 95% CI Mean pH 95% CI
yes/no lower limit upper limit lower limit upper limit
DGA None No 7.27 7.20 7.34 7.17 7.10 7.25
DGAþCYP None No 6.23 6.16 6.30 3.23 3.15 3.30
DGAþTMB None No 5.36 5.29 5.43 2.95 2.88 3.02
NAþDIF None No 7.62 7.54 7.69 7.79 7.72 7.87
DGA GLY-K No 4.93 4.86 5.00 4.64 4.57 4.71
DGAþCYP GLY-K No 4.75 4.68 4.82 4.41 4.33 4.49
DGAþTMB GLY-K No 4.51 4.44 4.58 4.19 4.12 4.26
NAþDIF GLY-K No 4.91 4.83 4.98 4.71 4.64 4.78
DGA GLY-DMA No 4.98 4.91 5.05 4.71 4.64 4.78
DGAþCYP GLY-DMA No 4.82 4.75 4.89 4.48 4.41 4.55
DGAþTMB GLY-DMA No 4.66 4.59 4.73 4.35 4.28 4.42
NAþDIF GLY-DMA No 4.97 4.90 5.04 4.80 4.73 4.87
DGA None Yes 7.24 7.17 7.31 7.16 7.09 7.24
DGAþCYP None Yes 6.32 6.25 6.39 3.62 3.55 3.69
DGAþTMB None Yes 5.31 5.24 5.38 3.27 3.19 3.34
NAþDIF None Yes 7.40 7.33 7.47 7.33 7.25 7.40
DGA GLY-K Yes 4.90 4.83 4.97 4.61 4.54 4.68
DGAþCYP GLY-K Yes 4.71 4.64 4.78 4.39 4.31 4.47
DGAþTMB GLY-K Yes 4.55 4.48 4.62 4.16 4.09 4.23
NAþDIF GLY-K Yes 4.89 4.82 4.96 4.60 4.53 4.67
DGA GLY-DMA Yes 4.96 4.89 5.03 4.71 4.64 4.78
DGAþCYP GLY-DMA Yes 4.82 4.75 4.89 4.53 4.46 4.61
DGAþTMB GLY-DMA Yes 4.64 4.57 4.72 4.34 4.27 4.41
NAþDIF GLY-DMA Yes 5.00 4.93 5.07 4.78 4.71 4.85
HSD 0.10
a
Abbreviations: AMS, ammonium sulfate (21 N, 0 P, 0 K, 24 S); DGA, diglycolamine salt of dicamba; CI, confidence interval; DGAþCYP, diglycolamine salt of dicamba with cyprosulfamide safener;
DGAþTMB, diglycolamine salt of dicamba with cyprosulfamide safener premixed with tembotrione; GLY, glyphosate; GLY-K, potassium salt of glyphosate; GLY-DMA, dimethylamine salt of
glyphosate; HSD, honest significant difference; NAþDIF, sodium salt of dicamba premixed with sodium salt of diflufenzopyr with isoxadifen safener.
b
Average pH of water source used was 7.45.
c
Means separation used was Tukey HSD at P < 0.05.
Mueller and Steckel (2019b). Treatments with a HG15 had little effect two glyphosate formulations within dicamba formulation type.
on solution pH, with exception of DGAþVG plus DIM and DRA, in Only BAPMA treatments with glyphosate had a solution pH
which a 0.10 increase in pH occurred for the ACE treatment. lower than 5.0. Treatments with DIM in replacement of a
Therefore, inclusion of a DRA or HG15 is not expected to have a glyphosate formulation had a minimal effect on solution pH,
major impact on spray-solution pH. although DGAþVG plus DIM was 0.05 units lower than that
of DGAþVG alone. Inclusion of DRA with DGAþVG or
BAPMA plus GLY-K or DIM did not affect solution pH.
4× Treatment Rate Treatments with a HG15 had a small increase in pH (ACE,
Treatments that included glyphosate were associated with the 0.06–0.28) or no effect (PYR).
lowest solution pH values. Reductions in pH of 0.57 and 0.62
were observed for DGAþVG when GLY-K and GLY-DMA were
included, respectively, compared with DGAþVG alone. 1× and 4× Treatment Rate Comparisons
Reductions of 1.85 and 1.82 were observed for BAPMA when Comparisons across rates indicated no differences for the treat-
GLY-K and GLY-DMA were included, respectively, compared ment DGAþVG with GLY-K, DRA, and ACE at the 1× and 4×
with BAPMA alone. Solution pH did not differ between the rates. For remaining treatments, solution pH was lower for
Downloaded from https://www.cambridge.org/core. IP address: 134.215.147.19, on 28 Sep 2020 at 13:52:02, subject to the Cambridge Core terms of use, available at
https://www.cambridge.org/core/terms. https://doi.org/10.1017/wet.2020.89Weed Technology 9
Table 7. Mean solution pH and 95% CIs for laboratory experiment 4 as affected by 2,4-D, GLY formulation, DIM, and AMS.
Treatment solution componentsab 1× Treatment rate 4×Treatment rate
2,4-D choline GLY formulation or DIM AMS Mean pHbc 95% CI Mean pHbc 95% CI
yes/no lower limit upper limit lower limit upper limit
2,4-D None No 6.94 6.84 7.03 6.59 6.50 6.69
2,4-D GLY-K No 4.97 4.88 5.07 4.97 4.87 5.07
2,4-D GLY-DMA No 5.01 4.92 5.11 4.93 4.83 5.03
2,4-D DIM No 6.55 6.45 6.65 6.49 6.40 6.59
2,4-DþGLY None No 5.82 5.72 5.91 5.70 5.60 5.79
2,4-D None Yes 7.06 6.96 7.15 6.75 6.66 6.85
2,4-D GLY-K Yes 5.01 4.91 5.11 5.04 4.94 5.14
2,4-D GLY-DMA Yes 5.07 4.97 5.17 5.07 4.97 5.17
2,4-D DIM Yes 6.73 6.64 6.83 6.13 6.03 6.23
2,4-DþGLY None Yes 5.79 5.69 5.89 5.67 5.58 5.77
HSD 0.06
a
Abbreviations: 2,4-D, 2,4-dichlorophenoxyacetic acid choline salt; 2,4-DþGLY, 2,4-D choline salt premixed with dimethylammonium salt of glyphosate; AMS, ammonium sulfate (21 N, 0 P, 0 K, 24
S); CI, confidence interval; DIM, clethodim; HSD, honest significant difference; GLY, glyphosate; GLY-DMA, dimethylamine salt of glyphosate; GLY-K, potassium salt of glyphosate.
b
Average pH of water source used was 7.56.
c
Means separation used was Tukey HSD at P < 0.05.
treatments at the 4× rate than the 1× rate. Solution pH was 0.76
units lower for DGAþVG alone and 0.09 units lower for
BAPMA alone at the 4× compared with the 1× rate. This finding
suggests the solution pH for DGAþVG was more affected when
included at a higher rate and could influence the interpretability
of low-tunnel dicamba volatility research (which is often con-
ducted at higher rates). Across dicamba formulations, solution
pH ranged from 0.12 to 0.32 units lower for GLY-K and 0.05 to
0.22 units lower for GLY-DMA, respectively, at the 4× compared
with the 1× rate.
Ranking Importance of Treatment Variables
Variability in the data set for solution pH was well explained by
inclusion of glyphosate, indicating that glyphosate was the most
important variable influencing pH (VI = 60.24) (Figure 3). Rate
(VI = 5.73) and dicamba formulation (VI = 5.49) were important,
whereas addition of a HG15 (VI = 0.52) or a DRA (VI = 0.12) had
minimal to no impact.
Experiment 2: pH Buffer
1× Treatment Rate
The pH of treatment solutions ranged from 4.96 to 6.30 (Table 5). Figure 3. Spray solution pH as influenced by dicamba formulations labeled for use in
Solution pH was 0.13 and 0.38 pH units higher for treatments with dicamba-resistant soybean, glyphosate, drift reduction agent (DRA), Group 15 herbi-
MON 51817 in the absence and presence of GLY-K, respectively, cide (HG15), and rate, ranked by variable importance, as determined from the random
compared to DGAþVG plus DRA alone. Similar to findings of forest analysis for laboratory experiment 1 (root mean square error, 0.15).
Muller and Steckel (2019b), inclusion of a pH buffer (MON
51817) increased solution pH to higher than 5.0. The only pH
buffer studied was MON 51817; therefore, conclusions of this
experiment cannot be extended to many other commercial prod-
ucts that may be used to adjust spray-solution pH. the 1× rate. For remaining treatments, solution pH was lower for
treatments at the 4× than the 1× rate. Solution pH was 0.18 and
4× Treatment Rate 0.69 units lower at the 4× rate for treatments without GLY-K,
The pH of treatment solutions ranged from 4.80 to 6.12. Solution with and without MON 51817, respectively, when compared with
pH was 0.64 and 0.62 pH units higher for treatments with MON the 1× rate. Solution pH was 0.16 units lower at the 4× rate for
51817 in the absence and presence of GLY-K, respectively, com- GLY-K without MON 51817 compared with the 1× rate.
pared with DGAþVG plus DRA alone. Solution pH was higher
than 5.0 for both treatments with MON 51817. Ranking Importance of Treatment Variables
Variability in the data set for solution pH was well explained by
1× and 4× Treatment Rate Comparisons inclusion of glyphosate, indicating that glyphosate was the most
Comparisons across rates indicated a higher solution pH (0.08 important variable influencing pH (VI = 6.73) (Figure 4), followed
units) for GLY-K plus MON 51817 at 4× when compared with a pH buffer (VI = 1.91) and rate (VI = 1.14).
Downloaded from https://www.cambridge.org/core. IP address: 134.215.147.19, on 28 Sep 2020 at 13:52:02, subject to the Cambridge Core terms of use, available at
https://www.cambridge.org/core/terms. https://doi.org/10.1017/wet.2020.8910 Striegel et al.: Auxin solution pH and injury
crops (Anonymous 2019a, 2019b), but such restrictions currently
do not apply to dicamba formulations used in corn. When added to
solution, AMS has a net neutral charge; as the ammonium disso-
ciates from sulfate, the anionic sulfate binds to cations present in
the solution (Roskamp et al. 2013). Ammonium is prone to vola-
tilization as ammonia, leaving excess Hþ that may lead to minor
acidification in solution (Abraham 2018; Mueller and Steckel
2019b). Ammonium rapidly adsorbs to leaf and soil surfaces,
reducing apoplastic pH and enhancing dissociation from salt
and formation of nonionized dicamba acid (Husted and
Schjoerring 1995; Ou et al. 2018; Zollinger 2018). The presence
of nonionized dicamba acid on the leaf surface increases the
potential for volatility, which can be further aggravated by high-
temperature conditions (Ou et al. 2018). Inclusion of AMS has
been reported to increase volatility of dicamba from plant and soil
surfaces (Hayden et al. 2019; Latorre et al. 2017).
4× Treatment Rate
The pH of treatment solutions ranged from 2.95 to 7.79. Among
dicamba formulations with no additional components,
DGAþTMB had the lowest solution pH, fb DGAþCYP and
Figure 4. Spray solution pH of diglycolamine salt of dicamba with Vaporgrip® mix- DGA, whereas NAþDIF had a higher solution pH than the initial
tures as influenced by glyphosate, pH buffer, and rate, ranked by variable importance pH of the water source. Solution pH was not influenced by inclu-
as determined from the random forest analysis for laboratory experiment 2 (root mean
sion of AMS for DGA, whereas solution pH was 0.39 and 0.32 units
square error, 0.04).
higher for DGAþCYP and DGAþTMB, respectively, and
NAþDIF was 0.46 units lower when compared with the respective
dicamba formulations with no additional components. Addition of
Experiment 3: Corn Dicamba Products þ Spray Components glyphosate to DGA and NAþDIF was associated with 2.53 to 3.08
þ AMS and 2.46 to 2.99 lower pH for GLY-K and GLY-DMA, respectively,
compared with respective dicamba formulations alone.
1× Treatment Rate
Conversely, addition of glyphosate to DGAþCYP and
The pH of treatment solutions ranged from 4.51 to 7.62 (Table 6).
DGAþTMB increased solution pH by 1.18 to 1.24 and 1.25 to
Among dicamba formulations with no additional components,
1.40 for GLY-K and GLY-DMA, respectively, compared with
DGAþTMB had the lowest solution pH, fb DGAþCYP and
respective dicamba formulations alone. All treatments with glyph-
DGA, whereas NAþDIF had a higher solution pH than the initial
osate had a solution pH lower than 5.0. Solution pH was higher for
pH of the water source. Solution pH was not influenced by inclu-
DGAþCYP, DGAþTMB, and NAþDIF (with AMS), and for
sion of AMS as a water conditioner for DGA, DGAþTMB, and
DGAþTMB (without AMS) with a GLY-DMA addition com-
DGAþCYP, whereas the pH of NAþDIF was 0.22 units lower
pared, with a GLY-K addition. For both glyphosate formulations,
compared with NAþDIF alone. Addition of glyphosate was asso-
DGA and NAþDIF had the highest solution pH levels, fb
ciated with 0.76 to 2.71 and 0.67 to 2.65 lower pH for GLY-K and
DGAþCYP and DGAþTMB. Inclusion of AMS in solution with
GLY-DMA, respectively, across dicamba formulations with no
dicamba and glyphosate had no impact on solution pH.
additional components. All treatments with glyphosate had a sol-
ution pH no higher than 5.0. Few differences in solution pH were
observed between the two glyphosate formulations within dicamba 1× and 4× Treatment Rate Comparisons
formulation type, although solution pH was greater for Solution pH for NAþDIF (with AMS) and DGA (with and without
DGAþTMB without AMS and GLY-DMA than a GLY-K addi- AMS) did not differ between the 1× and 4× treatment rates. The
tion. Across glyphosate formulation types, solution pH levels were NAþDIF without AMS treatment had a solution pH 0.17 units
greatest for DGA and NAþDIF, fb DGAþCYP and DGAþTMB. higher at the 4× rate than for the 1× rate. For remaining treat-
Results of treatments evaluating DGA with or without GLY-K cor- ments, solution pH was lower for treatments at the 4× rate.
roborated findings of Mueller and Steckel (2019b). Inclusion of Solution pH was 2.04 and 3.00 units lower at the 4× rate for
AMS in solution with dicamba and glyphosate had no impact DGAþCYP and DGAþTMB alone, respectively, when compared
on solution pH. Mueller and Steckel (2019b) reported a 0.7 pH– with the 1× rate. Across dicamba formulations, solution pH at the
unit decrease after AMS addition and no additional components 4× rate ranged from 0.20 to 0.39 units lower for GLY-K and 0.17 to
when using a water source with an initial pH of 6.2. The initial 0.34 units lower for GLY-DMA, respectively, when compared with
pH of a nontreated source water used in an additional experiment the 1× rate.
was 7.54 and decreased 0.31 units after a 1× AMS addition
(Table 2). Moreover, the minimal impact of AMS on solution Ranking Importance of Treatment Variables
pH for DGA, DGAþTMB, DGAþCYP, and NAþDIF reported Variability in the data set for solution pH was well explained by
herein corroborate findings of Mueller and Steckel (2019b) for dicamba formulation (VI = 146.82) and glyphosate (VI = 88.97),
DGAþVG and BAPMA formulations. indicating that both variables highly influenced pH (Figure 5),
Current labels do not permit inclusion of ammonia-based her- fb rate (VI = 53.4). Inclusion of AMS (VI = 1.07) was not impor-
bicides and AMS with dicamba products approved for use in DR tant in influencing pH level.
Downloaded from https://www.cambridge.org/core. IP address: 134.215.147.19, on 28 Sep 2020 at 13:52:02, subject to the Cambridge Core terms of use, available at
https://www.cambridge.org/core/terms. https://doi.org/10.1017/wet.2020.89Weed Technology 11
Figure 6. Spray solution pH of 2,4-D choline mixtures as influenced by glyphosate
Figure 5. Spray solution pH as influenced by dicamba formulations labeled for use in formulation, ammonium sulfate (AMS), and rate, ranked by variable importance as
corn, glyphosate formulation, ammonium sulfate (AMS), and rate, ranked by variable determined from the random forest analysis for laboratory experiment 4 (root mean
importance as determined from the random forest analysis for laboratory experiment square error, 0.31).
3 (root mean square error, 0.08).
2,4-DþGLY premix. The addition of AMS increased pH for 2,4-
Experiment 4: 2,4-D þ Spray Components D alone (0.16 units higher) and with glyphosate (0.07 to 0.14 units
higher) and decreased pH for 2,4-D plus DIM (0.36 units lower
1×Treatment Rate with AMS).
The pH of treatment solutions ranged from 4.97 to 7.06 (Table 7).
Solution pH was lowered 0.62 units with the addition of 2,4-D.
Inclusion of AMS increased solution pH by 0.12 units compared 1× and 4× Treatment Rate Comparisons
with 2,4-D alone. Treatments that included glyphosate had the Solution pH for 2,4-D plus DIM (without AMS), 2,4-D choline
lowest solution pH. Reductions in pH of 1.93 to 2.05 were observed plus GLY-K (with and without AMS), and 2,4-D choline plus
for 2,4-D with glyphosate, regardless of glyphosate salt, compared GLY-DMA (with AMS) treatments did not differ between the
with 2,4-D alone. Only 2,4-D choline plus GLY-K had a solution 1× and 4× rates. For remaining treatments, solution pH was lower
pH lower than 5.0. The premix 2,4-DþGLY formulation had a sol- for treatments included at the 4× rate than the 1× rate.
ution pH more than 0.81 units higher than that of 2,4-D plus GLY-
K or GLY-DMA treatments with no other additional components. Ranking Importance of Treatment Variables
The difference in pH between the mixed 2,4-D þ glyphosate and Variability in the data set for solution pH was well explained by
premix treatments could be attributed to the differences in glyph- inclusion of glyphosate, indicating glyphosate was the most impor-
osate concentration, which was lower for the premixed formu- tant variable influencing pH (VI = 43.45) (Figure 6), fb rate
lation than the mixed treatments. Treatments in which DIM (VI = 1.10). Inclusion of AMS (VI = 0.14) did not influence
replaced a glyphosate formulation had a solution pH 0.33 to pH level.
0.39 units lower than 2,4-D alone. Inclusion of AMS did not influ-
ence solution pH for most treatments, except for a small increase Low-Tunnel Field Volatility Experiment
(0.18 units) for 2,4-D plus DIM.
The response variable was calculated as a function of soybean
injury intensity over distance from the center of the plot (i.e.,
4× Treatment Rate AUIDS). The addition of glyphosate was not significant in any
The pH of treatment solutions ranged from 4.93 to 6.75. Solution interactions (P > 0.05), but the three-way interaction among
pH was lowered by 0.97 units with the addition of 2,4-D. Inclusion experiment, application time of year, and synthetic auxin herbicide
of AMS increased solution pH 0.16 units compared with 2,4-D was significant (P = 0.012); thus, results are presented for each
alone. Treatments that included glyphosate had the lowest solution treatment by experiment and application time of year. The addi-
pH. Reductions in pH of 1.62 to 1.66 pH units were observed for tion of glyphosate was also not significant as a main effect
2,4-D with glyphosate, regardless of glyphosate salt, compared with (P = 0.366); thus, synthetic auxin herbicides were pooled across
2,4-D choline alone. Two treatments with glyphosate (2,4-D chol- glyphosate levels. The potential for glyphosate to affect certain,
ine plus GLY-K or GLY-DMA) had a solution pH lower than 5.0. but not all, synthetic auxin herbicides evaluated was proactively
The premix 2,4-DþGLY formulation had a higher solution pH addressed by comparisons between the levels of glyphosate for each
than 2,4-D plus GLY-K or GLY-DMA treatments. Treatments synthetic auxin, experiment, and application time-of-year combi-
in which DIM replaced a glyphosate formulation had a solution nation (data not shown), which confirmed the results of the
pH 0.10 to 0.62 units lower than 2,4-D alone. Inclusion of ANOVA that glyphosate had no impact on soybean injury.
AMS influenced solution pH for most treatments, except the These results likely also were influenced by the pH of the soil used
Downloaded from https://www.cambridge.org/core. IP address: 134.215.147.19, on 28 Sep 2020 at 13:52:02, subject to the Cambridge Core terms of use, available at
https://www.cambridge.org/core/terms. https://doi.org/10.1017/wet.2020.89You can also read