State of the Ohiwa Harbour and Catchment
←
→
Page content transcription
If your browser does not render page correctly, please read the page content below

State of the Ohiwa Harbour
and Catchment
Prepared by Heather MacKenzie, Environmental Data Officer - Ecology

Title
Title part 2

Bay of Plenty Regional Council
Environmental Publication 2013/07

5 Quay Street
PO Box 364
Whakatāne 3158
NEW ZEALAND
                                                    ISSN: 1175-9372 (Print)
                                                    ISSN: 1179-9471 (Online)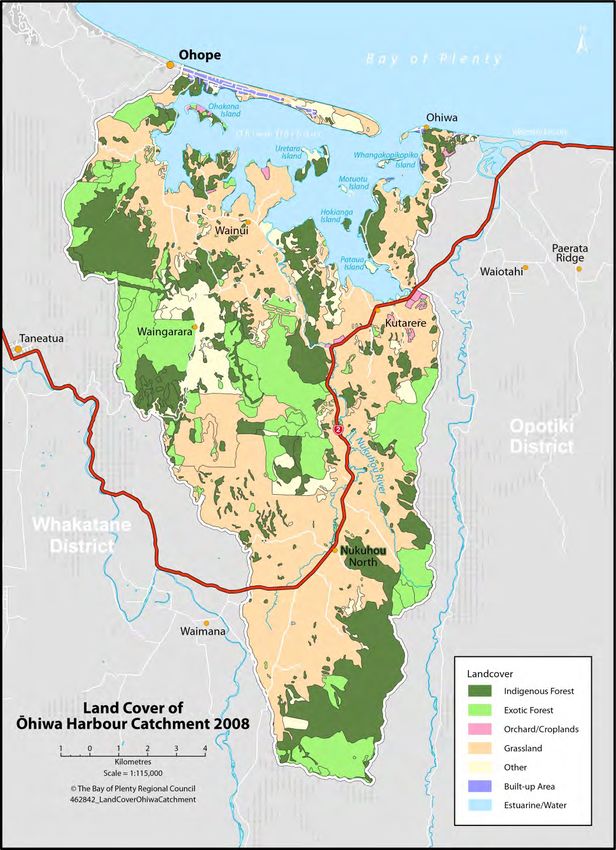
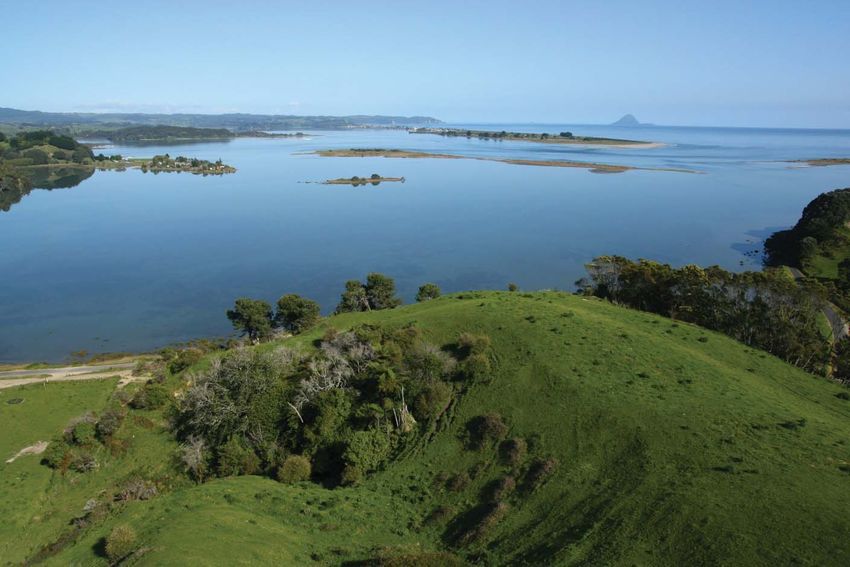
State of the Ōhiwa
Harbour and Catchment

Environmental Publication 2013/07
ISSN: 1175-9372 (Print)
ISSN: 1179-9471 (Online)

April 2013

Bay of Plenty Regional Council
5 Quay Street
PO Box 364
Whakatāne 3158
NEW ZEALAND

Compiled by Heather MacKenzie, Environmental Data Officer -
Ecology

Cover Photo:
Ōhiwa Harbour Catchment
Acknowledgements
There are a great number of people who contributed to this report within their given areas of
expertise, thank you for your time, data/information and assistance in the preparation of this
report. Thank you also to those people who provided feedback and comments at varying
stages of this report.

These people include; Stephen Park, Alastair Suren, Paul Scholes, Nancy Willems,
Shane Iremonger, Tim Senior, Ben Banks, John Douglas, Simon Stokes and Glenn Ellery
(Bay of Plenty Regional Council); Hemi Barsdell, Bridget Palmer, Mithuna Sothieson
(Department of Conservation); Kura Paul-Burke and Meg Collins.

Environmental Publication 2013/07 – State of the Ōhiwa Harbour and Catchment                     i
Executive summary
This report collates monitoring results from a number of monitoring programmes, studies and
reports for the Ōhiwa Harbour and its catchment. It aims to provide a comprehensive look at
the ecological quality of the Ōhiwa Harbour Catchment.

Land cover changes occurring within the Ōhiwa Harbour Catchment have been minor.
Complete fencing of the Ōhiwa Harbour margin has been achieved and 80% of major
streams and rivers feeding into the Harbour have been fenced. A significant area (12%) of
the Catchment has had forestry harvested since 2008, pressure is being placed on areas of
that harvested forestry land to be converted to pasture.

There are numerous threatened flora and fauna, including marsh birds, bats and kiwi
occurring within the Ōhiwa Harbour Catchment. Some plant species recorded were not
previously known to occur within the Catchment. Increases in the abundance and
distributions of native fauna includes Australasian bittern, North Island fern bird, weka, kiwi
and variable oyster catcher have been recorded. Introduced pest plants and animals are
controlled in numerous areas within the Catchment with a focus on those affecting the
indigenous fauna and flora.

Harbour water quality is monitored at two sites and is rated good when compared to other
eastern bay estuaries. However, suspended solid and wastewater related measures are
showing increasing trends on the eastern side of the Harbour. Bathing water quality in the
Harbour remains as one of the best in the Bay of Plenty.

Freshwater quality results in the Nukuhou River show some improvements (suspended
solids and nitrogen) however, we are also seeing an increased temperature trend.

Streams feeding directly into Ōhiwa Harbour contain relatively diverse native freshwater fish
populations. However, around 40% of streams have barriers to fish migration. This figure
needs to be reduced to improve the potential habitat for native fish species.

Although the Ōhiwa tributary shows improvement, the overall macro invertebrate stream
health has not changed in the Ōhiwa Harbour Catchment. Comparison of the Kutarere, and
Wainui and Nukuhou sites to others in the region showed that they had similar macro
invertebrate stream health as other pasture streams.

Marine sediment results are good with contaminants results well below guideline values.
Benthic communities have maintained their species richness and diversity over time. Mussel
beds in the Harbour have been reduced with simultaneous starfish population increases.

Mangrove extents were last mapped in 2009. An area of 11.7 ha has been cleared of
seedlings and outlying plants over the last two years. Current mapping is being carried out
and this will help indicate whether the rate of spread is being halted by removal. Sea grass
extents are showing no changes over time.

Gains have been made within the Ōhiwa Harbour Catchment. With continued improvements
to land use options and land management practices there are likely more gains to be made.
It is important maintain the monitoring programme within the Ōhiwa Harbour and its
Catchment.

Any revision of the Ōhiwa Harbour Strategy needs to focus on monitoring activity to ascertain
the state of the Ōhiwa Harbour and its catchment’s environment over time.

Environmental Publication 2013/07 – State of the Ōhiwa Harbour and Catchment                      iii

Contents

Acknowledgements                                                                i

Executive summary                                                              iii

Part 1: Introduction                                                            1
1.1     Ōhiwa Harbour Catchment                                                 1

1.2     Ōhiwa Harbour                                                           1

Part 2: Land                                                                    3
2.1     Land Cover/Use                                                          3

2.2     Protected Land                                                          6

Part 3: Terrestrial Biodiversity                                                7
3.1     Flora                                                                   7

3.2     Fauna                                                                   8

3.3     Identified Biodiversity Sites                                          10

3.4     Care Groups                                                            11

3.5     Introduced Mammals                                                     11

Part 4: Water                                                                  13
4.1     Harbour Water Quality                                                  13

4.2     Nukuhou River                                                          19

4.3     Freshwater Fish                                                        20

4.4     Macroinvertebrate Monitoring                                           21

Part 5: Marine and Estuary                                                     27
5.1     Sediment Contaminants                                                  27

5.2     Macrofauna                                                             28

5.3     Mangroves                                                              31

Environmental Publication 2013/07 – State of the Ōhiwa Harbour and Catchment    v
5.4   Sea grass                                                                                  32

5.5   Coastal                                                                                    34

Part 6: Summary                                                                                  35
6.1   Land                                                                                       35

6.2   Terrestrial Biodiversity                                                                   35

6.3   Water                                                                                      36

6.4   Marine and Estuary                                                                         37

6.5   Coastal                                                                                    37

Part 7: Recommendations                                                                          39
7.1   Land                                                                                       39

7.2   Terrestrial Biodiversity                                                                   39

7.3   Water                                                                                      39

7.4   Marine and Estuary                                                                         40

Part 8: References                                                                               41

Appendix 1 – Land cover classes used in this report and relating
ones used Land Cover Database3 (LCDB3)                           45

Appendix 2 – Protection Status of Major Rivers and Streams in
Ōhiwa Harbour Catchment 2009 and 2012                                                            47

Appendix 3 – Protection Status of Land in Ōhiwa Harbour
Catchment                                                                                        49

Appendix 4 – Legal Protection                                                                    51

Appendix 5 – Threatened Plants of Ōhiwa Harbour Catchment                                        53

Appendix 6 – Dotterel Breeding Success Table                                                     55

Appendix 7 – Water Quality Results (Tables and Graphs)                                           57

vi                       Environmental Publication 2013/07 – State of the Ōhiwa Harbour and Catchment
Appendix 8 – Sediment Contaminants 61
Appendix 9 – Monitoring Timeline for Ōhiwa Harbour Catchment 63
Tables and Figures
Table 2.1 Land Cover of the Ōhiwa Harbour Catchment for 2001 and 2008 using
Land Cover Database 3. 4
Table 2.2 Stream and River length with stock exclusion for major rivers and
streams in the Ōhiwa Harbour Catchment 2009 and 2012. 5
Table 3.1 Number of Identified Biodiversity Sites and Biodiversity Management
Plans (BMPs) existing in sites in the Ōhiwa Harbour Catchment. 11
Table 4.1 Metal concentrations in shellfish flesh from Ōhiwa Harbour (mg/kg wet
weight). 18
Table 4.2 Average values of the MCI and QMCI, and the number and percentage
of EPT taxa. 23
Table 5.1 Area (canopy hectares) of mangroves in Ōhiwa Harbour from 1945 to
2007. 32
Figure 1.1 Land Cover of the Ōhiwa Harbour Catchment 2008. 3
Figure 4.1. Location of water quality, shellfish quality and benthic macrofauna
sampling sites in Ōhiwa Harbour. 13
Figure 4.3 Suspended solid concentrations and trend slope, Ōhiwa Estuary. 14
Figure 4.4 Suspended solid concentrations and trend slope, Ruatuna Road. 14
Figure 4.5 Adjusted ammonium concentrations and trend slope, Ruatuna Road. 15
Figure 4.6 Log10 E.coli concentrations and trend slope, Ruatuna Road. 15
Figure 4.7 Log10 Enterococci concentrations and trend slope, Ruatuna Road. 16
Figure 4.8 Enterococci concentrations 2003 to 2013. 17
Figure 4.9 Faecal coliform (FC) bacterial numbers recorded in shellfish flesh from
sites in Ōhiwa Harbour from 1992 - 2012. 18
Figure 4.10 Adjusted temperature and trend slope, Nukuhou River. 19
Figure 4.11 Adjusted ammonium (NH4-N) and trend slope, Nukuhou River. 20
Figure 4.12 Location of four study streams within the Ōhiwa Harbour catchment. 22
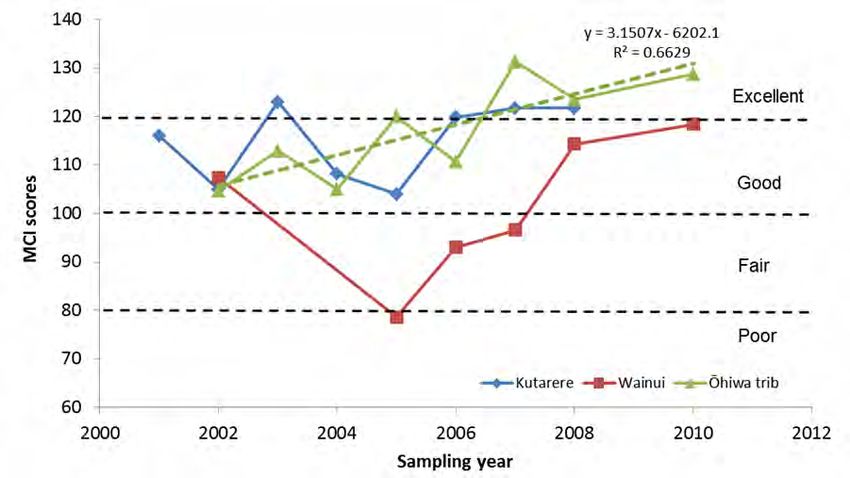
Environmental Publication 2013/07 – State of the Ōhiwa Harbour and Catchment viiFigure 4.13 Temporal fluctuations in MCI scores in the Kutarere, Wainui streams
and the Ōhiwa tributary over time. 24
Figure 4.14 Temporal fluctuations in MCI scores in the Nukuhou River over time. 24
Figure 4.15 Temporal fluctuations QMCI scores in the Kutarere, Wainui streams
and Ōhiwa tributary over time, showing the lack of any trends. 25
Figure 4.16 Temporal fluctuations QMCI scores in the Nukuhou River over time
showing the lack of any trends. 25
Figure 5.1 Copper concentrations at Ōhiwa Harbour sites from 2006 to 2012. 27
Figure 5.2 Zinc concentrations at Ōhiwa Harbour sites from 2006 to 2012. 28
Figure 5.3 Location and number of currently monitored benthic macrofauna sites in
Ōhiwa Harbour. 28
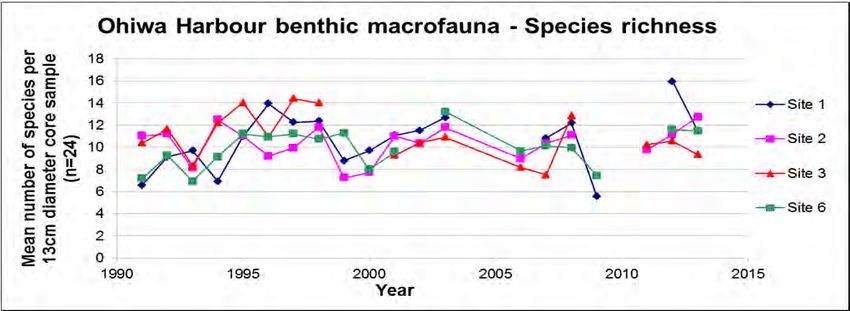
Figure 5.4 Mean species richness of macrofauna samples collected at four
intertidal sandflat sites in Ōhiwa Harbour from 1991 to 2013. 29
Figure 5.5 Mean species diversity of macrofauna samples collected at four
intertidal sandflat sites in Ōhiwa Harbour from 1991 to 2013. 29
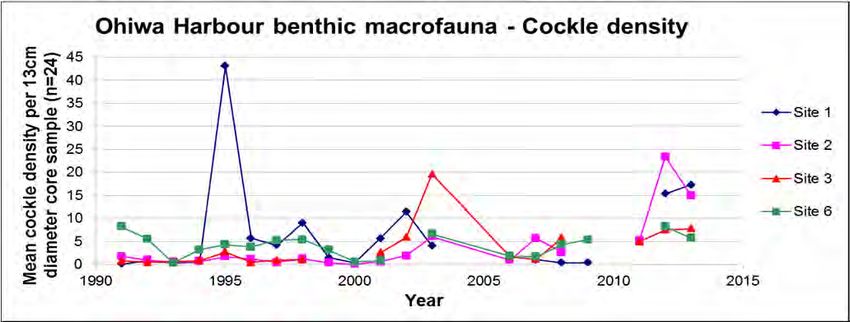
Figure 5.6 Mean density of cockle in samples collected at four intertidal sandflat
sites in Ōhiwa Harbour from 1991 to 2013. 30
Figure 5.7 Percentage mud content of the surface (2 cm depth) sediment at sites
in Ōhiwa Harbour from 1991 to 2013. 30
Figure 5.8 Seagrass cover (hectares) in Ōhiwa Harbour from 1945 to 2007. 33
Figure 5.9 Graph showing change in position of the toe of foredune for coastal
profiles CCS8 and CCS9. 34
viii Environmental Publication 2013/07 – State of the Ōhiwa Harbour and CatchmentPart 1: Introduction
This State of Ōhiwa Harbour and Catchment report was prepared to address two (Health of
the Harbour and Natural Areas, Plants and Animals) of the seven themes of the Ōhiwa
Harbour Strategy. It also provides an assessment of progress against some of the actions
contained in those two themes, in particular actions 7.3.1, 7.3.6, 12.3.3, 12.3.4 and 12.3.5.
The report gives a snapshot of the current physical and ecological condition of the catchment
and harbour as well as some trends for these parameters over time. The term Ōhiwa
Harbour Catchment (referred hereafter as the Catchment) is used when discussing the entire
catchment and Ōhiwa Harbour (referred hereafter as the Harbour) for the marine area.
This report considers the whole Ōhiwa Harbour Catchment, as the entire Catchment drives
the health of rivers, streams and subsequently the Harbour. Five years has passed since the
launch of the strategy.
1.1 Ōhiwa Harbour Catchment
The Ōhiwa Harbour Catchment covers an area of 171 km2 (see Figure 1.1), and
drains into the Ōhiwa Harbour. There are 16 major streams and one river (Nukuhou)
draining the Catchment. The total length of major streams in the Catchment is
approximately 171.4 km. Land use types of the Catchment are covered in section 2.
1.2 Ōhiwa Harbour
The Ōhiwa Harbour is a 26.4 km2 estuarine lagoon enclosed by the Ōhope and
Ōhiwa barrier spits and has 56 km of margin length. It is shallow with 83% of its area
being exposed sand and mudflats at low tide. The Harbour has a very low volume
compared to the spring tidal compartment and is dominated by tidal currents (Park,
2005).
Most estuaries have limited geological life spans and tend to continually infill over
time. Ōhiwa Harbour is rapidly changing and infilling. These processes have been
dominated by the open coastal supply of sediment. Particularly in the entrance of
Ōhiwa Harbour, rapid change in channel size and shape continues to take place. In
the shallow upper reaches of the Harbour, sediments originating from land start to
dominate infill rates and change the nature of the habitat. A full overview of the
Harbour’s geological nature, hydrology and ecology can be read in Park (1991).
There are ten small islands within the Harbour, one of which (Ohakana Island) has
permanent residents. Four of the islands cover less than 1 hectare and their names
are not widely known. The remaining islands are Whangapikopiko Island (Tern
Island) (Government Purpose Wildlife Refuge), Pataua Island (a Scientific Reserve),
Uretara Island (Scenic Reserve), Motuotu Island (Nature Reserve). The Harbour is
classified as an outstanding Site of Special Wildlife (Rasch, 1989a and 1989b) and
as a wetland of international importance for wading birds (Owen, 1994).
Ōhiwa Harbour is an area of significant conservation value with significant
ecological, biological, wildlife, scenic, landscape, historic and cultural values.
1.2.1 Ōhiwa Harbour Strategy
The Ōhiwa Harbour Strategy promotes integrated catchment management, and was
published in June 2008. It identifies issues and concerns raised by local residents,
Iwi and those agencies involved in various aspects of harbour management. The
strategy also provides clear actions to be undertaken to address these issues. For
specific information on the actions refer to the Ōhiwa Harbour Strategy, 2008. The
Environmental Publication 2013/07 – State of the Ōhiwa Harbour and Catchment 1implementation of these actions is overseen by the Ōhiwa Harbour Implementation
Forum (OHIF) and managed by the Ōhiwa Harbour Strategy Co-ordination Group
(OHSCG). Membership of these groups is comprised of representatives of:
• Upokorehe hapū,
• Ngati Awa,
• Whakatōhea,
• Ngai Tuhoe (Waimana Kaaku),
• Whakatane District Council,
• Opotiki District Council,
• Bay of Plenty Regional Council (BOPRC), and
• The Department of Conservation (DOC) is also represented on the OHSCG.
2 Environmental Publication 2013/07 – State of the Ōhiwa Harbour and CatchmentPart 2: Land
2.1 Land Cover/Use
Land use change in the Catchment has been calculated using the Land Cover Data
Base 3 (LCDB3)1. This is a nationally recognised approach to monitoring land cover
and land use over time to provide an indication of the change in the level of risk or
vulnerability to the land. LCDB3 was used as it provided land cover type for 2001
and 2008, ensuring consistency between measures. The land cover for the
Catchment in 2008 can be seen in Figure 1.1. Land cover classes used in Table 2.1,
compared with those from LCDB3 can be viewed in Appendix 1.
Figure 1.1 Land Cover of the Ōhiwa Harbour Catchment 2008.
1
LCDB3 contains detailed information on categories of land cover and their boundaries and is a record of land
cover changes over time. It is a digital map of the surface of New Zealand derived from satellite imagery. The first
two editions, LCDB-1 and LCDB-2, show the state of New Zealand’s land cover in 1996-1997 and in 2000-2001
respectively. The LCDB programme is led by Landcare Research.
Environmental Publication 2013/07 – State of the Ōhiwa Harbour and Catchment 3Results
The total area used for this comparison is more than that of the Catchment area
stated earlier due to historical differences in mapping. The LCDB includes areas of
mangroves, saltmarsh and islands within the Harbour that were not included in the
original Catchment for the Ōhiwa Harbour Strategy 2008. Future measures should
use the LCDB4 and LCDB5 (which are updated versions) once available to ensure
consistency between measures.
Generally only small changes have occurred in areas making up each cover class.
The most significant change was the loss of 493 ha of indigenous scrub to pasture
and 97 ha to exotic forest plantation respectively. Indigenous vegetation within the
Ōhiwa Harbour Catchment is 5,726 ha (33%), of which only 22% (1,256 ha) is
formally protected (see Protected Land 2.2).
Table 2.1 Land Cover of the Ōhiwa Harbour Catchment for 2001 and 2008
using Land Cover Database 3.
Combined LCDB land cover data for Ōhiwa Harbour Catchment
Area 2001 Area 2008 Area of Change
Land cover
(ha) (%) (ha) (%) 2001 to 2008 (ha)
Exotic Plantation 3201.5 18.28 3253.5 18.58 52.1
Exotic Scrub/Shrubland 25.1 0.14 25.1 0.14 0.0
Horticulture 51.4 0.29 82.8 0.47 31.5
Indigenous Forest 3576.6 20.42 3583.9 20.47 7.3
Indigenous
Scrub/Shrubland
2379.7 13.59 1848.7 10.56 -531.0
Pasture 7769.0 44.36 8209.2 46.88 440.1
Saltmarsh, wetlands,
dunes and mangroves
315.9 1.80 315.9 1.80 0.0
Urban and Roads 187.3 1.07 187.3 1.07 0.0
Water 5.4 0.03 5.4 0.03 0.0
Total 17511.8 100 % 17511.8 100 %
Discussion
There was a loss of 531 ha of indigenous scrub/shrubland between 2001 and 2008.
The loss of indigenous vegetation reduces the availability of habitat for terrestrial
species, although no investigation on the quality of the habitat lost has been
undertaken. This loss may also result in increased sediment runoff from affected
areas due to vegetation removal and subsequent land use change.
Overall there is still the need to implement soil conservation spaced planting on hill
country to encourage the more of Land Use Capability Class 6 and 7 land to convert
to exotic forest options. Since 2008 there has not been a significant increase in
exotic forestry plantings other than in the Waingarara stream catchment at
approximately 190 ha.
There are unknowns and errors in LCDB3 data due to the level of mapping, being at
a national scale rather than regional. LCDB4 is due for release in 2014 and will be
the basis for analysis of the change up until 2012. Hopefully these future LCDB
databases will take into account the regional knowledge to give more accurate
mapping of land cover.
4 Environmental Publication 2013/07 – State of the Ōhiwa Harbour and Catchment2.1.1 Fencing and Retirement
The fencing of riparian margins of the main tributaries entering Ōhiwa Harbour aims
to reduce sediment and nutrient loads of waterways entering the Harbour.
Results
The total length of major streams in the Catchment fenced at the end of 2009 was
126.2 km leaving 26% of streams unfenced. At the end of 2012 the total length
fenced was 137.5 km leaving 20% unfenced (Table 2.2). For unfenced and fenced
distances on each of the major streams and Nukuhou River see Appendix 2.
Table 2.2 Stream and River length with stock exclusion for major rivers and
streams in the Ōhiwa Harbour Catchment 2009 and 2012.
Total stream Stock excluded Percentage of river/stream
Year
length (km) (km) length protected
2009 171.4 126.2 74 %
2012 171.4 138.5 81 %
Complete fencing of the Harbour margin to exclude stock was achieved in the
2011/12 financial year.
Discussion
The amount of riparian fencing of major streams and rivers within the Catchment is
high. While, the width of stream margins fencing has been relatively narrow and with
limited re-vegetation, the benefit is the removal of stock from having direct access to
stream margins and beds. This provides protection from bank erosion due to stock
trampling and the removal of stock from accessing waterways will remove direct
effluent input. With limited re-vegetation in these areas, erosion due to other factors
and over ground inflows will not be greatly reduced without sufficient re-vegetation
plantings and retirement area width.
Generally streams with good riparian vegetation cover and shade have lower in-
stream temperatures, higher oxygen saturation and a healthier overall ecosystem.
2.1.2 Forestry Activity
Results
Since June 2008 there has been approximately 1,962 ha of exotic forestry harvested
within the Catchment. There is a total of 18.6% of the Catchment in exotic forestry,
the area harvested is a large proportion of this approximately 60%, which makes up
12% of the Catchment. There is no current accurate mapping but field knowledge
suggests only a small proportion of this has been converted to pasture, the
remainder has been replanted.
There remains significant pressure on landowners to not replant harvested land with
exotic forestry. This is due to the demand for grazing land driven by the current
dairying boom and traditional sheep and beef farms being used as dairy support
units. Pasture land cover has increased from 2001-2008 (Table 2.1), this is maybe
from harvested forestry land and cleared indigenous scrub/shrubland.
Environmental Publication 2013/07 – State of the Ōhiwa Harbour and Catchment 5Discussion
Increased sedimentation is the greatest risk posed to rivers, streams and harbours
from forestry activities. The main contributors from forestry activities to increased
sediment loads are roading, stream crossings and earthworks associated with
harvesting (skid sites and logging roads). Fransen (2001) shows erosion rates
directly related to these are up to three times that of surface erosion rates. Studies
in pasture and plantation forestry catchments in the Hawkes Bay showed that during
the logging and harvesting period, twice the amount of suspended sediments
recorded from the forested catchment to that of pasture (Fahey et. al., 2003).
Overall afforested land reduces erosion and sediment into waterways significantly
over the life cycle of the trees, which is 28-30 years for pinus radiata, however, the
pre-harvesting and prior to replanting periods are a critical times for sedimentation
risk and forestry companies pay particular detail to reducing this risk.
Considering the amount of harvested forestry within the Catchment we would have
expected to see an increase in measured suspended solids in the Nukuhou River
and other monitoring sites. However, suspended solids results for the Nukuhou
River suggest that this has not occurred to the degree expected. This is a positive
result in relation to forest harvest methods applied and the forestry company’s
management of their operations.
The area of forestry clearance from 2008 to the start of 2013 was over half of the
forestry within the Catchment. It would be expected that sediment risk from forestry
will be much lower due to a smaller area of harvestable age in forestry over the next
ten years within the Catchment. It is important to maintain communication with
forestry companies with a focus on reducing impacts of erosion due to forestry
activities through education and the consenting process.
2.2 Protected Land
The area of legally protected land with the Catchment is 1,625 ha (9.5%). Of that,
82% is indigenous vegetation. The level of legal protection on different parcels of
land varies. A table of the areas of different types of protection can be viewed in
Appendix 3 with a discussion on the meaning of legal protection in Appendix 4.
6 Environmental Publication 2013/07 – State of the Ōhiwa Harbour and CatchmentPart 3: Terrestrial Biodiversity
3.1 Flora
3.1.1 Threatened Species
In 2011, 13 sites were surveyed for a total of 16 threatened or significant species.
Sites surveyed were identified from historical records. A total of 25 populations of
10 significant species were located, including 13 new populations. The new
populations included four populations of two nationally threatened species (Pimelea
tomentosa and Kunzea ‘Thornton’) at several sites. Five species not previously
known to be present in the Catchment were also found (Wildlands, 2011). See
Appendix 5 for a table of the threatened or significant species found within the
Catchment.
3.1.2 Native Vegetation Cover
Native vegetation cover within the Catchment is discussed in 2.1 Land cover/use.
The measure of indigenous cover does not give any indication of the condition of
understory or the processes occurring within. The development of an on-going
monitoring programme of sites throughout the Catchment to assess the condition of
indigenous vegetation is required.
3.1.3 Pohutukawa Monitoring
Three sites monitored in 2012 as part of the five yearly pohutukawa (Metrosideros
excelsa) monitoring of the Bay of Plenty are located within the Catchment
(Whitiwhiti, Hiwarau and Pataua Island). Of these sites two (Whitiwhiti and Hiwarau)
showed improved pohutukawa canopy with thicker canopies and less greying than
that observed in 2007. In 2007 these two sites had increased canopy greying,
dieback and thinning from 2005. Pataua Island showed a slight decline in
pohutukawa canopy condition in 2007, it showed no change in 2007 from 2005. No
possum (Trichosurus vulpecula) browse was observed at any of the three sites in
2012.
Puriri (Vitex lucens) dieback and greying at Hiwarau has increased since 2007. This
dieback is common throughout the North Island and its cause is under investigation
but not yet known. It is not thought to be directly related to possum impacts.
3.1.4 Pest Plants
A range of pest plants are found throughout the Catchment but this is no more than
in similar environments and considerably less than in more densely populated
areas. There are no pest plants present that are listed in the agency pest or
eradication/exclusion pest categories of the Regional Pest Management Plan
(RPMP).
As far as RPMP containment pests are concerned, the common farm weeds such
as; blackberry (Rubus fruticosus agg.), gorse (Ulex europaeus) and ragwort
(Senecio jacobaera) are locally common but generally have low impacts and are
generally well controlled by landowners. Containment pests that have environmental
impacts include; wild ginger (Hedychium gardnerianum), woolly nightshade
(Solanum mauritianum) and old man’s beard (Clematis vitalba). All these are being
steadily controlled by landowners with support from the Bay of Plenty Regional
Council and their populations have been reduced in density and distribution in
recent years, though this reduction is hard to quantify. All known infestations of old
Environmental Publication 2013/07 – State of the Ōhiwa Harbour and Catchment 7man’s beard are reduced to zero density each year, small infestations of yellow flag
iris (Iris pseudacorus) and climbing spindle berry (Celastrus orbiculatus) have been
eradicated. Two infestations of the invasive estuarine cord grass (Spartina sp.) have
also been eradicated from the Harbour mudflats.
Other invasive weeds with substantial environmental impacts include; Japanese
honeysuckle (Lonicera japonica), Chinese privet (Ligustrum sinense) and three
species of wattle (Acacia sp, Paraserianthes sp.) which are all too widespread to be
able to effectively tackle. Most infestations of Japanese walnut (Juglans ailantifolia),
which particularly favours stream margins, have been controlled in recent years. A
number of other weeds such as; wandering Willie (Tradescantia fluminensis) and
jasmine (Jasminum polyanthum) are locally common. The grass weeds of estuarine
margins, saltwater paspalum (Paspalum vaginatum) and sea couch (Elytrigia
repens), are increasingly widespread around the Harbour are of considerable
concern as they both completely displace native estuarine vegetation and
consolidate the substrate in which they grow. No attempt to control these grasses
has been made.
3.2 Fauna
3.2.1 North Island Long Tailed Bats
In February 2012 Digital Bat Recorders were set up in areas of potential bat flight
paths at three sites within the Catchment; Waioeka Conservation Area, Kotare and
Matekerepu Scenic Reserves. This was carried out to identify the presence or
absence of bats within the Catchment.
Results
North Island Long Tailed Bats (Chalinolobus tuberculata) were detected in Waioeka
Conservation Area, and not detected within either Kotare or Matekerepu Scenic
Reserves.
Discussion
The survey carried out in 2012 was limited to only a few sites, it identified the
presence of bats within the Catchment however it is unknown how far down the
Catchment they are present.
3.2.2 Marshbirds of Ōhiwa Harbour
A survey of marshbird populations and habitat around Ōhiwa Harbour was
conducted between November 2010 and January 2011. This work (Beattie, 2010)
compared results on the abundance and distribution of marshbird species, as well
as the overall health of the Harbour estuarine margin habitat, with a survey
conducted by the Department of Conservation in 1990.
Results
Three marshbird species increased in abundance and distribution between 1990
and 2010, these were; Australasian bittern (Botaurus poiciloptilus, Nationally
Endangered), banded rail (Gallirallus philippensis assimilis, Naturally Uncommon)
and North Island fern bird (Bowdleria punctata vealeae, Declining). While one the
spotless crake (Porzana tabuensis tabuensis, Relict) species decreased in
abundance. Marsh crake (Porzana pusilla affinis, Sparse) were not observed during
either survey. The total number of recorded bird species increased, but this is
suspected to be largely due to increased recording of non-target species.
8 Environmental Publication 2013/07 – State of the Ōhiwa Harbour and CatchmentA similar range of threats and impacts was reported between the two surveys, and
there was a slight increase in surveyed habitat quality. Weka were recorded during
this survey and not previously in 1990.
Discussion
The snapshot nature of the survey and the cryptic behaviour of marsh birds limits
the interpretation of these results. However, this survey still demonstrates the
Harbour is of national significance for Australasian bittern and banded rail, and
regional significance for North Island fern bird. The work of care groups within the
Harbour has greatly increased the value of some habitat areas for marshbird
species. Maintaining habitat diversity, and addressing the threats and impacts are
essential for ensuring the long-term viability of marshbird populations at the
Harbour.
The increase in presence of weka around the Harbour could affect marshbird habitat
and is something that may require future monitoring or at least particular attention
during future marshbird surveys.
Partial re-measures of marshbird sites have been scheduled five yearly with all sites
to be re-measured ten yearly. The five yearly re-measure will provide more regular
information and potentially any trends occurring within the sites of Outstanding, High
and some Moderate quality habitat.
3.2.3 New Zealand Dotterel
New Zealand dotterel (Charadrius obscurus aquilonius) distribution has remained
relatively constant since 2005, with breeding and flocking occurring at similar levels
in the same locations. In general breeding success has been above the 'productive'
level of 0.5 fledged chicks per pair per season (see table in Appendix 6), thanks
largely to the volunteer efforts of the Ōhiwa Reserves Care Group and Forest and
Bird volunteers (J. Barsdell pers. comm.). Predator control carried out for dotterel
nest protection also benefits other species nesting success also e.g. Caspian tern
(Hydroprogne caspia, Nationally Vulnerable), black billed gull (Larus bulleri,
Nationally Endangered) and variable oyster catcher (Haematopus unicolor,
Recovering).
3.2.4 Wading Birds
Wading bird counts have been taken in Ōhiwa Harbour by the Ornithological Society
of New Zealand (OSNZ) since 1986. Bird counts are held every June and November
providing a glimpse of what is happening on the day; they do not represent the
actual numbers of birds that are breeding in the Harbour over each season.
Pest control has been occurring in four main breeding areas within the Harbour,
concentrating on New Zealand dotterel, Variable oystercatchers, White-fronted terns
and Caspian terns.
Results
Bird count data were plotted in Collins (2013) to view changes in bird numbers over
time in light of pest control in some areas of the Harbour. November and June
counts were plotted separately as some species are migratory.
Key results from this were:
• Bar Tailed godwit (Limosa lapponica) numbers have decreased over time.
• Variable oystercatchers have increased to record levels.
Environmental Publication 2013/07 – State of the Ōhiwa Harbour and Catchment 9• Royal spoonbills (Platalea regia) arrived May 2006, and have returned each
year in increasing numbers.
• Birds not reported in the last few years are, Eastern curlew (Numenius
madagascariensis), Reef heron (Egretta sacra sacra) and Turnstone (Arenaria
interpres).
• Caspian tern (Hydroprogne caspia) numbers have remained stable at 40-45
birds. They raise six to eight chicks per year.
• Black-backed gull (Larus dominicanus dominicanus) numbers have increased
since the 1980’s.
Discussion
The decrease in godwit numbers is similar to the decreased godwit numbers
throughout New Zealand. This is likely due to feeding stop-over places in Asia being
developed for farm and industrial lands.
Variable oystercatchers have shown the greatest increase in numbers, especially on
Whangakopikopiko Island where it is most likely due to the intensive pest control of
rats, stoats and rabbits.
Black-backed gulls are under pest control regimes, the eggs are pricked to try and
reduce the impact they are having on nesting birds in the Harbour.
3.2.5 North Island Weka
North Island Weka (Gallirallus australis greyi) were not present in the Catchment
before 2005, and are now being commonly seen and heard around the Harbour’s
eastern shores. Weka success in terms of spread and population increase is due to
their ability to defend themselves against predators and favourable climatic
conditions. This has been highlighted through the Mōtū Weka Project which has
identified that over the last 10 years, juvenile and adult survivorship is the same
between intensively managed sites and sites where there is no pest control
(J. Barsdell pers. comm.).
Discussion
Increase in weka numbers around the Harbour is likely to affect marshbird habitat
(Beattie, 2010).
3.2.6 North Island Brown Kiwi
Due to the Ōhope Kiwi project the population of North Island Brown Kiwi (Apteryx
mantelli) in the Ōhope Scenic Reserve has increased overtime and is a continuing
trend. Although the reserve is outside the Catchment the overflow effect with birds
seeking out suitable habitat has meant more kiwi are present within the Catchment.
3.3 Identified Biodiversity Sites
There are two types of identified biodiversity sites, these are detailed below:
High Value Ecological Sites (HVES) are those priority sites on which the Council
proposes to focus its support effort. There are 206 sites across the region identified
as priorities for management. This list was derived from two primary criteria:
Category 12 sites (identified under the Protected Natural Areas Criteria) and sites
2
Category 1 sites are the best quality or only remaining representative examples of indigenous vegetation or
wildlife habitats on particular landform units within a bioclimatic zone in an ecological district. They contain some
of the largest, best quality, or only remaining examples of indigenous vegetation or wildlife habitat.
10 Environmental Publication 2013/07 – State of the Ōhiwa Harbour and Catchmentthat have since been recognised as being of international, national or regional
significance in a more recent assessment under the Regional Policy Statement
Criteria.
‘Biodiversity sites’ are those with biodiversity values present which landowners and
the community wish to protect, but are not High Value Ecological Areas.”
The number and area of HVES and Biodiversity Sites within the Catchment can be
seen in Table 3.1. There are 66 identified biodiversity sites within the Catchment, of
which 10 are High Value Ecological Sites (HVES). The sites are a mixture of tenures
including sites administered by DOC, district councils, and private land.
Seven HVES within the Catchment are managed (70%), however management
does not always cover the entire site. Nukuhou Saltmarsh is part of a larger site that
includes public and private land, and is managed under a Biodiversity Management
Plan covering approximately 21 ha (Table 3.1). Of the non-HVES two are managed
under Biodiversity Management Plans which total 86.17 ha.
Table 3.1 Number of Identified Biodiversity Sites and Biodiversity Management
Plans (BMPs) existing in sites in the Ōhiwa Harbour Catchment.
Number of Number of BMPs
Area (ha) Area (ha)
Sites on sites
High Value
10 1447 1 86.17
Ecological Sites
Biodiversity
56 38777 2 21.2
Sites
3.4 Care Groups
There are currently four care groups operating within the Catchment. These groups
work either around the Harbour margins or on islands within the Harbour. The total
area managed by care group work is approximately 234.3 ha. The main goal of
these groups is improved biodiversity.
The level of intensity and work carried out by the different care groups varies. Two
groups carry out systematic animal pest control with regular trapping and baiting,
weed control and re-vegetation planting. They also carry out outcome monitoring in
the form of bird counts and monitoring. The remaining two carry out occasional rat
control.
3.5 Introduced Mammals
The full suite of pest animals will always be present throughout the Catchment to
some extent.
There has been intensive possum and rat (Rattus spp.) control delivered over
235 ha, including: Paparoa Road, Ōhiwa Domain, Whangakopikopiko Island,
Nukohou Saltmarsh, Te Ru, Ōhiwa Spit and Uretara Island. Control of predators
(mustelids and cats) is also delivered over most of these sites, along with another
641 ha including; Ngāti Awa farm and Waiotane Scenic Reserve. A total area of
876 ha is currently under some kind of animal pest control. Informal possum control
also occurs subject to possum fur price but is generally intense enough to keep
numbers relatively low in more open areas. Local goat (Capra hircus) control occurs
within the Catchment.
Environmental Publication 2013/07 – State of the Ōhiwa Harbour and Catchment 11Part 4: Water
4.1 Harbour Water Quality
4.1.1 Water
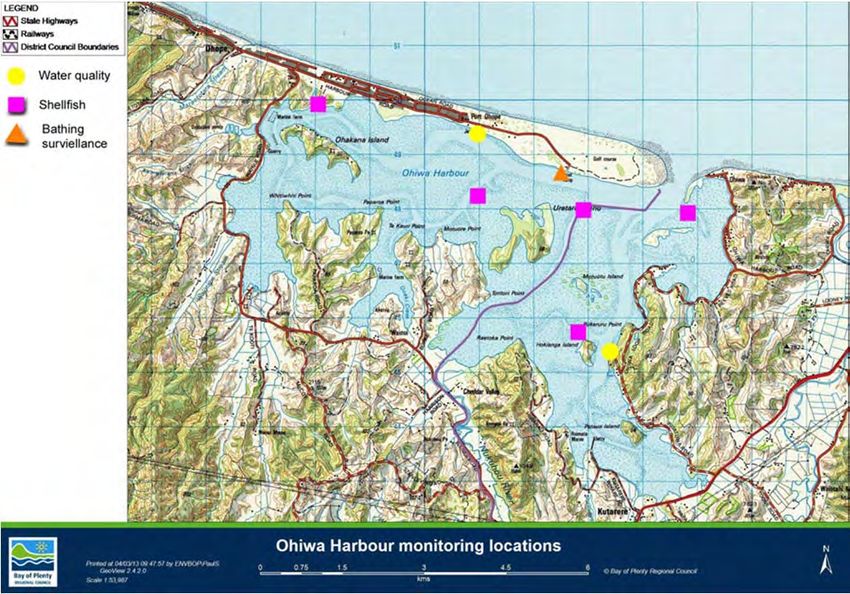
Water quality has been regularly monitored by Bay of Plenty Regional Council at two
sites in Ōhiwa Harbour since 1990. These sites are located at the boat ramp at
Ruatuna Road opposite Hokianga Island and at the Port Ohope wharf (Figure 4.1).
Figure 4.1. Location of water quality, shellfish quality and benthic macrofauna
sampling sites in Ōhiwa Harbour.
Trend (SEN) analysis has been undertaken on estuary sites, positive slopes indicate
an increase and negative slopes indicate decrease of a water quality parameter.
Results
Water quality statistics are presented in Appendix 7 (Tables 1 and 2). Overall these
show that water quality results are good compared to other similar eastern bay
estuaries in the Bay of Plenty. As shown by the conductivity levels in Tables 1 and 2
(Appendix 5) there is very little freshwater influence at these sites, particularly as
samples are taken at high tide. Both sites within the estuary have some increasing
and significantly increasing trends of some parameters. Suspended solids
concentrations showed similar increases at both sites within the Harbour
(Figures 4.3 and 4.4).
Environmental Publication 2013/07 – State of the Ōhiwa Harbour and Catchment 13Ohiwa Estuary @ Port - Sen slope trend for SS
60
40
SS (g/m3) residuals
20
0
-20
1/1/90 1/1/94 1/1/98 1/1/02 1/1/06 1/1/10
Date
Figure 4.3 Suspended solid concentrations and trend slope, Ōhiwa Estuary.
Ohiwa Harbour @ Ruatuna Rd - Sen slope trend for SS
80
60
40
SS (g/m3) residuals
20
0
-20
-40
1/1/90 1/1/94 1/1/98 1/1/02 1/1/06 1/1/10
Date
Figure 4.4 Suspended solid concentrations and trend slope, Ruatuna Road.
Ammonium (NH4-N) also shows a significant increasing trend at the Ruatuna Road
site (Figure 4.5). Ammonium concentrations at Ruatuna Road are on average only
slightly above those at Port Ōhope and less than similar sites in the Bay of Plenty.
14 Environmental Publication 2013/07 – State of the Ōhiwa Harbour and CatchmentOhiwa Harbour @ Ruatuna Rd - Sen slope trend for NH4N
0.08
0.06
NH4N (g/m3 )residuals
0.04
0.02
0.00
-0.02
1/1/90 1/1/94 1/1/98 1/1/02 1/1/06 1/1/10
Date
Figure 4.5 Adjusted ammonium concentrations and trend slope, Ruatuna Road.
Also displaying an increasing trend at Ruatuna Road are the faecal indicator
bacteria E. coli and enterococci (Figures 4.6 and 4.7).
Ohiwa Harbour @ Ruatuna Rd - Sen slope trend for log E.coli
3
2
log E.coli (residuals)
1
0
-1
-2
1/1/90 1/1/94 1/1/98 1/1/02 1/1/06 1/1/10
Date
Figure 4.6 Log10 E.coli concentrations and trend slope, Ruatuna Road.
Environmental Publication 2013/07 – State of the Ōhiwa Harbour and Catchment 15Ohiwa Harbour @ Ruatuna Rd - Sen slope trend for log Enterococci
2.5
2.0
1.5
log Enterococci (residuals)
1.0
0.5
0.0
-0.5
-1.0
1/1/90 1/1/94 1/1/98 1/1/02 1/1/06 1/1/10
Date
Figure 4.7 Log10 Enterococci concentrations and trend slope, Ruatuna Road.
Discussion
Suspended solid increases at monitored sites is most likely due to high sediment
loads being introduced to the Harbour during several intense storm events post
2004. Increased sedimentation is the greatest risk posed to rivers, streams and
eventually the Harbour, suspended solids can come from storms eroding vulnerable
hill country or land use and management activities such as earthworks. The loading
of the sediment during such storms will have detrimental impacts to the Harbour
including smothering of fauna, decreased water clarity, increased nutrient loading,
and potentially changes to habitat zones.
While ammonium levels are not near concentrations that might cause a toxicity
concern, the increase at the Ruatuna Road site may be a symptom of land use
related changes e.g. increased discharges from pastoral agriculture and
wastewaters. The increases in the faecal indicator bacteria E. coli and enterococci
also show an increase of impacts of land use, predominantly pastoral agriculture on
the eastern side of the estuary. While average faecal indicator bacteria levels are
well below contact recreation guidelines, maximum faecal indicator bacteria levels
can be above these guidelines.
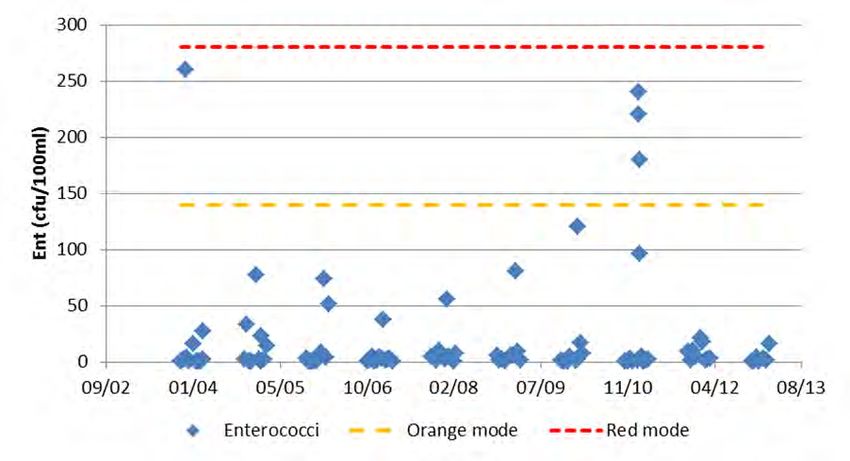
4.1.2 Bathing water quality
Ministry for the Environment sets out swimming guidelines for marine waters based
on enterococci bacteria. These set out different levels with the acceptable “green”
mode criteria that no single sample has greater than 140 enterococci/100 mL, an
“orange alert mode”, and if two consecutive samples exceed 280 enterococci/
100 mL it is classified into the “red action mode”.
Results
Bathing surveillance monitoring is undertaken in summer at the Ōhope Reserve
boat ramp.
16 Environmental Publication 2013/07 – State of the Ōhiwa Harbour and CatchmentFigure 4.8 Enterococci concentrations 2003 to 2013.
Figure 4.8 displays enterococci results from 2003 to 2013. Apart from once in 2003,
enterococci results have only been in the orange alert mode after an intense storm
event in 2011. Ōhiwa Harbour rates as one of the best in the region for bathing
water quality.
Discussion
Water quality results are good and are comparable to other similar eastern bay
estuaries in the Bay of Plenty.
4.1.3 Shellfish
Shellfish have been sampled at a number of sites within Ōhiwa Harbour since 1992
(Figure 4.1). Most sampling was carried out for checking bacterial numbers in
shellfish. Faecal coliform and Enterococci numbers are measured as indicators of
the possible presence of disease causing bacteria/viruses, but do not cause
sickness themselves. While there are no national guidelines, the shellfish industry
uses a compliance standard according to which the median of five samples should
be 230 faecal coliforms/100g shellfish flesh or less, and all samples should be less
than 330 faecal coliforms/100g flesh.
In Figure 4.9 the faecal coliform concentration present in shellfish flesh for sites
around the Harbour are shown. Species tested include:
• Cockle (Austrovenus stuchburyi); found throughout muddier intertidal and
subtidal areas, only abundant in harvestable numbers at a few locations.
• Pipi (Paphies australis); often abundant around the mouth of the estuaries but
extend to sandy areas of the inner estuary.
• Oyster (Tiostrea chilensis lutria); commonly found cemented to rocks or
mangroves in the intertidal zone.
Environmental Publication 2013/07 – State of the Ōhiwa Harbour and Catchment 17Figure 4.9 Faecal coliform (FC) bacterial numbers recorded in shellfish flesh
from sites in Ōhiwa Harbour from 1992 - 2012.
Two sites in the Harbour are analysed for metal contamination of shellfish flesh.
Cockles were sampled from just northwest of Hokianga Island and pipi from the bed
opposite the Ōhope boat ramp where the Nukuhou channel ends. Results are
shown in Table 4.1.
Table 4.1 Metal concentrations in shellfish flesh from Ōhiwa Harbour (mg/kg
wet weight).
Guideline Cockles Pipi
Arsenic 1.0 (inorganic) 2.4 (total) 2.9 (total)
Cadmium 2.0 0.05 0.18
Chromium 1.5 0.31 0.68
Copper 70 0.71 1.2
Lead 2.5 0.02 0.18
Zinc 1000 6.7 11.1
The arsenic guideline in Table 4.1 is in terms of inorganic arsenic where results
presented are totals. Studies of results from Maketū Estuary have shown that
inorganic arsenic is around a tenth of total arsenic. This would result in the inorganic
arsenic in the table above being approximately 0.24 and 0.29 mg/kg for cockles and
pipi respectively. All metal concentration results meet the guidelines for consumption
of shellfish, except arsenic.
By world standards arsenic and chromium are elevated in most shellfish in the
Bay of Plenty. Arsenic is clearly sourced from geothermal inputs and the same may
be true for chromium. This is relevant due to soil types within the Catchment.
Discussion
Monitoring results of shellfish in the Harbour show a heightened risk to shellfish
consumers due to increased Faecal coliform and Enterococci numbers after storm
events. Strong winds in the Harbour may also raise bacterial numbers by
re-suspending sediment and associated bacteria.
18 Environmental Publication 2013/07 – State of the Ōhiwa Harbour and CatchmentStudies have shown that shellfish may take a week or longer to expel potential
pathogens before safe consumption levels are reached and it is therefore
recommended people wait at least five days before collecting shellfish.
4.2 Nukuhou River
4.2.1 Water quality
The Nukuhou River Catchment is 103 km2 or 60% of the Ōhiwa Harbour Catchment.
Mean flow of the Nukuhou River based on data from 1990-2012 is around
1.67 m3/sec. There is a water quality monitoring site on the Nukuhou River where
data has been collected since 1990. Data from this site has been analysed for
trends and overall water quality status and is presented in Appendix 7, Table 3.
Results
Dissolved oxygen levels in the Nukuhou River have been on occasion below 80%
saturation3, usually in mid to late summer. Suspended solid concentrations are
improving with a trend rate of over 2.5% decrease per annum over the period 1990
to 2012 (Appendix 5, Table 3). The Nukuhou River also displays a trend of
increasing temperature (Figure 4.10).
10
5
Tempertaure (deg C, adjusted)
0
-5
-10
-15
1/1/90 1/1/94 1/1/98 1/1/02 1/1/06 1/1/10
Date
Figure 4.10 Adjusted temperature and trend slope, Nukuhou River.
The Nukuhou River also has higher than average nitrogen and phosphorus levels in
the river compared to other eastern Bay of Plenty rivers. Dissolved nitrogen
parameters, oxides of nitrogen (TOx-N) and ammonium (NH4-N), are below levels at
which toxic effects to organisms are likely to occur, but are above levels at which
limitation of periphyton growth occurs. However, periphyton growth is limited by the
sandy nature of the substrate in many locations.
3
The Regional Water and Land Plan S9(b), states ‘The discharge shall not cause the oxygen level to fall below
80% of saturation concentration’.
Environmental Publication 2013/07 – State of the Ōhiwa Harbour and Catchment 190.4
Ammonium-N (g/m3, adjusted)
0.2
0.0
-0.2
1/1/90 1/1/94 1/1/98 1/1/02 1/1/06 1/1/10
Date
Figure 4.11 Adjusted ammonium (NH4-N) and trend slope, Nukuhou River.
Nitrogen trends in the river show a significant decreasing trend for dissolved and
total nitrogen (TN) (Figure 4.11)
There are also decreasing trends in faecal indicator bacteria (Appendix 7, Table 3).
However, these concentrations are higher than other monitored Bay of Plenty
streams and rivers and are at often at levels above those recommended for contact
recreation.
Discussion
The decrease in suspended solid, nitrogen concentrations and faecal indicator
bacteria trends indicate improved land management practices to be showing
dividends. However, suspended solid and faecal indicator bacteria levels are still
elevated, compared to other Bay of Plenty rivers. The Nukuhou is a unique in terms
of geology which is part of the reason for this difference. The trend of increasing
temperature is probably due to widening of the stream in sections as well as
changes in riparian vegetation.
The occasional low dissolved oxygen level, coupled with elevated temperatures and
elevated levels of suspended solids, put the ecosystem under stress at these times.
Low dissolved oxygen concentrations place aquatic organisms under stress and if
sustained can cause death. Macroinvertebrate monitoring (Section 4.4) suggests
that aquatic organisms may have been impacted.
4.3 Freshwater Fish
Bloxham (2007) identified that around 40% of streams surveyed within the
Catchment contained complete or partial barriers to fish migration; many of these
were close to the Harbour. Fish with the greatest climbing ability (banded kokopu
(Galaxias fasciatus), eels (Anguila spp.) and redfin bully (Gobiomorphus huttoni))
were shown capable of negotiating all but one barrier, but in most instances barriers
prevented fish without climbing ability (bluegill bully (Gobiomorphus hubbsi),
common bully (Gobiomorphus cotidianus), giant bully (Gobiomorphus gobioides),
20 Environmental Publication 2013/07 – State of the Ōhiwa Harbour and Catchmentinanga (Galaxias maculatus), smelt (Retropinna retropinna) and torrent fish
(Cheimarrichthys fosteri)) from reaching and exploiting upstream habitat.
During this survey a total of eleven fish species were encountered. Historically
sixteen freshwater fish species have been identified from the Catchment, including
three brackish water species. During this survey no new species were recorded and
no new shortjaw kokopu (Galaxias postvectis) or koaro (Galaxias brevipinnis)
populations were found. Long fin eel, a species listed in Department of
Conservation’s fish classification system as “declining” were present at 59 percent of
sites. Seven new populations of the “regionally threatened” banded kokopu were
found, bringing the number of known populations in the Catchment to eleven. Also
found were two new populations of bluegill bully and one of torrentfish and giant
bully, which brings their total populations in the Catchment to four, two and two
respectively. Redfin bullies, recorded previously from a number of streams in the
Catchment, were again found to be widespread (over 50 percent containing this
species) in streams with a closed or semi-closed native or mixed native/forestry
riparian canopy. Smelt were found up to 20 km inland in larger streams containing
barrier free fish passage. Although present in the neighbouring Catchment
(Maraetōtara Stream), no giant kokopu (Galaxias argenteus) populations have been
found in streams feeding the Harbour.
Surveys carried out in 2011-2012 to expand on this information identified two new
bluegill bully populations and one new population of banded kokopu.
Discussion
To enable trends to be drawn from this data, follow up surveys are required. A large
number of un-surveyed streams remain within the Catchment. However, a full
survey of every stream within the Catchment would be a very large task.
4.3.1 Whitebait
Historical records (Mitchell, 1990) detail observed spawning of whitebait from three
sites around Ōhiwa Harbour; Tunanui Stream, Waiotane Stream and a small stream
on the Nukuhou River opposite the old dairy factory. Spawning activity was
observed more recently, in April 2011, on the true left of the Nukuhou River in the
recently established whitebait spawning area (Barsdell, 2011).
Discussion
Whitebait spawning is one area of ‘assessing the ecological quality of Ōhiwa
Harbour’ (action 12.3.3) that requires more work. It is impossible to draw
conclusions on the current status of whitebait with only limited information. A method
for monitoring and recording potential whitebait spawning habitat is currently under
development. Data from a survey using this method should be available for the next
five yearly report.
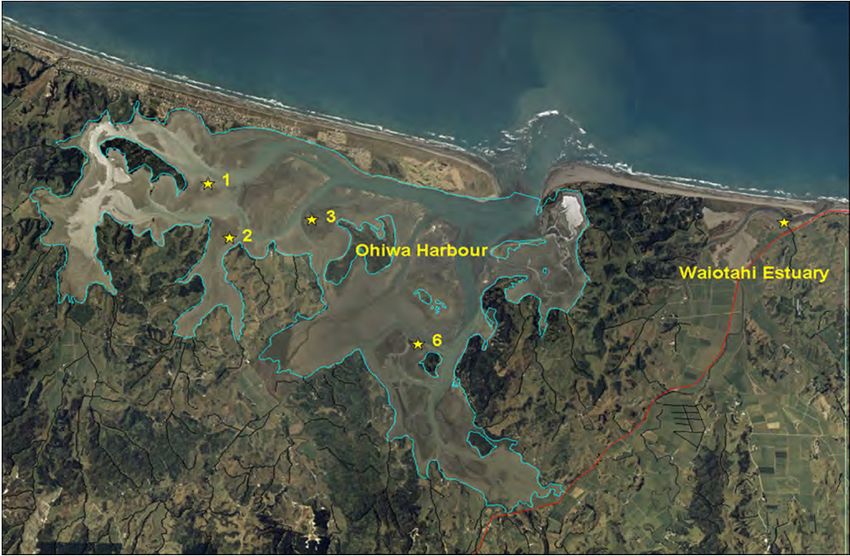
4.4 Macroinvertebrate Monitoring
Freshwater invertebrates consist of aquatic insects, snails, worms, and shrimp. The
different types of invertebrates found in streams and rivers can indicate a
waterway’s overall ecological condition. The advantage of monitoring these animals
is that they integrate both water quality and habitat conditions in a stream over time.
Invertebrate communities have been sampled from four waterways in the
Catchment: Nukuhou River, Kutarere and Wainui streams, and a small unnamed
tributary (hereafter called Ōhiwa Tributary) as part of Bay of Plenty Regional
Council's NERMN invertebrate monitoring programme (Figure 4.12).
Environmental Publication 2013/07 – State of the Ōhiwa Harbour and Catchment 21Figure 4.12 Location of four study streams within the Ōhiwa Harbour catchment.
Waterways within the Catchment were assessed using more than one method,
these are described below:
Freshwater Snail and Mayfly
Freshwater snail (Potamopyrgus) and the mayfly (Deleatidium), are particularly
common and widespread, the differences between their habitat requirements can
indicate stream health. The freshwater snail generally associated with organically
enriched streams and high algal biomass, are tolerant of the pressures associated
with land use changes (organic enrichment, high algal biomass, high sediment
loads, and high water temperature). In contrast, mayflies are associated with less
enriched streams with lower algal biomass, and are intolerant of pressures
associated with land use changes. These invertebrates have almost opposite habitat
requirements, and as stream health deteriorates, mayfly densities decrease and
freshwater snail densities increase.
Macroinvertebrate Community Index
The Macroinvertebrate Community Index (MCI) relies on the presence or absence of
invertebrates in a stream. It provides only a relatively coarse indication of stream
health. It is not particularly sensitive to changes in the relative abundance of
different taxa, which is arguably one of the first signs that a particular environment is
under stress. Scores can range from 20 to 200. Scores > 120 represent streams in
“excellent” condition, and scores < 60 indicate “highly degraded” streams.
Quantitative MCI
The quantitative MCI (QMCI) takes the relative abundance of each taxa into
consideration and can be used to better describe the health of a particular
waterway. QMCI scores range from 1 to 10. Streams with scores > 6 represent
streams in “excellent” condition, and streams with scores < 2 represent “highly
degraded” streams.
22 Environmental Publication 2013/07 – State of the Ōhiwa Harbour and CatchmentEPT
The number (number of different EPT taxa) and percentage (percentage of all
invertebrates that are EPT) of Ephemeroptera (mayflies), Plecoptera (stoneflies),
and Trichoptera (caddisflies) (EPT) taxa in a sample are two other commonly used
metrics to describe invertebrate communities. Many species of these insect groups
show reductions in density at sites affected by nutrient enrichment (subsequent algal
blooms), heavy metals and sedimentation loads.
Results
The four waterways support invertebrate communities typical of lowland streams
throughout the country. The relative abundance of freshwater snail was highest in
the Nukuhou River and Wainui stream, suggesting environmental conditions in
these streams have changed to the extent that sensitive taxa have decreased in
abundance. In contrast, the relative abundance of mayfly was highest in the
Kutarere Stream and the Ōhiwa tributary, suggesting environmental conditions in
these two streams are still suitable for these more sensitive taxa.
Average MCI scores of all streams were relatively high, placing them all in the
"good" water quality class (Table 4.2). Average QMCI scores show a much wider
range of stream health, with Ōhiwa tributary having an average QMCI score of 6.2,
placing it in the "excellent" water quality class, and Wainui Stream having an
average score of only 3.6, placing it in the "poor" water quality class. These
differences in the water quality class rankings of each stream highlight the
differences between the QMCI and the MCI. The relative abundance of
invertebrates indicative of good water quality was much reduced in the Wainui
Stream, shown by the lower number of EPT taxa (5) than in the other three streams,
as well as a lower percentage of EPT (12.9%). The Ōhiwa tributary had the highest
values of all four measures, suggesting it is in the best ecological condition of the
four streams.
Table 4.2 Average values of the MCI and QMCI, and the number and
percentage of EPT taxa.
Number of Percentage
Stream MCI QMCI
EPT taxa EPT taxa
Kutarere Stream 114.9 5.2 7.8 41.3
Wainui Stream 101.4 3.6 5.0 12.9
Ōhiwa Tributary 117.1 6.2 8.0 58.7
Nukuhou River 107.0 5.1 12.3 34.7
MCI scores in the Ōhiwa tributary increased significantly from 2002 to 2010
(Figure 4.13), whereas these scores fluctuated without pattern at the other three
sites. Calculated MCI scores from the Nukuhou River also fluctuated without pattern
over the time period (Figure 4.14).
Environmental Publication 2013/07 – State of the Ōhiwa Harbour and Catchment 23You can also read