Strategic Assessment of Risk 2020/21 - LFRS Strategic Assessment of Risk 2020/21 - Page | 1 - Lancashire Combined ...
←
→
Page content transcription
If your browser does not render page correctly, please read the page content below
LFRS Strategic Assessment of Risk 2020/21

    Strategic
Assessment of Risk
    2020/21

                                                 Page | 1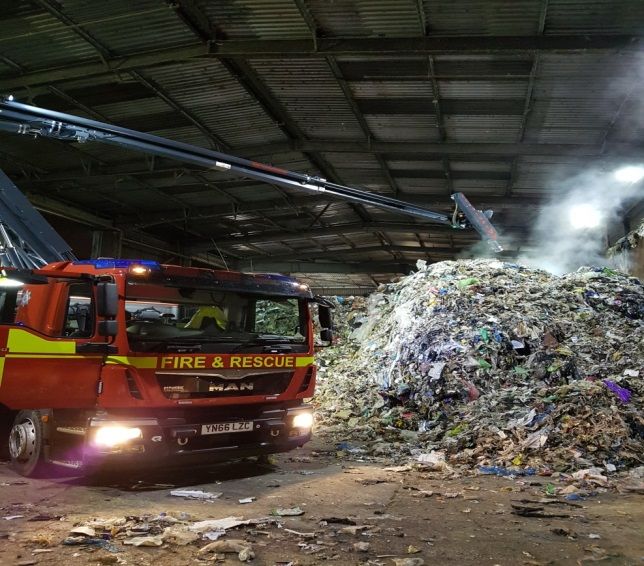
LFRS Strategic Assessment of Risk 2020/21

Contents
Version Control ..............................................................................................................................................................4
Executive Summary ......................................................................................................................................................5
1.     Combined Fire Authority.......................................................................................................................................8
2.     Population & Demographics ................................................................................................................................9
2.1.       Population...........................................................................................................................................................9
2.2.       Population Projections ....................................................................................................................................10
2.3.       Household Projections....................................................................................................................................11
2.4.       Cultural Diversity .............................................................................................................................................13
2.5.       Religion .............................................................................................................................................................14
2.6.       Workday Population ........................................................................................................................................14
2.7.       Ageing Population ...........................................................................................................................................15
2.8.       Deprivation .......................................................................................................................................................15
2.9.       Fuel Poverty .....................................................................................................................................................17
3.     Response Risk.....................................................................................................................................................19
3.1.       Fires in the home.............................................................................................................................................19
3.1.1.        Living Alone..................................................................................................................................................20
3.1.2.        High Rise Dwellings ....................................................................................................................................23
3.1.3.        HFSC’s..........................................................................................................................................................24
3.2.       Fires in Commercial Buildings .......................................................................................................................26
3.2.1.        Primary Authority Schemes .......................................................................................................................30
3.3.       Deliberate Fires ...............................................................................................................................................30
3.4.       False alarms.....................................................................................................................................................34
3.5.       Road Traffic Collisions....................................................................................................................................35
3.6.       Flooding ............................................................................................................................................................39
4.     Infrastructure Risk ...............................................................................................................................................42
4.1.       Road Networks ................................................................................................................................................42
4.2.       Rail & Tram Networks.....................................................................................................................................42
4.3.       Ports & Maritime ..............................................................................................................................................43
5.     Industry Risk ........................................................................................................................................................43
5.1.       BAE Systems ...................................................................................................................................................44
5.2.       COMAH & REPPIR Sites ...............................................................................................................................45
5.3.       Waste, Recycling and Scrap Sites................................................................................................................46
5.4.       Heritage ............................................................................................................................................................48
5.5.       Piers ..................................................................................................................................................................49

                                                                                                                                                                        Page | 2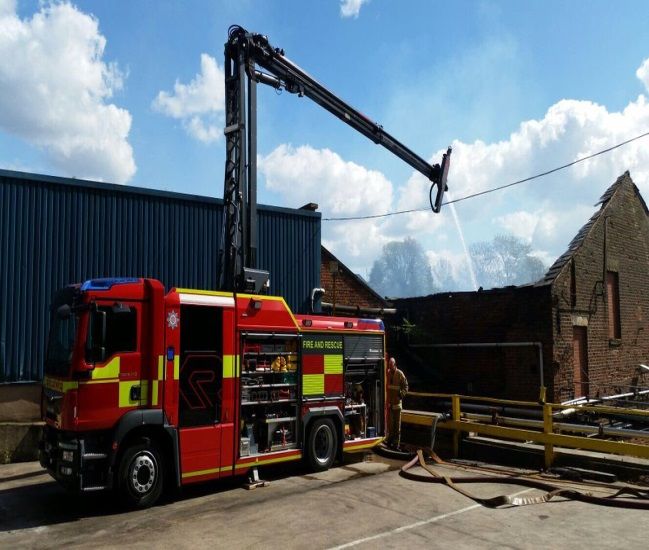
LFRS Strategic Assessment of Risk 2020/21
5.6. Lancaster University........................................................................................................................................50
6. Tourism .................................................................................................................................................................51
6.1. Tourism in Lancashire ....................................................................................................................................51
6.2. Blackpool Pleasure Beach .............................................................................................................................51
6.3. Blackpool Promenade.....................................................................................................................................51
6.4. Football Grounds .............................................................................................................................................52
7. Environmental Risk .............................................................................................................................................52
7.1. Lancashire Coastline and River Network.....................................................................................................52
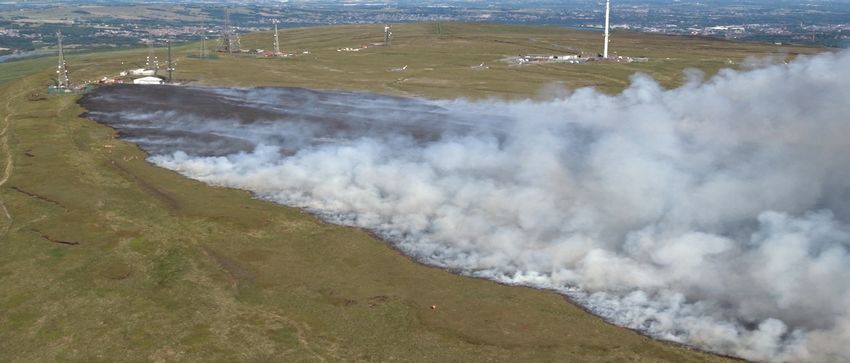
7.2. .Moorland..........................................................................................................................................................53
7.3. Reservoirs & Water Storage ..........................................................................................................................55
7.4. Wind Farms ......................................................................................................................................................56
7.5. Solar Energy ....................................................................................................................................................56
7.6. Fracking ............................................................................................................................................................57
7.7. Climate Change ...............................................................................................................................................57
8. Technological Risk ..............................................................................................................................................59
9. Organisational Risk .............................................................................................................................................60
9.1. Business Continuity.........................................................................................................................................60
9.2. The General Data Protection Regulation (GDPR) and the Data Protection Act 2018 (DPA2018)......60
10. National Risk ....................................................................................................................................................61
10.1. National Risk Assessment and National Risk Register .........................................................................61
10.2. Lancashire Resilience Forum ....................................................................................................................61
10.3. Brexit .............................................................................................................................................................62
10.4. Terrorism ......................................................................................................................................................63
11. Main Findings...................................................................................................................................................63
Page | 3
LFRS Strategic Assessment of Risk 2020/21

Version Control

Title:            Lancashire Fire and Rescue Service Strategic Assessment of Risk
                  2020/21
Version:          4.0
Author:           Strategic Policy, Planning and Programme Officer
Reviewers:        Senior Management Team
Contributors:     Knowledge and Information Management
Approval      for Director of Strategy and Planning
issue :
Issue Date:       April 1st 2020
Review Date:      September 1st 2020
Distribution:     Public Document – LFRS Internet site

                                                                                    Page | 4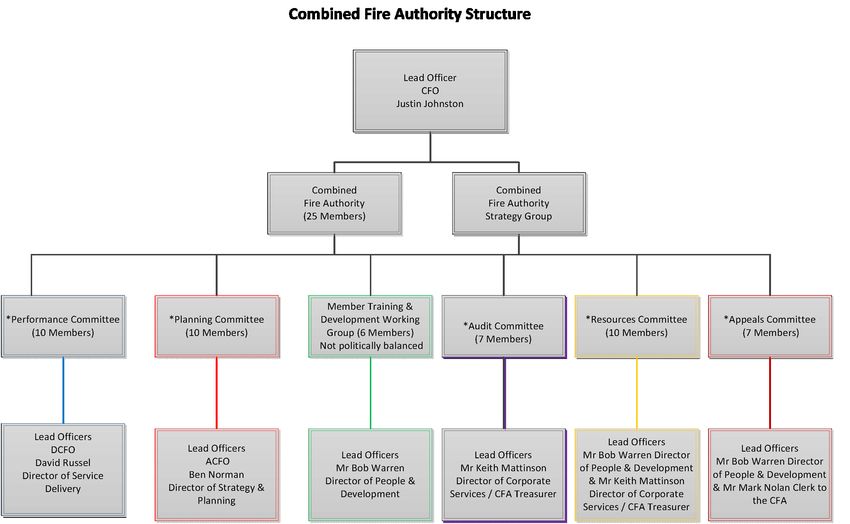
LFRS Strategic Assessment of Risk 2020/21

Executive Summary

This is the fourth edition of Lancashire Fire and Rescue Service’s (LFRS) ‘Strategic Assessment
of Risk’ (SAoR).

The assessment seeks to underpin our Integrated Risk Management Plan (IRMP) by ensuring that
risk management drives decision-making within LFRS.
Having firstly described the statutory responsibilities placed upon LFRS and the Combined Fire
Authority committee structure in chapter 1, the document then aims to provide depth of detail
across a number of areas of risk pertinent to the county of Lancashire.
Chapter 2 explores ‘population and demographics’. Information is provided on population density
across the 14 districts that make up Lancashire, in addition to clarification on aspects of ethnicity,
religion and work-day populations, particularly around the Preston area. The chapter highlights
the particular relevance of aspects of deprivation within Lancashire, not least the prevalence of
fuel poverty across an ageing population profile; one which statistically looks to continue to
increase significantly in age terms over the next fifteen years at least. The combination of such
factors poses risks to members of the communities we serve and hence it is incumbent upon us to
be aware of their changing needs and the potential for increased risk in areas traditionally seen as
low risk.
Chapter 3 considers ‘response risks’, initially in relation to the distribution of housing across
Lancashire by Council Tax band. It is interesting to note once again that by far Lancashire has
more housing falling into the lowest Council Tax band (Band A) than any other banding; 39.9%
compared with a national average of just less than 25%. This is considered alongside historic
data on accidental dwelling fires (fires in the home) and the correlation with such factors as lone
occupancy, pensionable age and parentage. The chapter also evaluates reductions seen in
commercial fires over the last ten years and considers our effectiveness in tackling deliberate fire
setting and in reducing unwanted false alarms.
The need for us to forge ahead with work streams relating to reducing road traffic collisions, road
deaths and injuries are documented by the use of KSI data (killed or seriously injured). Within this
section is a narrative on a more emergent risk to LFRS, that being our non-statutory response to
flooding incidents.
Chapter 4 broadens the study in relation to assessing risks arising from infrastructure such as
road, rail, tram, ports and airports. It considers the mitigating factors that exist in relation to our
response to incidents occurring at these locations.
Chapter 5 explores industry risk within Lancashire and considers both those sites that have
existing pre-planning arrangements in place (such as those covered by COMAH Regulations and
REPPIR Regulations) in addition to other areas of risk where LFRS conducts its own incident pre-
planning activities (examples being heritage sites and the piers of the Fylde coast).
                                                                                                   Page | 5
LFRS Strategic Assessment of Risk 2020/21

Chapter 6 covers the risks associated with tourism within Lancashire. It outlines our highest risk
area being Blackpool and the risks associated to this.
Chapter 7 deals with ‘environmental risks’. This section includes commentary on Lancashire’s
coastline, rivers, reservoirs and moorland areas. It also considers technological developments
such as the use of Fracking to extract shale gas and the broadening of solar energy and wind
farm installation use.
Chapter 8 considers technological risks, including the Emergency Services Mobile
Communications Programme (ESMCP), which will deliver a revolutionary new communications
system across the 3 emergency services. It represents a full overhaul of our communications
systems within North West Fire Control (NWFC), on fire appliances and for officers.
Chapter 9 provides a narrative on organisational risks of business continuity and the recent
changes to data protection legislation and considers how we are currently placed to respond to
these areas of risk.
Chapter 10 relates to national and regional risk factors. It considers the role of LFRS within
Lancashire Resilience Forum and the link from the group towards the maintenance of
Lancashire’s Community Risk Register. This section also considers the risks arising from
terrorism, our understanding and use of threat levels and the assets that we have in place to
mitigate and respond to any such occurrences.
Finally, chapter 11 draws together the main findings of the assessment to inform, as appropriate,
our Integrated Risk Management Plan, Corporate Risk Register, and annual planning activities for
the next few years.

                                                                                             Page | 6
LFRS Strategic Assessment of Risk 2020/21
Introduction
The Fire and Rescue National Framework identifies challenges that we have to deal with such as
the continued threat of terrorism, the impacts of climate change, impacts of an ageing population
and the need to cut the national deficit. In pursuit of our vision of ‘Making Lancashire Safer’, it is
important that these wider challenges are understood to help us plan to achieve our strategic
objectives in a more informed manner.
In order to address these challenges Lancashire Fire and Rescue Service (LFRS) carry out a
periodic assessment of risk to help us to consider the potential impact of external factors that may
be a risk to our business. Where we identify risks, we need to take action. This may be to
actively mitigate the risk or simply to monitor it, and indeed there may be risks that we choose to
accept and to take no action. Ultimately we must satisfy ourselves through this strategic
assessment of risk that there is no threat to our vision and that our strategic objectives are not
compromised.
As a Service we review our assessment of risk at least annually by analysing our external and
internal operating environments as part of our corporate planning process. This edition of
Lancashire’s Strategic Assessment of Risk (SAoR) document aims to highlight the risks we face
and describes how we intend to deal with them. The information is based on current and historical
risk data which is presented to inform our plans and strategies both now and in the future. This
SAOR underpins our corporate planning process and will strengthen our Integrated Risk
Management Plan (IRMP), which we have a statutory duty to provide. Whilst the IRMP
summarises how, through planning, we consider fire and rescue related dangers that could affect
our communities and how we aim to tackle them, the SAOR provides some of the detail on these
risks to give context to our corporate planning process.
The environment in which we operate is constantly changing and new risks to our communities
will always emerge. It is our job to ensure that we continually assess these changing risks and
ensure we keep the communities of Lancashire safe through our assessment of risk and
prioritising our response to those risks. In addition to our annual process we continue to analyse
any emerging opportunities and threats throughout the year through our normal risk management
processes.
Page | 7LFRS Strategic Assessment of Risk 2020/21
1. Combined Fire Authority
The Lancashire Combined Fire Authority (CFA) is responsible for leading and supporting
Lancashire Fire and Rescue Service. The CFA has a membership of 25 elected councillors
consisting of 19 from Lancashire County Council, 3 from Blackburn with Darwen Council and 3
from Blackpool Council. Under the Fire and Rescue Services Act 2004 the CFA is legally required
to enforce fire safety legislation and to reduce the risk of fire causing death, serious injury and
property related losses to the community. It must also make provision for rescuing people in the
event of road traffic collisions and for protecting people from serious harm arising from road traffic
collisions in the Lancashire area.
The CFA is legally responsible for the enforcement of the Regulatory Reform 2005 (Fire Safety)
Order which is applicable across England and Wales. This Order places the responsibility on
individuals within an organisation to carry out risk assessments to identify, manage and reduce
the risk of fire within public and commercial buildings.
The CFA is also a designated Category 1 responder under the Civil Contingencies Act 2004. This
Act requires emergency responders in England and Wales to co-operate in maintaining a public
Community Risk Register which is a product of the Lancashire Resilience Forum (LRF). The LRF
allows responders the opportunity to consult, collaborate and share information with each other in
order to facilitate planning and response to emergencies.
The CFA meets five times a year; with five sub committees which report back to the Authority,
meeting separately throughout the year. The CFA makes key strategic decisions including setting
the Council Tax precept, approving the budget requirement and reviewing items referred for a
decision by a sub-committee.
Page | 8LFRS Strategic Assessment of Risk 2020/21
2. Population & Demographics
2.1. Population
As a county, Lancashire comprises 14 authority areas; within this there are 12 district councils in
the Lancashire County Council area and two unitary authorities of Blackburn with Darwen, and
Blackpool. As a whole, the usual resident population for Lancashire according to the 2011 Census
was 1,460,900, this shows a growth in population of 3.3% or 46,200 people since the last Census
in 2001.
The table below shows the population in the Lancashire 14 area’s according to the 2011 census,
this highlights that Blackburn with Darwen has the largest population of the 14 authorities
(147,500) and the Ribble Valley is home to the smallest population (57,100).
Age band:
District Total
0-14 15-24 25-44 45-64 65+
Burnley 16,000 11,100 22,700 22,900 14,200 87,000
Chorley 18,300 12,200 28,600 30,200 17,900 107,200
Fylde 11,200 7,500 16,700 22,100 18,300 75,800
Hyndburn 15,400 10,300 21,700 20,600 12,900 80,700
Lancaster 21,400 24,500 32,400 34,900 25,300 138,400
Pendle 17,300 11,200 23,700 23,000 14,400 89,500
Preston 25,100 24,600 38,900 32,400 19,200 140,200
Ribble Valley 9,800 6,300 12,600 17,100 11,600 57,100
Rossendale 12,300 8,200 17,900 19,100 10,500 68,000
South Ribble 18,600 12,800 28,100 30,100 19,300 109,100
West Lancashire 18,600 14,900 25,200 31,100 20,900 110,700
Wyre 16,000 12,000 22,600 30,700 26,600 107,700
Lancashire
County (12 200,100 155,500 290,700 314,100 211,300 1,171,300
districts)
Blackburn with
32,100 19,900 41,800 34,600 19,100 147,500
Darwen
Blackpool 23,700 17,100 35,500 38,400 27,100 142,100
Lancashire (14
255,900 192,500 368,000 387,100 257,500 1,460,900
authorities)
When comparing the 14 districts of Lancashire to the national averages for England and Wales,
the statistics show a higher proportion of people living in Lancashire in the two oldest broad age
Page | 9LFRS Strategic Assessment of Risk 2020/21
groups of 45-64 year-olds and 65+1.
Analysis by age shows that, for the next eight years, the number of children aged 0 to 14 will rise
and thereafter the number will decline. The working age population is predicted to start to decline
within 5 years and the older population are predicted to continue to increase, with more in the 65
and over bracket each year as life expectancy increases over the period. The old age dependency
ratio (number of people on state pension per 1,000 people of working age, is predicted to increase
in every district over the period of the projection, with Fylde seeing the largest increase (496 in
2016 to 685 in 2041).
2.2.Population Projections
The latest population projections cover the period from 2016 to 2041 and are supplied as
unrounded single year of age counts for females, males and persons. The results are available
for the 14 Lancashire local authorities and the eight clinical commissioning groups that cover the
county.
For the Lancashire-14 area, a 2.4% increase is projected over the 25-year period, resulting in an
expected population total of 1.514 million by 2041. For the Lancashire-12 area, the percentage
increase is projected to be higher at 3.5%, with the number expected to reach 1.23 million. These
increases have been revised down from the previous projections. The estimated increases for
both areas are lower than the average for the North West, 6.4% as a whole, and well below the
expected increase for England of 12.1%.
In contrast to the national trend, Blackburn with Darwen, Blackpool, Burnley, Hyndburn, Pendle
and Preston, are predicted to see small population decreases between 2016 and 2041. Chorley is
the only Lancashire authority with a projected increase higher than the North West or England
average.
Analysis by age shows that, for the next eight years, the number of children aged 0 to 15 will rise
and thereafter the number will decline. The working age population is predicted to start to decline
within 5 years and the older population are predicted to continue to increase, with more in the 85
and over bracket each year as life expectancy increases over the period. The old age dependency
ratio (number of people on state pension per 1,000 people of working age, is predicted to increase
in every district over the period of the projection, with Fylde seeing the largest increase (496 in
2016 to 685 in 20412
1http://www.lancashire.gov.uk/lancashire-insight/population-and-households
2 https://www.lancashire.gov.uk/lancashire-insight/population-and-households/population/population-projections/
Page | 10LFRS Strategic Assessment of Risk 2020/21
2.3.Household Projections
Household numbers in the Lancashire-12 area are projected to grow from an estimated 507,980 in
2016, to 551,312 by 2041, an increase of 8.5% (+43,332 households). This is significantly lower
than the England growth rate of 17.3%.
Within the Lancashire-12 area, Chorley (+11,194, 23.2%), Fylde (+5,676, 15.5%) and Wyre
(+5,510, 11.4%) are estimated to see the largest numeric increases in the area, although Ribble
Valley (+3,113, 12.3%) and Rossendale (+3,453, 11.5%) are also projected to see percentage
increases above 10.0%. Locally, only Chorley's percentage rise is estimated to be greater than the
England average of 17.3%. Hyndburn (+700, 2.0%) and Preston (+1,342, 2.3%) are projected to
see the lowest percentage growth in the Lancashire-12 area.
In the broader Lancashire-14 area, the number of households in Blackburn with Darwen is
estimated to increase by 4.0% (+2,264 households), whilst in Blackpool the percentage
increase of just 0.4% (+232 households) is the fourth lowest in England. Nine Lancashire-14 areas
have some of the lowest estimated percentage increases in England by 2041, of 7.3% or
lower. Overall, the number of households in the Lancashire-14 area is estimated to rise by 7.3%
(+45,829) to 674,107 households by 2041.
Average household size
By 2041, in the Lancashire-12 area, the average household size is predicted to reduce from 2.3 to
2.18 people. For the Lancashire-14 area, a decrease is also projected, from 2.31 to 2.19 people.
In England, the average household size is estimated to fall from 2.37 to 2.26 people.
Households aged 65 and over
Nationally, the percentage of households aged 65 and over is estimated to rise from 28.3% of the
total in 2016, to 37.2% in 2041. In the Lancashire-12 area, the percentage is estimated to increase
from 31.1% (158,154 households) to 41.3% (227,682 households) by 2041. Fylde (50.6%), Wyre
(49.9%) and Ribble Valley (47.6%) are projected to have some of the highest percentages of
households aged 65 and over in the country by 2041.
Household composition
One person households in the Lancashire-12 area are projected to rise by 17.9% to 193,978
households, or 35.2% of all households, by 2041, slightly higher than the England projected
average of 33.1%. Fylde (40.3%), Preston (39.2%), Hyndburn (37.9%), Burnley (37.8%) and
Pendle (37.2%) are projected to have some of the largest percentages of one person households
in England in 2041. Blackpool (41.3%), in the Lancashire-14 area, is projected to have the sixth
Page | 11LFRS Strategic Assessment of Risk 2020/21
highest percentage of one person households in England (out of 326 local authority areas).
Households with dependent children in the Lancashire-12 area are predicted to fall by 7.7%
(10,315 households) to 124,145 households, or 22.5% of all households, in 2041, lower than the
projected England average of 24.7%. In the Lancashire-14 area, only Blackburn with Darwen
(28.8%) is projected to have a percentage of households with depended children that is above the
England average. Households with dependent children in the Lancashire-12 area are therefore
predicted to form a smaller proportion of all households in 2041 (22.5%) compared with 2016
(26.5%), as would be expected from an ageing population.
Other households with two or more adults in the Lancashire-12 area are projected to increase by
11.6% (24,198 households), to 233,188 households (or 42.3% of all households) in 2041. In
England, other households with two or more adults are projected to rise by 21.0% (1,971,391
households), to 42.2% of all households in 2041. The percentages for Preston (36.8%) and
Hyndburn (37.7%) are projected to be the ninth and eighteenth lowest (out of 326 local authority
areas) for other households with two or more adults in England in 2041. The percentages for
Pendle (38.5%) and Burnley are projected to be in the lowest 11% of the rankings for this
household type.
Chorley is forecast to see the largest numeric and percentage increases for one person
households (+5,004 households, 35.5%) and other households with two or more adults (+5,527
households, 26.8%) in the Lancashire-14 area by 2041. For households with dependent children,
only Chorley is predicted to see an increase between 2016 and 2041 in the Lancashire-14 area,
rising by 664 households (4.9%). Despite the increase, the proportion of households with
dependent children as a percentage of all households in Chorley is projected to fall from 28.0% in
2016, to 23.8% in 20413
3https://www.lancashire.gov.uk/lancashire-insight/population-and-households/households-and-housing/household-
projections/
Page | 12LFRS Strategic Assessment of Risk 2020/21
2.4.Cultural Diversity
The usual resident population of the Lancashire-14 area was 1,460,893 in the 2011 Census. The
largest ethnic group was white (90%). The black and minority ethnic (BME) group formed 10% of
the population. Numerically, there were almost 141,000 black and minority ethnic people in the
area.
The usual resident population of the Lancashire-12 area was 1,171,339. The largest ethnic group
was white (92%). The black and minority ethnic group made up 8% of the population. Numerically,
there were over 90,000 black and minority ethnic people in the county.
Within Lancashire-12, Pendle and Preston had one in five people (20%) who were black or
minority ethnic. In Burnley and Hyndburn the rate was 12%. In Rossendale, whilst the percentage
of BME was lower than in these four districts, it was still above the rate of other districts at 6%.
Similarly in Lancaster the BME population was just over 4%.
The numbers of people who are BME were by far the greatest in Preston, where there were
almost 28,000. In Pendle there was a BME population of 18,000. A further 11,000 and 10,000
BME people live in Burnley and Hyndburn respectively.
Numbers were lower, but remain of note, in Lancaster (6,000) and Rossendale (4,200). Chorley
and South Ribble had just over 3,000 BME people each.
Together there were almost 67,000 BME people in Preston, Pendle, Burnley and Hyndburn.
These 67,000 people were three-quarters of the Lancashire-12 area's BME population, whereas
the total population of these districts makes-up a third of the total Lancashire-12 population.
In Blackburn with Darwen almost 70% of the population was white. The proportion of the
population who are BME, at 31%, was by far the highest in the Lancashire-14 area. The rate was
three times greater than for Lancashire-14 and regional averages. Almost 45,500 people in
Blackburn with Darwen were in the BME category.
In contrast, in Blackpool the BME population was low at just under 5,000, accounting for just over
3% of the population.
Asian/Asian British was the largest minority ethnic group in both Lancashire-12 and Lancashire-
14. In Lancashire-14, there were almost 115,000 Asian/Asian British people, and just over 71,000
in Lancashire-12. It should be noted that this group now includes Chinese people, whereas in
2001 they were in the "other" ethnic group.
The second largest minority ethnic group was mixed race. There were 16,300 mixed race people
across Lancashire-14 and almost 13,000 mixed race people lived in Lancashire-12. The
black/black British population numbered 5,377 in Lancashire-14, and just over 4,000 in
Lancashire-12.4
4https://www.lancashire.gov.uk/lancashire-insight/population-and-households/population-and-households-2011-
census/population-by-ethnicity/
Page | 13LFRS Strategic Assessment of Risk 2020/21
2.5.Religion
On the day of the census, March 2011, a total of over 978,000 people classified themselves in the
Lancashire-14 area as Christian. A further 279,600 stated no religion, 96,600 indicated that their
religion was Muslim, 71,300 did not give a response, whist the other religious groups in
Lancashire-14 together accounted for 17,400
Among the local authorities in Lancashire, the 78.1% of people in Ribble Valley who state that
they are Christian was the fourth highest rate out of 348 authorities across England and Wales.
West Lancashire, South Ribble and Chorley were also ranked in the top 10 across the country.
Blackburn with Darwen (27.0%) and Pendle (17.4%) had high rates of Muslims. The Blackburn
with Darwen rate was the third highest in England and Wales.
The Lancashire area has well below the national average for people stating no religion. Lancaster,
Rossendale and Blackpool were the only Lancashire areas with rates approaching the national
average of 25.1%.
Among the other religions, Preston (2.4%) had well above the national average of Hindus, and the
largest percentage of Sikhs (0.7%) in Lancashire-14. 5
2.6.Workday Population
The 2011 census recorded the usual resident population of the Lancashire-12 area was 1,171,339
and the corresponding figure for Lancashire-14 was 1,460,893. The workday population figures for
these areas were lower, at 1,149,207 and 1,444,612 respectively. In terms of proportions this
means that Lancashire-12 had a workday population 1.9% lower than the usual resident
population. The figure for Lancashire-14 was lower, but only by 1.1%, suggesting that Lancashire-
14 was a more self-contained area than Lancashire-12.
The workday population in Preston was 14% higher than the usual resident population. An
additional 23,000 people are in Preston local authority area on a workday. In Fylde the workday
population was 10% higher than the usual resident population. An additional 8,400 people are in
the area on a workday. In Ribble Valley the workday population was only a little higher than the
usual resident population (2%), suggesting that a high number of usual residents go to work
elsewhere.
The workday population was almost 3% higher than the usual resident population in Blackburn
with Darwen. In Blackpool it was 1% higher.
In the remaining nine local authority areas the workday populations were lower than the usual
resident populations. Most notably, they were 14% lower in Rossendale, 13% lower in Chorley
and 11% lower in Wyre. Although some non-residents will be travelling to work in these locations,
a higher number of residents are travelling out to work in other places.
5https://www.lancashire.gov.uk/lancashire-insight/population-and-households/population-and-households-2011-
census/religion/
Page | 14LFRS Strategic Assessment of Risk 2020/21
In Burnley the workday population was only very slightly lower than the usual resident number,
suggesting that many people both live and work locally.6
2.7.Ageing Population
Future population predictions for the Lancashire 14 Authority areas show that growth rates across
the county are expected to have distinct differences. Chorley, Lancaster, Fylde and Rossendale
are predicted to have the highest growth rates in population whereas in comparison Blackpool,
Blackburn with Darwen, Burnley and Hyndburn are expected to have a population decrease
When carrying out further comparisons with predicted population levels by age group, one
category that is expected to substantially increase across the county is that of those aged 65+.
Statistics show that there are significant increases in predicted population groups over the age of
65 that become greater still as the age range increases. This culminates with the oldest age group
(90+) being predicted to rise by 121% across the county over the next 16 years.
Response:
This growing number of people aged over 65 and above present’s significant challenges not only
for LFRS, but also for our partners as demand increases for services. To address this LFRS works
collaboratively with partners to identify and support the most vulnerable individuals within our
communities. At a community level delivering a joined up service with our partners ensures the
most effective assessment of need is undertaken.
In addition, other work streams are ongoing to help reduce risk amongst this group of vulnerable
people in Lancashire. Lancashire Constabulary has seen a significant increase in missing
persons; which relate to some of the most vulnerable people in society. This has resulted in a
greater demand across public sector agencies in the search and location of vulnerable missing
persons. Our prevention departments have been leading on Dementia Friends training, improving
knowledge and understanding of staff, resulting in better outcomes.
2.8.Deprivation
Deprivation is measured across England through the combined Index of Multiple Deprivation 2015
(IMD 2015) which is the official measure of relative deprivation for small areas known as Lower
Level Super Output Areas (LSOAs) in England.
The English Indices of Deprivation are based on separate indicators which are organised across
seven distinct domains:
Income Deprivation;
Employment Deprivation;
6 https://www.lancashire.gov.uk/media/897591/census-2011-workday-populations.pdf
Page | 15LFRS Strategic Assessment of Risk 2020/21
Health Deprivation and Disability;
Education, Skills and Training Deprivation;
Barriers to Housing and Services;
Crime;
Living Environment Deprivation
The Lancashire-12 area is ranked 87, out of 152 upper tier local authorities which puts the county
in the middle ground (3rd quintile, 57%), where one is the most deprived. The lowest ranking for
the domains is 46 for health and disability and highest is 136 for barriers to housing and services.
This hasn't changed significantly from the 2010 IMD.
Burnley is the most deprived district within the Lancashire-12 area, with a rank of average rank of
17, where one is the most deprived and 326 is the least. Hyndburn (28th) and Pendle (42nd) are
also in the top 20% most deprived authority areas in the country. Ribble Valley (290th) is the only
district within the top 20% least deprived authority areas in the country. Health deprivation and
disability is an area in which the county does particularly poorly. Burnley is ranked six and
Hyndburn seventh most deprived on this indicator.
Of the two Lancashire unitary authorities, Blackpool recorded a notably low position of fourth place
on the rank of average rank, whilst Blackburn with Darwen was in 24th position.
The 2015 figures reveal that seven local authorities in the Lancashire-14 area; Blackpool, Burnley,
Blackburn with Darwen, Hyndburn, Pendle, Lancaster and Preston; had at least one of their eight
local authority deprivation summary measures ranked in the 50 most deprived positions. This was
up from six authorities in the previous 2010 indices. Lancaster became the seventh owing to a
relative deterioration of its local concentration ranking.
Between 2010 and 2015, the indices of deprivation results indicate a continuing trend of growing
disparities between the most and least deprived areas of the county. There has also been,
however, a mixture of favourable and less favourable results in Lancashire.
Blackpool, Burnley, Blackburn with Darwen and Hyndburn each had six of their eight local
authority summary measures ranked in the 50 most deprived positions within England. Pendle
had three, and Lancaster and Preston each had one. Preston, which has improved in six of its
relative deprivation rankings, remained as one of the most deprived 50 local authorities, owing to
its extent of deprivation ranking (46th).
Blackpool had the most deprived rankings in the Lancashire-14 area for all eight of the local
authority summary measures. The authority also had the top most deprived rankings (1st in
England) for the rank of average score measure and the rank of local concentration measure. This
latter measure identifies 'hot spots' of very high levels of deprivation.
Only Ribble Valley and South Ribble had rankings that fell wholly within the least deprived 50% of
local authorities.
The six authorities of Blackpool (12), Blackburn with Darwen (13), Burnley (16), Hyndburn (24),
Pendle (31) and Preston (46) all had rankings within the 50 most deprived positions on the extent
of deprivation measure.
Besides Preston recording relative improvement to six of its local authority summary measure
Page | 16LFRS Strategic Assessment of Risk 2020/21
rankings, Pendle, South Ribble, Chorley, West Lancashire and Rossendale also recorded some
notable improvements to the majority, or some of their respective local authority domain rankings,
in relative terms, compared to other local authorities.
By contrast, Wyre, Lancaster and Fylde districts have all recorded some marked deterioration to
at least three of their respective local authority domain rankings, in relative terms, but notably, the
rank of local concentration measure7
2.9.Fuel Poverty
A household is considered to be fuel poor if it has higher than typical energy costs and would be
left with a disposable income below the poverty line if it met those energy costs.
The 2017 fuel poverty statistics indicate that 13.5% of households (87,412) were fuel poor in the
Lancashire-14 area, and 12.6% (65,730) in the Lancashire-12 area; both are higher than the
England average (10.9%). The Lancashire-14 proportion has increased by 0.6% from 2016 and
the gap between Lancashire-14 and England has also widened from 1.8% to 2.6%.
Blackpool (17.5%), Pendle (17.3%), Blackburn with Darwen (16.5%), Burnley (16.4%), Hyndburn
(15.4%), Preston (15.1%) and Lancaster (13.6%) were in the worst 20% of local authorities in
England for fuel poverty. South Ribble had the lowest proportion of fuel poor households (9.5%).
Blackpool had the largest number of households who were fuel poor (11,787) in the Lancashire-14
area. In the Lancashire-12 area, Preston had the largest number of fuel poor households (9,079).
Ribble Valley had the fewest fuel poor households (2,562).
The relative nature of the fuel poverty indicator makes it difficult to isolate accurately the absolute
reason for change. The fuel poverty status of a household depends on the interaction between
three key drivers: household incomes, fuel poverty energy efficiency ratings (FPEER) and
required fuel costs. Factors that affect this are quality of the dwelling eg. insulated or not, age of
dwelling, tenure type and household composition. The highest prevalence of fuel poverty is seen
for lone parents with dependent children in England (25.4%) in 2017.8
Response:
Fuel poverty can lead to a range of adverse effects from health issues including a rise in winter
deaths which may be attributed to people living in cold unheated homes, to an increase in fire risk
from people using what are deemed to be unsafe forms of heating (which are often poorly
manufactured) or from counterfeit electrical products.
LFRS continues to develop its preventative activities which look to improve our community’s
health and wellbeing to keep them safer in their homes.
The service has implemented an extension to the Home Fire Safety Check visit for those whom
are at higher risk. This is known as a ‘Safe and Well’ visit. The Safe and Well visit aims to reduce
Fire and Health risks amongst higher risk members of the public. If our staff identify any health
related concerns then we will contact partner agencies such as the Alzheimer’s society for them to
7 https://www.lancashire.gov.uk/lancashire-insight/deprivation/indices-of-deprivation-2015/
8 https://www.lancashire.gov.uk/lancashire-insight/deprivation/fuel-poverty/
Page | 17LFRS Strategic Assessment of Risk 2020/21
put pathways in place for the individual.
With regards to fuel poverty, LFRS runs an annual winter safety campaign which aims to help
those who are most vulnerable to fuel poverty in our communities. Individuals who are deemed at
high risk are offered a free Home Fire Safety Check and through our continued work with our
partners we run a variety of local campaigns designed to target those specific groups.
Page | 18LFRS Strategic Assessment of Risk 2020/21
3. Response Risk
3.1.Fires in the home
The 12 Lancashire authorities together had a combined dwelling stock figure of 544,350 in March 2018,
which represented 2.3% of the total for England. Numbers in each of the Lancashire-14 authorities ranged
from a high of 71,440 in Blackpool to 26,660 in Ribble Valley.
Analysis by council tax band shows that over 60% of dwellings in Burnley and Pendle were in the lowest
band 'A' (England = 24.4%). The highest tax bands of 'F' to 'H' accounted for 9.2% of properties in England
but just 1.2% in Blackpool, Burnley and Hyndburn. In Ribble Valley and Fylde however the proportions
were 16.5% and 11.1% respectively.
Whilst the presence of additional housing does increase fire risk, the compulsory fitting of smoke
alarms in all new build houses is in place to mitigate the risk by giving early warning to the
occupants. 9
The below graph highlights that the number of accidental dwelling fires that LFRS have attended
between the dates of 1st April 2009 to 31st March 2019 has seen a reduction of 34% (Accidental
Dwelling Fires KPI 1.3)10
Total accidental dwelling fires by fiscal year
Accidental Dwelling Fires (KPI 1.3)
1400
1200
1000
800
600
400
200
0
2009/10 2010/11 2011/12 2012/13 2013/14 2014/15 2015/16 2016/17 2017/18 2018/19
9 https://www.lancashire.gov.uk/lancashire-insight/population-and-households/households-and-housing/dwelling-stock-by-
council-tax-band/
10 LFRS IRS
Page | 19LFRS Strategic Assessment of Risk 2020/21
The following chart shows accidental dwelling fires attended by LFRS from 1st April 2009 to 31st
March 2019 broken down by district level. This highlights that over a 10 year period the highest
number of accident dwelling fires occurred within the Blackpool area, whilst in comparison the
lowest number of accidental dwelling fires occurred within the Ribble Valley.
2009/10
2010/11
2011/12
2012/13
2013/14
2014/15
2015/16
2016/17
2017/18
2018/19
Total
District
Blackburn with 103 123 118 107 87 71 113 90 97 80 989
Darwen
Blackpool 217 185 190 183 159 155 148 142 128 135 1642
Burnley 91 79 73 64 65 72 57 66 61 57 685
Chorley 59 63 59 55 69 55 43 49 45 41 538
Fylde 36 54 34 28 41 31 29 35 42 33 363
Hyndburn 94 76 68 63 57 50 52 65 63 52 640
Lancaster 107 101 99 90 100 95 96 81 105 78 952
Pendle 58 85 86 64 52 55 63 43 59 54 619
Preston 137 138 145 110 105 98 108 74 112 84 1111
Ribble Valley 49 22 27 22 22 23 26 26 32 32 281
Rossendale 56 45 46 30 36 27 32 31 34 29 366
South Ribble 69 48 47 47 46 57 52 58 46 38 508
West Lancashire 93 79 64 61 62 57 64 40 50 49 619
Wyre 70 65 64 59 62 50 58 49 69 53 599
Total 1239 1163 1120 983 963 896 941 849 943 815 9912
Historical statistics show that the more affluent an area is, the fewer ADFs have occurred.
However, this trend needs to be monitored as change may be imminent due to the increase in
ageing population levels.
Response:
LFRS periodically undertake reviews to take a considered look at the emergency cover we
provide in terms of where our fire engines, equipment and crews are situated. This ensures that
the effects of changes through new large scale developments are considered, so that we can
continue to provide an effective level of emergency response.
Whilst the impact any fire can be devastating, it is to be reputed that the prevention activities that
LFRS have delivered across Lancashire over the last 10 years, has played a significant part in the
reduction of accidental dwelling fires.
3.1.1. Living Alone
The 2011 census recorded that across the 14 Lancashire Districts there were 81,759 (13.2%) of
households with an adult living alone aged 65 or over; this is above both the North West average
Page | 20LFRS Strategic Assessment of Risk 2020/21
(12.8%) and the England and Wales average of 12.4%. Out of the 348 local authorities in England
and Wales, Fylde was recorded as the 12th highest authority with a percentage of 16.9% followed
by Wyre at 19th highest with 16.4%11.
In comparison Blackburn with Darwen recorded the lowest percentage of households with one
person living alone aged 65 or over within the Lancashire 14 area, at 10.9%, followed by Preston,
Rossendale and Chorley at 11.4%, 11.6% and 11.8% respectively.
Living alone may not necessarily affect an individual’s fire risk; however living alone combined
with specific demographic characteristics can do so. Age, mental health, physical wellbeing and
living environments can all play a part in contributing to an individual’s circumstances for them to
be considered at a higher risk of death or injury caused by fire.
When looking at fire risk the chart12 below shows the total number of Accidental Dwelling Fire’s
(ADFs) recorded against occupancy type.
2009/10
2010/11
2011/12
2012/13
2013/14
2014/15
2015/16
2016/17
2017/18
2018/19
Occupancy type Total
Lone person over
220 228 245 200 198 170 196 179 229 180 2045
pensionable age
Lone person
under 318 266 241 213 186 188 183 162 193 138 2088
pensionable age
Person not
recorded as ‘lone 703 670 634 571 582 538 562 509 522 497 5788
person’
Total 1241 1164 1120 984 966 896 941 850 944 815 9921
The data highlights that 42% of ADF’s which occurred within a dwelling had a lone occupier. This
data is broken down further in the graph below which highlights all recorded occupancy types.
11http://www.lancashire.gov.uk/media/897533/census-2011-one-person-households.pdf
12Information Recording System(IRS)
Page | 21LFRS Strategic Assessment of Risk 2020/21
350
Lone person over pensionable
age
300
Lone person under pensionable
age
250 Lone parent with dependant
child/ren
200 Couple one or more over
pensionable age, no child/ren
3 or more adults under
150 pensionable age, no child/ren
3 or more adults with
100 dependant child/ren
Couple both under pensionable
age with no children
50
Couple with dependant
child/ren
0
Not known
0
1
2
3
4
5
6
7
8
9
/1
/1
/1
/1
/1
/1
/1
/1
/1
/1
09
10
11
12
13
14
15
16
17
18
20
20
20
20
20
20
20
20
20
20
At present those living alone over pensionable age fall in the highest category for accidental
dwelling fires. Predicted populations levels show that by 2035 Lancashire will have 19% more
adults living alone within the 65-74 year old age bracket than in 2017 and 60.9% more adults
living alone in the 75+ age bracket, making it likely that this category will continue to increase
(based on professional judgement). A sudden change in circumstances for older people who may
experience the death of a partner or loved one can not only place them at risk of social isolation
due to a lack of social interaction with friends and family but also increases their risk of fire due to
a change in their living circumstances.
The following chart highlights the total number of fire related fatalities that have occurred over a
ten year period (1st April 2009 – 31st March 2019), by age band within Lancashire13.
10- 20- 30- 40- 50- 60- 70- 80-
Year 0-9 19 29 39 49 59 69 79 89 90+ Total
2009/2010 2 1 1 2 1 7
2010/2011 2 2 3 7
2011/2012 1 1 1 3 6
2012/2013 1 1 2 1 1 6
2013/2014 1 2 1 4
2014/2015 1 1 1 1 4
2015/2016 1 1 2 1 1 6
2016/2017 1 1 1 3
2017/2018 1 2 3 6
2018/2019 1 1 4 1 1 8
Total 0 2 1 2 8 4 7 13 14 6 57
13 Incident Recording System
Page | 22LFRS Strategic Assessment of Risk 2020/21
This reveals that of the 57 fire related fatalities that occurred within a 10 year period, 70% of
victims were aged 60 or older.
When analysing the data further, the statistics below show that of the 57 fire related fatalities that
occurred over the period of 1st April 2009 – 31st March 2019*, 47.4% of fatalities were of a lone
person over pensionable age, with 75.5% of all fatalities involving a lone person.
(*Data not available pre-IRS recording)
Lone person Lone person
Total Lone
over under Total
person
pensionable pensionable Fatalities
Fatalities
Year age age
2009/2010 3 3 6 7
2010/2011 5 2 7 7
2011/2012 4 1 5 6
2012/2013 3 2 5 6
2013/2014 1 2 3 4
2014/2015 1 1 2 4
2015/2016 2 3 5 6
2016/2017 0 0 0 3
2017/2018 4 1 5 6
2018/2019 4 1 5 8
Total 27 16 43 57
3.1.2. High Rise Dwellings
The Grenfell Tower fire occurred on 14 June 2017 claiming the lives of 72 people at the North
Kensington tower block. Over 70 others were injured and 223 people escaped. It is the deadliest
structural fire in the United Kingdom since the 1988 Piper Alpha disaster and the worst UK
residential fire since the Second World War. The fire is currently subject to a public inquiry, police
investigation and coroner’s inquests.
Building regulations are currently under review in the light of the fire due to concerns with the rules
and their enforcement and concern has spread to fire safety issues with many other buildings.
On 30 August 2017, the Department for Communities and Local Government published the terms
of reference for the Independent Review of Building Regulations and Fire Safety. This
independent review was led by Dame Judith Hackitt, who is a senior engineer and civil servant
with experience as the Chair of the Health and Safety Executive. The two main aims of the review
are firstly to develop improved building regulations for the future, with a focus on residential high-
rise blocks, and secondly to provide reassurance to residents that their homes are safe.
On 18 December 2017, Hackitt published her initial report. She described the entire building
regulatory system as "not fit for purpose" and made interim recommendations for significant
change. The final report was published on 17 May 2018, outlining a number of key failings and
recommendations. Recommendations will be reconsidered after the conclusion of the public
Page | 23LFRS Strategic Assessment of Risk 2020/21
inquiry.
Currently running parallel to the Hackitt review is the Industry Response Group (IRG) that is
tasked with assuring competence across the sector of those involved with high rise building. This
ranges from product procurement (cladding, building materials etc.) to architects and designers to
fire safety officers. There is a wide range of working groups to analyse the competencies of each
area.
Response:
Lancashire Fire and Rescue Service (LFRS) Protection department has undertaken a review of all
high rise premises within the county. All buildings were inspected and fire safety advice given
where required. Three buildings in Lancashire were identified with similar ‘ACM’ cladding to the
Grenfell Tower but all 3 are under 18m and not included as part of government high-rise
inspection programme. However, fire safety staff have inspected these buildings regardless. In
respect of identified high rise buildings in Lancashire, all are part of the service delivery
preparedness activities, which includes a 72d inspection, which in a practical sense is a site
specific risk assessment.
3.1.3. HFSC’s
The Home Fire Safety Check Service (HFSC) is LFRS’s primary preventative action; it is a free
service to all members of the public and is delivered throughout Lancashire. Historically the HFSC
was developed to deliver fire safety advice to the public within their homes; this core preventative
activity coupled with the LFRS brand image has enabled our staff to deliver a service to some of
the most vulnerable individuals within the community.
Since 2001, LFRS has delivered almost 535,000 HFSC’s, with advice being given through a
tailored risk assessment process. In October 2015 a change to the approach of the HFSC service
was implemented to ensure that those who are most vulnerable to fire within the community
receive an enhanced level of advice and service.
Risk is calculated through a comprehensive risk assessment process carried out either via our
website or by our Contact Centre, which has been established by the Service so that all calls for
HFSC requests are dealt with by trained staff. Following the assessment, appointments are made
for those referrals assessed as high risk, and LFRS personnel will then visit the property to give
targeted support and advice to those deemed most vulnerable from death or injury caused by fire.
If however a referral is deemed to be low risk, we will issue tailored fire safety advice specific to
the individual needs of the service user via email or post.
The chart below highlights HFSC visits undertaken since our revised approach was implemented
and gives an indication of the split between high and not high risk referrals.
Page | 24LFRS Strategic Assessment of Risk 2020/21
Completed HFSC's by Risk Outcome
1st October 2015 to 31st March 2019
High Risk
41% Not High Risk
59%
The chart below shows the number of HFSC’s that LFRS has delivered to the public within their
homes over the last five calendar years.
Number of HFSCs Completed
1st April 2014 to 31st March 2019
35000
30000
Number of HFSC's Completed
25000
20000
15000
10000
5000
0
2014/15 2015/16 2016/17 2017/18 2018/19
Response:
LFRS has now considered further opportunities to broaden and shape our HFSC service. This is
in response to improved opportunities to collaborate and work in partnership with Health
Agencies, the Local Authority and Third Sector Services. This revised approach is in line with the
Chief Fire Officers Association (CFOA) Health Strategy 2015-19 and delivered across the service.
Page | 25You can also read