Structure, dynamics, and trace gas variability within the Asian summer monsoon anticyclone in the extreme El Niño of 2015-2016
←
→
Page content transcription
If your browser does not render page correctly, please read the page content below
Atmos. Chem. Phys., 21, 5533–5547, 2021
https://doi.org/10.5194/acp-21-5533-2021
© Author(s) 2021. This work is distributed under
the Creative Commons Attribution 4.0 License.

Structure, dynamics, and trace gas variability within the Asian
summer monsoon anticyclone in the extreme El Niño of 2015–2016
Saginela Ravindra Babu1 , Madineni Venkat Ratnam2 , Ghouse Basha2 , Shantanu Kumar Pani1 , and Neng-Huei Lin1,3
1 Department  of Atmospheric Sciences, National Central University, Taoyuan 32001, Taiwan
2 National Atmospheric Research Laboratory, Gadanki 517112, India
3 Center for Environmental Monitoring and Technology, National Central University, Taoyuan 32001, Taiwan

Correspondence: Saginela Ravindra Babu (baburavindra595@gmail.com) and Neng-Huei Lin (nhlin@cc.ncu.edu.tw)

Received: 15 October 2020 – Discussion started: 16 November 2020
Revised: 8 February 2021 – Accepted: 2 March 2021 – Published: 9 April 2021

Abstract. A weak El Niño during 2014–2015 boreal winter           cated (even at 121 hPa) over the western edges of the ASMA.
developed as a strong boreal summer event in 2015 which           Further, the temperature around the tropopause shows signif-
continued and even enhanced during the following winter.          icant positive anomalies (∼ 5 K) within the ASMA in 2015.
In this work, the detailed changes in the structure, dynam-       The present results clearly reveal the El-Niño-induced dy-
ics, and trace gases within the Asian summer monsoon an-          namical changes caused significant changes in the trace gases
ticyclone (ASMA) during the extreme El Niño of 2015–              within the ASMA in summer 2015.
2016 is delineated by using Aura Microwave Limb Sounder
(MLS) measurements, COSMIC radio occultation (RO) tem-
perature, and National Centers for Environmental Prediction
(NCEP) reanalysis products. Our analysis concentrates only        1   Introduction
on the summer months of July and August 2015 when the
Niño 3.4 index started to exceed values of 1.5. The results       The Asian summer monsoon anticyclone (ASMA) is a dis-
show that the ASMA structure was quite different in sum-          tinct circulation system in the upper troposphere and lower
mer 2015 as compared to the long-term (2005–2014) mean.           stratosphere (UTLS) during Northern Hemisphere boreal
In July, the spatial extension of the ASMA is greater than        summer centered at ∼ 25◦ N and extending roughly between
the long-term mean in all the regions except over northeast-      15 to 40◦ N (Park et al., 2004; Randel et al., 2010). It is en-
ern Asia, where it exhibits a strong southward shift in its       circled by the subtropical westerly jet stream to the north
position. The ASMA splits into two, and the western Pa-           and by the equatorial easterly jet to the south (Randel and
cific mode is evident in August. Interestingly, the subtropical   Park, 2006). It is well recognized that the ASMA circulation
westerly jet (STJ) shifted southward from its normal posi-        is a prominent transport pathway for troposphere pollutants
tion over northeastern Asia, and as a result midlatitude air      to enter the stratosphere (Randel et al., 2010). Previous stud-
moved southward in 2015. Intense Rossby wave breaking             ies have concluded that deep convection during the summer
events along with STJ are also found in July 2015. Due to         monsoon can effectively transport the pollutants, aerosols,
these dynamical changes in the ASMA, pronounced changes           and tropospheric tracers from the boundary layer into the
in the ASMA tracers are noticed in 2015 compared to the           UTLS region (Vogel et al., 2016; Santee et al., 2017). These
long-term mean. A 30 % (20 %) decrease in carbon monox-           transported pollutants, tracers and aerosols become confined
ide (water vapor) at 100 hPa is observed in July over most of     in the ASMA and, consequently, affect the trace gas compo-
the ASMA region, whereas in August the drop is strongly           sition in the UTLS region (Randel et al., 2010; Hossaini et
concentrated at the edges of the ASMA. A prominent in-            al., 2015). It is clearly evident from the previous studies that
crease in O3 (> 40 %) at 100 hPa is clearly evident within the    the ASMA has higher concentrations of tropospheric tracers
ASMA in July, whereas in August the increase is strongly lo-      such as carbon monoxide (CO), hydrogen cyanide (HCN),
                                                                  and methane (CH4 ) and lower concentrations of stratospheric

Published by Copernicus Publications on behalf of the European Geosciences Union.
5534                   S. Ravindra Babu et al.: Asian summer monsoon anticyclone in the extreme El Niño of 2015–2016

tracers including ozone (O3 ) and nitric acid (HNO3 ) (Park et      They showed the weaker O3 transport into the tropics during
al., 2004, 2008; Li et al., 2005; Randel et al., 2010; Vernier et   the onset of the ASMA after boreal winter El Niño events,
al., 2015, 2018; Yan and Bian, 2015; Yu et al., 2017; Santee        but the difference between El Niño and La Niña compos-
et al., 2017). The comprehensive study on the climatologi-          ites becomes insignificant in the summer. In another study,
cal composition within the ASMA can be found in Santee              Tweedy et al. (2018) demonstrated the impact of boreal sum-
et al. (2017). The Asian summer monsoon (ASM) convec-               mer ENSO events on O3 composition within the ASMA
tion and orographic lifting are the primary mechanisms for          in different phases of ENSO events. They reported that the
the higher concentrations of the tropospheric tracers in the        ASMA forms earlier and stronger in the La Niña period that
ASMA (Li et al., 2005; Park et al., 2009; Santee et al., 2017).     leads to greater equatorward transport of O3 -rich air from the
Apart from these trace gases a strong persistent tropopause-        extratropics into the northern tropics than during El Niño pe-
level aerosol layer called the “Asian Tropopause Aerosol            riods. Recently, Fadnavis et al. (2019) reported higher con-
Layer” (ATAL) also existed between 12 to 18 km within the           centrations of aerosol layers observed in the ATAL region
ASMA, and it was first detected from the CALIPSO mea-               during the El Niño period over the northern part of South
surements (Vernier et al., 2011).                                   Asia. However, the above-mentioned studies are mainly fo-
   Similarly, higher concentrations of water vapor (WV)             cused on changes in the ASMA with respect to ENSO on sea-
within the ASMA during the summer monsoon is well doc-              sonal scales or the mature stage of the monsoon (combined
umented in the literature (Gettelman et al., 2004; Park et          mean of July and August).
al., 2007; Randel et al., 2010; Bian et al., 2012; Xu et al.,          Based on the above-mentioned studies, it can be concluded
2014; Jiang et al., 2015; Das and Suneeth, 2020). It is well        that the ENSO also has a strong influence on the ASMA
known that most of the WV enters the stratosphere through           structure and its composition. The recent 2015–2016 El Niño
the tropical tropopause (Fueglistaler et al., 2009), and the        event was recorded as an extreme and long-lasting event in
temperature present at the tropical tropopause strongly con-        the 21st century (Avery et al., 2017). It started as a weak
trols the WV entering the lower stratosphere (LS). It is also       El Niño during 2014–2015 boreal winter, and it developed
well documented that several processes such as convection,          as a strong boreal summer El Niño event in 2015 (Tweedy
the strength of the Brewer–Dobson circulation, El Niño–             et al., 2018). Further, this strong boreal summer event con-
Southern Oscillation (ENSO), and quasi-biennial oscillation         tinued and was significantly enhanced until the boreal win-
(QBO) are responsible for the WV transport to the UTLS re-          ter of 2015–2016. In this event, several unusual changes oc-
gion (Holton et al., 1995; Dessler et al., 2014; Jiang et al.,      curred in the tropical UTLS region including the strong en-
2015). Other factors such as gravity waves and horizontal           hancement in the lower stratosphere WV (higher positive
advection can also influence the WV transport in the UTLS           tropopause temperature anomalies) over the Southeast Asian
region. For example, Khan and Jin (2016) studied the effect         and western Pacific regions (Avery et al., 2017) and anoma-
of gravity waves on the tropopause and WV over the Ti-              lous distribution of trace gases in the UTLS region (Diallo
betan Plateau and reported that the gravity wave is the source      et al., 2018; Ravindra Babu et al., 2019a). In a similar way,
for the WV transport from the lower to higher altitudes. Re-        the response of different trace gases (O3 , HCl, WV) to the
cently, Das and Suneeth (2020) reported about the distribu-         disrupted 2015–2016 quasi-biennial oscillation (QBO) asso-
tions of WV in the UTLS over the ASMA during summer us-             ciated with the 2015–2016 El Niño event is also reported by
ing 13 years of Aura Microwave Limb Sounder (MLS) obser-            Tweedy et al. (2017). Dunkerton (2016) discussed the possi-
vations. They concluded that WV in the UTLS region inside           ble role of the unusually warm ENSO event in 2015–2016 to
the central part of ASMA is mostly controlled by horizontal         the QBO disruption by triggering the extratropical planetary
advection and much less by the local process and tropopause         waves. Therefore, in the present study, we investigated the
temperature in both summer and winter.                              detailed changes observed in the ASMA 2015 particularly by
   Convection during the summer monsoon is one of the ma-           focusing on the structure, dynamics, and trace gas variability
jor sources to transport the boundary layer pollutants into         within the ASMA in July and August 2015 by using satellite
the UTLS region (Randel et al., 2010). It is a well estab-          observations and reanalysis products. The present research
lished fact that the ENSO has a strong influence on convec-         article is organized as follows. The database and methodol-
tion and circulation changes over the Asian monsoon region          ogy adopted in this study are discussed in Sect. 2. The results
(Kumar et al., 1999; Wang et al., 2015; Gadgil and Fran-            and discussions are illustrated in Sect. 3. Finally, the sum-
cis, 2016). Enhanced (suppressed) convection over the Asian         mary and conclusions obtained from the present study are
monsoon region is generally observed in the cold phase of           summarized in Sect. 4.
ENSO (warm phase of ENSO) known as La Niña (El Niño).
Few studies exist to date on the impact of ENSO on the
ASMA trace gas composition changes and its dynamical
changes. For example, Yan et al. (2018) reported the influ-
ence of ENSO on the ASMA with a major focus on how the
ENSO winter signal propagates into the following seasons.

Atmos. Chem. Phys., 21, 5533–5547, 2021                                              https://doi.org/10.5194/acp-21-5533-2021
S. Ravindra Babu et al.: Asian summer monsoon anticyclone in the extreme El Niño of 2015–2016                                  5535

2     Database and methodology                                      and Son, 2012; Ravindra Babu et al., 2015; Ravindra Babu
                                                                    and Liou, 2021).
2.1    Microwave Limb Sounder measurements
                                                                    2.3    National Centers for Environmental Prediction
                                                                           (NCEP) reanalysis data
In the present study, version 4.2 of Aura MLS measurements
of CO, O3 , and WV are utilized. The MLS data of July and           We also utilized monthly mean geopotential height (GPH)
August in each year from 2005 to 2015 are considered. The           and wind vectors (zonal and meridional wind speed) from
vertical resolution for CO is in the range of 3.5–5 km from         the NCEP-DOE Reanalysis 2 (Kanamitsu et al., 2002), cov-
the upper troposphere to the lower mesosphere and the useful        ering the same time period as the MLS observations (2005–
range is 215–0.0046 hPa. The horizontal resolution for CO is        2015). NCEP-DOE Reanalysis 2 is an improved version of
about 460 km at 100 hPa and 690 km at 215 hPa. For WV,              the NCEP Reanalysis 1 model that fixed errors and updated
the vertical resolution is in the range of 2.0–3.7 km from 316      parametrizations of physical processes. The horizontal reso-
to 0.22 hPa, and the along-track horizontal resolution varies       lution of NCEP-DOE Reanalysis 2 is 2.5◦ × 2.5◦ .
from 210 to 360 km for pressure greater than 4.6 hPa. For              Apart from the above-mentioned data sets, we also used
O3 , the vertical resolution is ∼ 2.5 km, and the along-track       European Centre for Medium-Range Weather Forecasts
horizontal resolution varies between 300 and 450 km. The            (ECMWF) interim reanalysis potential vorticity (PV) data
precision (systematic uncertainty) for WV is ∼ 10 %–40 %            particularly at the 350 K isentropic surface in July and Au-
(∼ 10 %–25 %), for O3 ∼ 0.02–0.04 (∼ 0.02–0.05) ppmv,               gust 2015 (ERA-Interim; Uppala et al., 2005; Dee et al.,
and for CO ∼ 19 ppbv (30 %). More details about the MLS             2011).
version 4 level 2 data can be found in Livesey et al. (2018).
                                                                    2.4    Methodology
2.2    COSMIC radio occultation measurements
                                                                    Daily available MLS profiles of O3 , CO, and WV in each
                                                                    month are constructed and gridded by averaging the pro-
To see the changes in the tropopause temperature and                files inside bins with a resolution of 5◦ latitude × 5◦ longi-
height within the ASMA, we used high-resolution, post-              tude. The following equation is used to estimate the relative
processed products of level 2 dry temperature profiles ob-          change in percentage.
tained from Constellation Observing System for Meteorol-
                                                                                                      x
ogy, Ionosphere, and Climate (COSMIC) radio occultation             Relative change in percentage =
                                                                                                         i−x
                                                                                                               × 100,          (1)
(RO). Each month of July and August from 2006 to 2015                                                     x
is considered. The data are downloaded from the COSMIC
                                                                    where xi represents the monthly mean of July and August in
Data Analysis and Archive Center (CDAAC) website. We
                                                                    2015, and x is the corresponding monthly long-term mean
used 200 m vertical resolution temperature profiles in the
                                                                    which is calculated by using the data from 2005 to 2014.
study. Details of the temperature retrieval from the bending
angle and refractivity profiles obtained from the RO sounding
are represented well in the literature (Kursinski et al., 1997;     3     Results and discussion
Anthes et al., 2008). The COSMIC temperature have a pre-
cision of 0.1 % between 8 and 25 km (Kishore et al., 2009;          It is well reported that the ASMA is highly dynamic in nature
Kim and Son, 2012). The temperature accuracy in the UTLS            with respect to its position and shape. It also varies at differ-
is better than 0.5 K for individual profiles and ∼ 0.1 K for        ent timescales, i.e., day-to-day, weekly, and monthly scales,
averaged profiles (Hajj et al., 2004). It is noted that for indi-   caused by internal dynamical variability (Randel and Park,
vidual RO temperature profiles, the observational uncertainty       2006; Garny and Randel, 2013; Pan et al., 2016; Nützel et
estimate is 0.7 K in the tropopause region, slightly decreas-       al., 2016; Santee et al., 2017). The intensity and spatial ex-
ing into the troposphere, and gradually increasing into the         tension of the ASMA are prominent in July and August when
stratosphere (Scherllin-Pirscher et al., 2011a). For monthly        the monsoon was in the mature phase (Santee et al., 2017;
zonal-averaged temperature fields, the total uncertainty esti-      Basha et al., 2020). It can be noticed that the 2015–2016 El
mate is smaller than 0.15 K in the UTLS (Scherllin-Pirscher         Niño event was one of the strongest boreal summer events
et al., 2011b). Overall, the uncertainties of RO climatologi-       that occurred in the entire MLS data record (Tweedy et al.,
cal fields are small compared to any other UTLS observing           2018). In this event, the Niño 3.4 data exceeded +1.5 in July
system for thermodynamic atmospheric variables. Note that           and +1.8 in August (Fig. 1). Therefore, in the present study,
these data are compared with a variety of techniques includ-        we mainly focused on ASMA behavior and trace gas changes
ing GPS radiosonde data and had a good correlation partic-          within the ASMA on monthly scales particularly in July and
ularly in the UTLS region (Rao et al., 2009; Kishore et al.,        August 2015 which represent strong El Niño.
2009). The COSMIC RO profiles have been widely used for
studying the tropopause changes and its variabilities (Kim

https://doi.org/10.5194/acp-21-5533-2021                                             Atmos. Chem. Phys., 21, 5533–5547, 2021
5536 S. Ravindra Babu et al.: Asian summer monsoon anticyclone in the extreme El Niño of 2015–2016
Figure 1. Temporal evolution of observed Niño 3.4 index data from January 2005 to December 2016.
Figure 2. Spatial distribution of geopotential height obtained from NCEP-DOE Reanalysis 2 data during July 2015 at (a) 100 hPa and
(b) 150 hPa superimposed with wind vectors at the respective corresponding levels. Subplots of (c) and (d) are the same as (a) and (b) but
for the month of August. The solid black contour lines represent the ASMA region at 100 hPa (16.75 km GPH contour).
3.1 Structure and dynamical changes in ASMA during similar manner, we also defined the ASMA region based on
2015 GPHs obtained from NCEP-DOE Reanalysis 2 at 100 hPa
and considered the 16.75 km GPH contour as the anticyclone
In general, in the studies looking at monthly or seasonal region.
timescales related to the thermodynamical features in the The spatial distribution of GPH at 100 and 150 hPa for the
ASMA, the anticyclone region is mostly defined from the month of July (August) is shown in Fig. 2a and b (Fig. 2c
simple constant GPH contours at different pressure levels and d). The corresponding monthly mean winds at respective
(Randel and Park, 2006; Yan et al., 2011; Bergman et al., pressure levels are also shown in Fig. 2. The solid black line
2013; Basha et al., 2020). Previous researchers used differ- represents the ASMA region at 100 hPa based on 16.75 km
ent GPH contours at 100 hPa to define the anticyclone re- GPH contour. The GPH distribution in Fig. 2 shows clear dis-
gion. For example, Yan et al. (2011) used 16.7 km, Bergman tinct variability in the ASMA spatial structure between July
et al. (2013) used 16.77 km, and recently Basha et al. (2020) and August at both pressure levels. For example, at 100 hPa,
used 16.75 km GPH contours as the anticyclone region. In a
Atmos. Chem. Phys., 21, 5533–5547, 2021 https://doi.org/10.5194/acp-21-5533-2021S. Ravindra Babu et al.: Asian summer monsoon anticyclone in the extreme El Niño of 2015–2016 5537 Figure 3. Spatial distribution of geopotential height anomalies obtained from NCEP-DOE Reanalysis 2 data during July 2015 (a) at 100 hPa and (b) 150 hPa superimposed with wind vectors at the respective corresponding levels. Subplots of (c) and (d) same as (a) and (b) but for the month of August. The solid white contour lines represent the ASMA region at 100 hPa (16.75 km GPH contour) observed in 2015 whereas the black color lines represent the mean of 2005–2014. the maximum GPH center was located over the western side sion in July. Distinct features of GPH anomalies are noticed in July, whereas it was located near to the Tibetan region in in August as compared to July. In August, the strong negative August. Interestingly the ASMA itself separated into two an- GPH anomalies are situated over the west and northeastern ticyclones (16.75 km GPH contour; solid black line in the edges of the ASMA. figure) in August compared to July. The center of the small It is well known that the subtropical westerly jet is an im- anticyclone was located over the northwestern Pacific near portant characteristic feature of the ASMA (Ramaswamy, 140◦ E with the closed circulation indicated by the wind ar- 1958), and thus its changes during 2015 are also investi- rows. gated. As the peak intensity of the westerly jet was located at Further, we compared the ASMA structure in 2015 200 hPa (Chiang et al., 2015), we focused mainly on 200 hPa with the referenced long-term mean. For this, we ob- zonal wind changes in July and August. Figure 4a and c tained the GPH anomalies by subtracting the background (Fig. 4b and d) show the spatial distribution of the long- long-term mean (2005–2014) from 2015. Figure 3 shows term (2015) monthly mean zonal wind at 200 hPa during the latitudinal–longitudinal distribution of GPH anomalies July and August. In general, the subtropical westerlies are (shaded color) along with wind vectors depicting the circula- located near to ∼ 40◦ N latitude during the mature phase of tion pattern at 100 hPa, as well as at 150 hPa during July and the monsoon period (Chiang et al., 2015). Compared to the August. The white (black) color contour represents 16.75 km long-term mean, a significant weakening of the subtropical GPH at 100 hPa for the corresponding month in 2015 (long- westerlies is noticed in 2015. Further, a strong southward term mean). The GPH anomalies at both pressure levels show shift in the westerlies is observed over the northeastern Asia quite different features in July and August. A clear wave-like region. This southward shift is moved even up to 30◦ N in structure can be observed from the GPH anomalies. In July, both months. From zonal wind at 200 hPa (Fig. 4) and wind the GPH anomalies exhibit strong negative maxima over 25– vectors at 100 and 150 hPa (Fig. 2), it is clear that anoma- 40◦ N, 90–120◦ E and positive maxima over 40–50◦ N, 60– lous changes have occurred in the subtropical westerlies over 80◦ E regions. The 16.75 km GPH contour lines in the ASMA the northeastern parts of the ASMA around 30–40◦ N, 90– region exhibit higher extensions in all the directions except 120◦ E during July and August 2015. The southward shift over the northeastern edges of the ASMA in July compared in the westerlies is strongly associated with the southward to the long-term mean. At the same location (northeastern extension of the ASMA over the northeastern side of the edges), the ASMA exhibits a pronounced southward exten- ASMA (Fig. 2). This is strongly supported by the previous https://doi.org/10.5194/acp-21-5533-2021 Atmos. Chem. Phys., 21, 5533–5547, 2021
5538                   S. Ravindra Babu et al.: Asian summer monsoon anticyclone in the extreme El Niño of 2015–2016

Figure 4. Spatial distribution of monthly mean zonal winds obtained from NCEP-DOE Reanalysis 2 data at 200 hPa in July during (a) 2005–
2014 and (b) 2015. Subplots of (c) and (d) same as (a) and (b) but for the month of August. The solid white contour lines represent the
ASMA region at 100 hPa (16.75 km GPH contour).

findings of Lin and Lu (2005) for which they showed the
southward extension of the South Asian high could lead to
the southward shift of the westerlies.
   From the GPH and winds observations, it is clear that pro-
nounced changes are evident in the dynamical structure of
the ASMA in 2015, and also relatively different features are
noticed between July and August. Interestingly the ASMA
itself separated into two anticyclones during August 2015,
and the separation exactly coincided with the strong nega-
tive GPH anomalies and southward meandering of subtropi-
cal westerlies over the northeastern side of the ASMA. The
West Pacific (WP) mode of the anticyclone is visible in Au-
gust. The split of the anticyclone and the formation of the
WP mode are in agreement with previous studies reported by
a few researchers earlier (e.g., Honomichl and Pan, 2020).
The presence of the WP mode may be due to the eastward
eddy shedding of the ASMA system in the process of its
sub-seasonal zonal oscillation (Honomichl and Pan, 2020)
or Rossby wave breaking (RWB) in the subtropical westerly
jet (Fadnavis and Chattopadhyay, 2017). Fadnavis and Chat-
topadhyay (2017) also identified the split of ASMA into two           Figure 5. ERA-Interim-observed spatial distribution of potential
anticyclones: one over Iran and another over the Tibetan re-          vorticity (PV) on a 350 K isentropic surface in potential vorticity
gion due to the RWB in the June 2014 monsoon period. To               units (PVUs; 1 PVU = 10−6 K m2 kg−1 s−1 ): (a) monthly mean of
see any signatures of these RWBs in 2015, we further ana-             July and (b) monthly mean of August 2015. The solid white con-
lyzed the RWBs through the ERA interim reanalysis poten-              tour lines represent the ASMA region at 100 hPa (16.75 km GPH
tial vorticity (PV) data. Based on previous studies, it is re-        contour).
ported that RWBs can be identified from the PV distribution

Atmos. Chem. Phys., 21, 5533–5547, 2021                                                 https://doi.org/10.5194/acp-21-5533-2021
S. Ravindra Babu et al.: Asian summer monsoon anticyclone in the extreme El Niño of 2015–2016                                      5539

Figure 6. Same as Fig. 5 but for the weekly distribution of PV in July 2015. Magenta colored arrows indicate the regions of RWB.

at a 350 K isentropic surface (Samanta et al., 2016; Fadnavis          northeastern Asia even in week 5 (29 July–4 August), and we
and Chattopadhyay, 2017). We used 350 K isentropic surface             noticed RWB signatures in PV data (figure not shown). This
PV data in July and August 2015 in the present analysis.               clearly shows that the RWB splits the ASMA into two anticy-
   Figure 5a and b show the distribution of ERA interim                clones: one over the Tibetan region and another over the WP
monthly mean PV at the 350 K isentropic surface during July            region. It is clear that the equatorward penetration of extrat-
and August 2015. It can be seen that, during July and Au-              ropical forcing through the subtropical westerly jet started in
gust 2015, clear RWB signatures are evident near 100◦ E. It            July and was further amplified by the splitting of the ASMA
is noted that the equatorial advection of high PV values with          into two during August.
a steep gradient and the southward movement of PV from                     It is well known that the RWB is an important mecha-
the westerly jet are the basic features of the RWB (Vellore            nism for horizontal transport between the extratropical lower
et al., 2016; Samanta et al. 2016). These features are clearly         stratosphere to the tropical UTLS region. These RWBs can
exhibited in Fig. 5 with higher PV values extending up to              act as an agent for the transport of extratropical stratospheric
∼ 30◦ N in both months over the 100◦ E region. The location            cold, dry, and O3 -rich air into the ASMA during the summer
of this RWB is significantly correlated with a southward me-           monsoon. Overall, it is concluded that the combination of the
andering of westerlies and strong negative GPH anomalies.              RWBs and strong southward meandering of the subtropical
However, the observed RWB signatures in both months are                westerly jet in 2015 causes significant dynamical and struc-
from monthly mean PV data. Further, to see the clear signa-            tural changes in the ASMA. These changes in the ASMA dy-
tures of these RWBs, we made weekly based analyses for the             namical structure in 2015 can influence the concentrations of
month of July. For this we considered 1–7 July as week 1 and           the different trace gases within the ASMA. Further, we quan-
8–14 July as week 2 so on. The weekly mean distribution of             tified the changes in O3 , CO, and WV concentrations within
350 K isentropic surface PV during July is shown in Fig. 6.            the ASMA during 2015 caused by the dynamical effects. The
The magenta colored arrows which are shown in Fig. 6 rep-              changes that occurred in the O3 , CO, and WV are discussed
resent the RWB events during July 2015. A clear signature              in the following sections.
of air with high values of PV traverses from the extratrop-
ics to ASMA as is evident in Fig. 6. At weekly scales, clear           3.2   Trace gases anomalies observed within the ASMA
RWB signatures are observed over the anticyclone region.                     in 2015
For example, in week 1 and week 2, the RWB signatures are
evident over the northern region of the ASMA. However, in              It is well documented that the ASMA contains low (high)
week 3 and week 4, these RWB signatures are very clear over            concentrations of stratospheric tracers such as O3 (tropo-
                                                                       spheric tracers such as CO, WV, etc.) and higher tropopause

https://doi.org/10.5194/acp-21-5533-2021                                                 Atmos. Chem. Phys., 21, 5533–5547, 2021
5540 S. Ravindra Babu et al.: Asian summer monsoon anticyclone in the extreme El Niño of 2015–2016
increase was statistically significant with a long-term mean
with a standard deviation larger than 2σ (see the star sym-
bols). This increase is quite significant over the northeastern
edges of the ASMA and quite high at 100 hPa compared to 82
and 121 hPa. In August, the O3 shows quite different features
compared to July (Fig. 7d–f). A strong increase in the O3 is
observed over the western and eastern edges of the ASMA
at all the pressure levels. The increase is quite significant at
100 hPa and even at 121 hPa. The increase in O3 is still ap-
pearing over the northeastern edges of the ASMA in August
as observed in July. Overall, a significant enhancement of O3
within the ASMA is clear evidence in July and August 2015.
The significant increase in O3 within the ASMA in 2015
might be due to the transport from the midlatitudes through
the subtropical westerly jet (STJ) and also due to the strato-
sphere to the troposphere transport. For example, the strong
enhancement of O3 within the ASMA at 100 hPa in July was
strongly matched with the observed high values of PV at a
350 K isentropic surface (Fig. 6). This is further supported
by the strong southward meandering of STJ in July (Fig. 3).
Thus, a clear transport of midlatitude air with high PV and
Figure 7. Ozone relative percentage change in July 2015 with high O3 is evident during 2015. At the same time, the en-
respect to background climatological monthly mean observed at hancement of O3 was clearly observed at all the pressure lev-
(a) 82 hPa, (b) 100 hPa, and (c) 121 hPa. Subplots of (d)–(f) same els from 82 to 121 hPa, which is further support for the strato-
as (a)–(c) but for the month of August. The white (black) color con- sphere to the troposphere transport. Note that 82 hPa can rep-
tour represents 16.75 km geopotential height at 100 hPa for the cor- resent the lower stratosphere and 121 hPa the upper tropo-
responding month in 2015 (mean of 2005–2014). The star symbols
sphere (Das et al., 2020). It can be noticed that the ASMA
(black) shown in the figure represent the anomalies greater than the
±2σ standard deviation of the long-term mean. The results are ob-
is strongly associated with troposphere–stratosphere trans-
tained from MLS measurements. port, as well as stratosphere–troposphere transport (Garny
and Randel, 2016; Fan et al., 2017). Also, it is well re-
ported that the northern part of the ASMA is an active region
for stratosphere–troposphere transport processes (Sprenger
height compared to the region outside the ASMA during bo- et al., 2003; Škerlak et al., 2014).
real summer (Park et al., 2007; Randel et al., 2010; Santee et Similarly, significant lowering of O3 , particularly at 100
al., 2017; Basha et al., 2020). Differences of the trace gases and 82 hPa is clearly noticed over the tropics (Fig. 7). This is
within and outside of the ASMA are attributed to the strong quite expected due to the enhanced tropical upwelling (bring-
winds and closed streamlines associated with the ASMA, ing O3 -poor air from troposphere) caused by the strong El
which act to isolate the air (Randel and Park, 2006; Park et Niño conditions in July and August 2015. As mentioned in
al., 2007). To see the changes in the trace gases during 2015, the previous sections, strong El Niño conditions are clearly
we generated the background long-term mean of CO, O3 , and evident in July and August 2015 (Fig. 1). The observed
WV by using 10 years of MLS trace gas data from 2005 to strongly negative O3 anomalies over the tropics from the
2014. Here the results are discussed mainly based on the per- present study are well matched with the previous studies
centage changes relative to the respective long-term monthly (Randel et al., 2009; Diallo et al., 2018). From the present
mean trace gases using Eq. (1). results, it is very clear that there is a significant decrease over
Figure 7a to c (Fig. 7d–f) show the distribution of the rel- the tropics and increase over the midlatitudes in 2015. These
ative percentage change in the O3 concentrations within the changes observed in the O3 (decrease and increase) are at-
ASMA at 82, 100, and 121 hPa during July (August) 2015. tributed to the strengthening of the tropical upwelling and en-
The anomalies larger than ±2σ standard deviation of the hanced downwelling from the shallow branch of the Brewer–
long-term mean are highlighted with star symbols in the re- Dobson circulation in the midlatitudes due to the strong El
spective figures. The spatial distribution of changes in the Niño conditions in 2015. Overall, it is concluded that ini-
O3 (Fig. 7) shows a clear increase in the O3 mixing ratios tially, during July, the O3 is transported into the anticyclone
(> 40 %) within the ASMA in 2015. The observed increase from the northeastern edges of the ASMA region through
within the ASMA is quite distinct between July and Au- the subtropical westerlies, and then it is isolated within the
gust. In July, the O3 shows a pronounced increase within ASMA region. This is further supported by the southward
the ASMA at all the pressure levels. Note that the observed meandering of the westerly jet and southward shift of the
Atmos. Chem. Phys., 21, 5533–5547, 2021 https://doi.org/10.5194/acp-21-5533-2021S. Ravindra Babu et al.: Asian summer monsoon anticyclone in the extreme El Niño of 2015–2016 5541
Figure 8. Carbon monoxide relative percentage change during
July 2015 with respect to climatological monthly mean observed
at (a) 100 hPa and (b) 146 hPa. Subplots of (c) and (d) same as (a)
and (b) but for the month of August. The white (black) color con-
tour represents the 16.75 km geopotential height at 100 hPa for the
corresponding month in 2015 (mean of 2005–2014). The star sym-
bols (black) shown in the figure represent the anomalies greater than Figure 9. Water vapor relative percentage change in July 2015 with
the ±2σ standard deviation of the long-term mean. The results are respect to background climatological monthly mean observed at (a)
obtained from MLS measurements. 82 hPa, (b) 100 hPa, and (c) 146 hPa. Subplots of (d)–(f) same as
(a)–(c) but for the month of August. The white (black) color con-
tour represents the 16.75 km geopotential height at 100 hPa for the
corresponding month in 2015 (mean of 2005–2014). The star sym-
bols (black) shown in the figure represent the anomalies greater than
ASMA (negative GPH anomalies) over the same region in the ±2σ standard deviation of the long-term mean. The results are
July (Fig. 3). Also, a significant transport of midlatitude dry obtained from MLS measurements.
air is clear from Fig. 6. Thus, it is clear from the results that
the stratosphere to troposphere transport and horizontal ad-
vection along with the subtropical jet caused the strong en- weaker vertical transport due to the El Niño conditions in
hancement of the O3 within the ASMA in 2015. 2015.
Figure 8a and b (Fig. 8c–d) show the spatial distribution of Similarly, the WV relative percentage change at 82, 100,
CO relative percentage change at 100 and 146 hPa observed and 146 hPa in July (August) 2015 are shown in Fig. 9a–c
during July (August) 2015. The white (black) color contour (Fig. 9d–f). The WV shows quite different changes at all the
represents 16.75 km GPH at 100 hPa for the corresponding pressure levels in July and August. At 146 hPa, the WV ex-
month in 2015 (climatological mean). The observed changes hibits a strong decrease (> 20 %) within the ASMA in July,
in the CO clearly exhibit quite distinct features between July as well as in August. However, at 100 and 82 hPa, the WV
and August as observed in the O3 . A significant decrease shows a relatively significant decrease within the ASMA in
(∼ 30 %) is noticed in the CO concentrations over most of July compared to August. From the WV observations, it is
the ASMA in July. The maximum decrease in CO is noticed concluded that the WV is strongly decreased at 146 hPa in
over the northeastern edges of the ASMA, located in the both months, whereas at 100 and 82 hPa, the decrease in WV
∼ 30–45◦ N, 90–120◦ E region, whereas in August, the de- is quite high in July compared to August. It is also observed
crease in CO is more concentrated over the eastern and west- from Fig. 9 that there is a significant enhancement of WV
ern edges of the ASMA at both the pressure levels. Overall, over the tropics at 146 hPa in both months. But the WV en-
the MLS-observed CO was ∼ 30 % below average (percent- hancement is quite significant at 100 hPa, particularly dur-
age decrease) compared to the climatological monthly mean ing August compared to July. This enhancement in the WV
within the ASMA in July and edges of the ASMA in Au- around the tropical tropopause region in August is quite ex-
gust 2015. It is noted that there is a considerable year-to-year pected due to the El Niño conditions (Randel et al., 2009;
variability in the CO sources over the ASM region (Santee Konopka et al., 2016). Overall, the tropospheric tracers (CO
et al., 2017). The major sources of the CO over the ASM re- and WV) significantly decreased (∼ 30 % and 20 %) within
gion are from biomass burning and industrial emissions. The the ASMA during July and August 2015. These changes in
observed decreased CO within the ASMA in 2015 might be the tropospheric tracers might be due to the weaker vertical
due to the year-to-year variability in the CO sources and the motions during the 2015 monsoon. A weaker vertical trans-
https://doi.org/10.5194/acp-21-5533-2021 Atmos. Chem. Phys., 21, 5533–5547, 20215542 S. Ravindra Babu et al.: Asian summer monsoon anticyclone in the extreme El Niño of 2015–2016
port from the boundary layer to the UTLS is generally ob-
served over the ASM region during El Niño periods (Fad-
navis et al., 2019). The El Niño conditions will suppress the
monsoon convection and cause weaker vertical transport dur-
ing monsoons. It is also reported that the summer monsoon
in 2015 was weaker due to the strongest El Niño conditions
existing in 2015 (Tweedy et al., 2018; Yuan et al., 2019; Fad-
navis et al., 2019).
From these results, it is clear that the enhancement of O3
and lowering of CO and WV is evident in July and Au-
gust 2015 compared to the long-term monthly mean. The
observed high O3 and low WV within the ASMA from the
present study are consistent and well matched with the pre-
vious study reported by Li et al. (2018). They demonstrated
the importance of the large-scale atmospheric dynamics and
the stratospheric intrusions for high O3 and low WV over
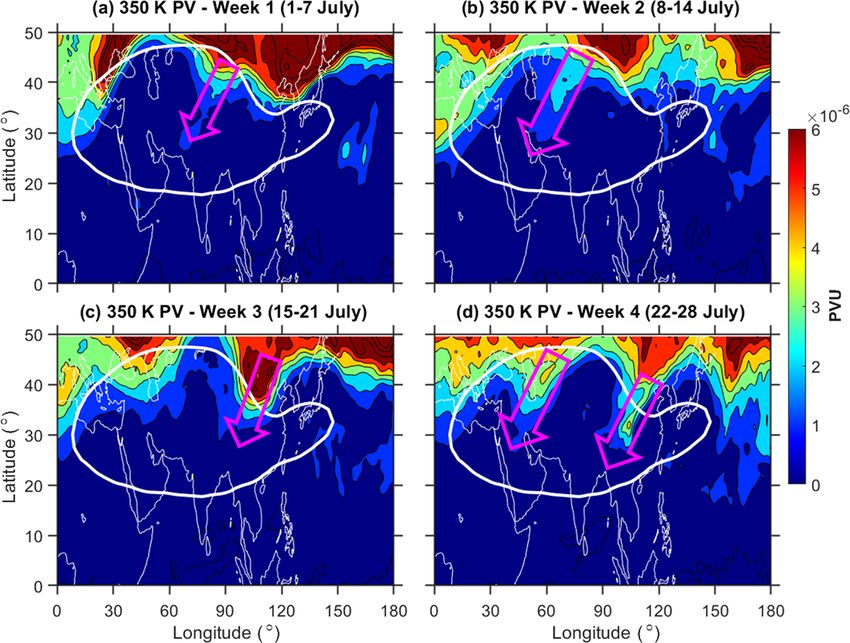
Figure 10. Spatial distribution of (a) lapse rate tropopause tem-
Lhasa within the ASMA by using in situ balloon-borne mea-
perature (LRT) and (b) cold-point tropopause temperature (CPT)
surements. The O3 and WV changes strongly influence the anomalies during July 2015. Subplots of (c) and (d) same as (a)
background temperature structure within the UTLS region and (b) but for the month of August 2015. The white (black) color
(Venkat Ratnam et al., 2016; Ravindra Babu et al., 2019b). contour represents the 16.75 km geopotential height at 100 hPa for
Further, we investigated the tropopause temperature changes the corresponding month in 2015 (mean of 2005–2014). The star
within the ASMA by using COSMIC RO data. The results symbols (black) shown in the figure represent the anomalies greater
are presented in the following section. than the ±2σ standard deviation of the long-term mean.
3.3 Tropopause temperature anomalies in 2015
served significant warm tropopause temperature anomalies
It is well known that the tropopause plays a crucial role in over the WP and maritime continent during the El Niño pe-
the exchange of WV, O3 , and other chemical species be- riod (Gettelman et al., 2001). In August, the strong positive
tween the troposphere and the stratosphere. Most of these CPT and LRT anomalies (∼ 5 K) are concentrated over the
exchanges (WV to the lower stratosphere and O3 to the upper northeastern edges of the anticyclone where the WP mode
troposphere) known as stratosphere–troposphere exchange of the anticyclone was separated from the ASMA. The tem-
(STE) take place around the tropopause region (Fueglistaler perature anomalies at 1 km above and below the CPH also
et al., 2009; Venkat Ratnam et al., 2016; Ravindra Babu et show similar behavior as seen in the CPT and LRT during
al., 2019b). It is well reported that the tropopause within the August 2015 (figures not shown). Overall, the tropopause
ASMA is higher than the outside regions at the same latitude temperature anomalies in July and August 2015 within the
(Randel et al., 2010; Santee et al., 2017). In the present study, ASMA are well correlated with the strong enhancement in
we mainly focused on changes in the cold-point tropopause the O3 as shown in Fig. 7. However, the enhanced O3 anoma-
temperature (CPT) and lapse rate tropopause temperature lies (heating due to the O3 ) themselves cannot explain the ob-
(LRT) within the ASMA in July and August 2015. The July served positive tropopause temperature anomalies within the
and August 2015 monthly mean tropopause parameters are ASMA in 2015. This might be due to the El-Niño-induced
removed from the respective climatological monthly mean changes in the convective activity and the circulation. It is
which is calculated by using COSMIC RO data from 2006 to well known that the reversal of walker circulation and the
2014. One can note that we have strictly restricted our anal- shifting of the convective activity (suppressed convective ac-
ysis within the 40◦ N region for the cold-point tropopause. tivity over the ASM region) are generally observed during
Figure 10a and b (Fig. 10c–d) show the CPT and LRT the warm phase of ENSO. It can be noticed that apart from
anomalies observed in July (August) 2015. The tropopause the convection, other factors such as stratospheric QBO and
temperature anomalies (CPT and LRT) also exhibit a dis- atmospheric waves (gravity waves and Kelvin waves) also
tinct pattern in July and August as observed in O3 (Fig. 7). strongly influenced the tropopause temperatures.
In July, the CPT and LRT show strong positive anomalies
(∼ 5 K) in most of the ASMA region. High positive CPT
and LRT anomalies are also noticed over the northwestern 4 Summary and conclusions
Pacific (NWP) region particularly below 20◦ N. These CPT
and LRT anomalies observed over the NWP region might In this study, we investigated the detailed changes observed
be due to the El-Niño-induced changes in the Walker cir- in the structure, dynamics, and trace gas (ozone, water va-
culation and convective activity. Previous studies also ob- por, carbon monoxide) variability within the ASMA in 2015
Atmos. Chem. Phys., 21, 5533–5547, 2021 https://doi.org/10.5194/acp-21-5533-2021S. Ravindra Babu et al.: Asian summer monsoon anticyclone in the extreme El Niño of 2015–2016 5543
by using reanalysis products and satellite observations. The – The combination of Rossby wave breaking and pro-
tropopause temperature (CPT and LRT) on monthly scales nounced southward meandering of subtropical wester-
particularly during July and August 2015 was also discussed. lies plays a crucial role in the dynamical and structural
To quantify the changes that happened within the ASMA re- changes in the ASMA in 2015.
gion, 11 years (2005–2015) of O3 , WV, and CO observa-
tions from the Aura-MLS data and 10 years (2006–2015) of – The strong enhancement in O3 at 100 hPa (> 40 %)
tropopause temperature data from the COSMIC RO temper- is clearly evident within the ASMA and particularly
ature profiles are used. The winds observed by NCEP-DOE higher over the northeastern edges of the ASMA in July.
Reanalysis 2 and GPH data from 2005 to 2015 are also uti- The enhanced O3 is strongly associated with a dominant
lized. The results are obtained by comparing the trace gas southward meandering of the subtropical westerlies. In
quantities in July and August 2015 with corresponding long- August, the increased O3 is significantly located over
term monthly mean quantities. the western edges of the ASMA. This clearly indicates
The trace gases within the ASMA exhibit substantial the transport from the ASMA to the edges through its
anomalous behavior in July and August 2015. During July outflow.
and August 2015, we observed an enhancement of O3 and
– A significant lowering of CO and WV within the ASMA
the lowering of CO and WV over most of the ASMA re-
is noticed during summer 2015. The lowering of WV is
gion. The decrease in the tropospheric tracers (CO and WV)
higher at 146 hPa than 100 hPa.
is quite expected due to the weaker upward motions from
the weak monsoon in 2015. This is supported by a recent – Significantly positive tropopause temperature anoma-
study reported by Fadnavis et al. (2019). It showed weaker lies (∼ 5 K) are observed in the entire ASMA region
upward motions and deficient rainfall in the 2015 monsoon in July, whereas in August, the strong positive anoma-
due to the strong El Niño conditions. However, the strong en- lies are concentrated over the northeastern side of the
hancement in the stratospheric tracer (O3 ) within the ASMA ASMA.
particularly over the northeastern edges of the ASMA dur-
ing July is quite interesting. This might be due to the strato- The changes in the O3 concentrations (increase or de-
spheric intrusions, as well as transport from the midlatitudes. crease) within the ASMA are one of the possible mech-
Based on Fishman and Seiler (1983), it was stated that the anisms strengthening or weakening the ASMA (Braesicke
positive correlation between CO and O3 indicates that the et al., 2011). By using idealized climate model experi-
O3 is produced in situ in the troposphere, whereas when the ments, Braesicke et al. (2011) clearly demonstrated that the
correlation is negative, it means the O3 originates from the strengthening (weakening) of the ASMA occurred when the
stratosphere. We noticed a strong negative correlation be- O3 is decreased (increased) within the ASMA. The increased
tween CO and O3 in the present study with increased O3 and O3 within the ASMA warms the entire anticyclone region
decreased CO from the MLS measurements. This clearly re- and weakens the ASMA (Braesicke et al., 2011). Our results
veals that the observed increased O3 within the ASMA dur- from the present study are also in agreement with the results
ing 2015 is of stratospheric origin. This is further supported of Braesicke et al. (2011). We also observed a pronounced
by higher negative GPH anomalies associated with a south- increase in O3 within the ASMA associated with the signifi-
ward meandering of the subtropical westerly jet over north- cant warming of the tropopause, as well as above and below
eastern Asia in July (Figs. 3 and 4). Further, the increased O3 the tropopause region, in 2015. By using precipitation index,
at 100 and 121 hPa over western edges of the ASMA during wind data, and stream functions, previous studies reported
August clearly indicates the transport of the O3 towards outer that the ASMA circulation in 2015 was weaker than the nor-
regions through the outflow of the ASMA (Fig. 7e–f). Inter- mal (Tweedy et al., 2018; Yuan et al., 2019). Based on our
estingly, the tropopause temperature obtained from the COS- present results, the strongly enhanced O3 within the ASMA
MIC RO data in July 2015 shows strong positive temperature also might be one of the plausible reasons for weakening of
anomalies (∼ 5 K) over the entire ASMA region. These warm the ASMA in 2015.
tropopause temperatures again supported the increased O3
within the ASMA during 2015. The major findings obtained
from the present study are summarized in the following. Data availability. All the data used in the present study are
available freely from the respective websites. MLS version 4.2
level 2 data can be downloaded from https://acdisc.gesdisc.
eosdis.nasa.gov/data/Aura_MLS_Level2/ (NASA, 2021, last ac-
– The spatial extension of the ASMA region shows a
cess: 15 January 2021). The COSMIC RO data can be down-
mean higher than the long-term mean except over north- loaded from the CDAAC UCAR website https://cdaac-www.
eastern Asia where it exhibits a strong southward shift cosmic.ucar.edu/cdaac/products.html (CDAAC, 2021, last ac-
in July, whereas in August, the ASMA further separated cess: 15 January 2021). The NCEP Reanalysis 2 data were
into two anticyclones, and the western Pacific mode an- downloaded from NOAA/OAR/ESRL PSL, Boulder, Colorado,
ticyclone is clearly evident in August. USA, from their website http://www.cpc.ncep.noaa.gov/products/
https://doi.org/10.5194/acp-21-5533-2021 Atmos. Chem. Phys., 21, 5533–5547, 20215544 S. Ravindra Babu et al.: Asian summer monsoon anticyclone in the extreme El Niño of 2015–2016
wesley/reanalysis2/kana/reanl2-1.html (NCEP-DOE, 2021, last ac- ming during the Asian summer monsoon, Geophys. Res. Lett.,
cess: 15 January 2021). ERA-Interim reanalysis data were ob- 39, L19808, https://doi.org/10.1029/2012GL052996, 2012.
tained from the European Centre for Medium-Range Weather Braesicke, P., Smith, O. J., Telford, P., and Pyle, J. A.:
Forecasts (ECMWF) from http://apps.ecmwf.int/datasets/data/ Ozone concentration changes in the Asian summer mon-
interim-full-daily/levtype=pl/ (ECMWF, 2021, last access: 15 Jan- soon anticyclone and lower stratospheric water vapour: An
uary). The monthly Niño 3.4 index data were downloaded from the idealised model study, Geophys. Res. Lett., 38, L03810,
Climate Prediction Center website http://www.cpc.ncep.noaa.gov https://doi.org/10.1029/2010GL046228, 2011.
(last access: 15 January 2021). CDAAC (COSMIC Data Analysis and Archive Center): CDAAC
Data Products, available at: http://cdaac-www.cosmic.ucar.edu/
cdaac/products.html, last access: 15 January 2021.
Author contributions. SRB designed the study and conducted re- Chiang, J. C. H., Fung, I. Y., Wu, C. H., Cai, Y. J., Edman, J.
search. SRB, GB and SKP performed data analysis. SRB wrote the P., Liu, Y. W., Day, J. A., Bhattacharya, T., Mondal, Y., and
first manuscript draft. MVR and NHL provided useful comments Labrousse, C. A.: Role of seasonal transitions and westerly jets
and revised the paper. SRB edited the final manuscript. in East Asian paleoclimate, Quaternary Sci. Rev., 108, 111–129,
https://doi.org/10.1016/j.quascirev.2014.11.009, 2015.
Dee, D. P., Uppala, S. M., Simmons, A. J., Berrisford, P., Poli,
Competing interests. The authors declare that they have no conflict P., Kobayashi, S., Andrae, U., Balmaseda, M. A., Balsamo, G.,
of interest. Bauer, P., Bechtold, P., Beljaars, A. C. M., van de Berg, I., Biblot,
J., Bormann, N., Delsol, C., Dragani, R., Fuentes, M., Greer, A.
J., Haimberger, L., Healy, S. B., Hersbach, H., Holm, E. V., Isak-
sen, L., Kallberg, P., Kohler, M., Matricardi, M., McNally, A. P.,
Acknowledgements. Aura MLS observations obtained from the
Mong-Sanz, B. M., Morcette, J.-J., Park, B.-K., Peubey, C., de
GES DISC through their FTP site (https://mls.jpl.nasa.gov/
Rosnay, P., Tavolato, C., Thepaut, J. N., and Vitart, F.: The ERA-
index-eos-mls.php, last access: 15 January 2021) are duly acknowl-
Interim reanalysis: Configuration and performance of the data
edged. We thank the COSMIC Data Analysis and Archive Center
assimilation system, Q. J. Roy. Meteorol. Soc., 137, 553–597,
(CDAAC) for providing RO data used in the present study through
https://doi.org/10.1002/qj.828, 2011.
their FTP site (http://cdaac-www.cosmic.ucar.edu/cdaac/products.
Diallo, M., Riese, M., Birner, T., Konopka, P., Müller, R., Hegglin,
html, last access: 15 January 2021). We also thank NCEP/NCAR
M. I., Santee, M. L., Baldwin, M., Legras, B., and Ploeger, F.:
reanalysis for providing geopotential and wind data. We thank
Response of stratospheric water vapor and ozone to the unusual
ECMWF for providing ERA Interim reanalysis data.
timing of El Niño and the QBO disruption in 2015–2016, Atmos.
Chem. Phys., 18, 13055–13073, https://doi.org/10.5194/acp-18-
13055-2018, 2018.
Review statement. This paper was edited by Rolf Müller and re- Das, S. S., Suneeth, K. V., Ratnam, M. V., Girach, I. A., and Das,
viewed by Paul Konopka, Dan Li, and one anonymous referee. S. K.: Upper tropospheric ozone transport from the sub-tropics
to tropics over the Indian region during Asian summer mon-
soon, Clim Dynam., 52, 4567, https://doi.org/10.1007/s00382-
018-4418-6, 2019.
Das, S. and Suneeth, K. V.: Seasonal and interannual varia-
References tions of water vapor in the upper troposphere and lower
stratosphere over the Asian Summer Monsoon region –
Anthes, R., Bernhardt, P., Chen, Y., Cucurull, L., Dymond, K., Ec- in perspective of the tropopause and ocean-atmosphere
tor, D., Healy, S., Ho, S., Hunt, D., Kuo, Y., Liu, H., Manning, K., interactions, J. Atmos. Sol.-Terr. Phy., 201, 105244,
Mccormick, C., Meehan, T., Randel, W., Rocken, C., Schreiner, https://doi.org/10.1016/j.jastp.2020.105244, 2020.
W., Sokolovskiy, S., Syndergaard, S., Thompson, D., Trenberth, Dessler, A. E., Schoeberl, M. R., Wang, T., Davis, S. M., Rosenlof,
K., Wee, T., Yen, N., and Zeng, Z.: The COSMIC/FORMOSAT- K. H., and Vernier, J. P.: Variations of stratospheric water va-
3 – Mission early results, B. Am. Meteorol. Soc., 89, 313–333, por over the past three decades, J. Geophys. Res.-Atmos., 119,
2008. 12588–12598, https://doi.org/10.1002/2014JD021712, 2014.
Avery, M. A., Davis, S. M., Rosenlof, K. H., Ye, H., and Dessler, Dunkerton, T. J.: The quasi-biennial oscillation of 2015–2016: Hic-
A. E.: Large anomalies in lower stratospheric water vapour and cup or death spiral?, Geophys. Res. Lett., 43, 10547–10552,
ice during the 2015–2016 El Niño, Nat. Geosci., 10, 405–409, https://doi.org/10.1002/2016GL070921, 2016.
https://doi.org/10.1038/ngeo2961, 2017. ECMWF (European Centre for Medium-Range Weather Forecasts):
Basha, G., Ratnam, M. V., and Kishore, P.: Asian summer mon- ERA Interim, available at: http://apps.ecmwf.int/datasets/data/
soon anticyclone: trends and variability, Atmos. Chem. Phys., 20, interim-full-daily/levtype=pl/, last access: 15 January 2021.
6789–6801, https://doi.org/10.5194/acp-20-6789-2020, 2020. Fadnavis, S. and Chattopadhyay, R.: Linkages of subtropi-
Bergman, J. W., Fierli, F., Jensen, E. J., Honomichl, S., and Pan, L. cal stratospheric intraseasonal intrusions with Indian sum-
L.: Boundary layer sources for the Asian anticyclone: Regional mer monsoon deficit rainfall, J. Climate, 30, 5083–5095,
contributions to a vertical conduit, J. Geophys. Res.-Atmos., 118, https://doi.org/10.1175/JCLI-D-16-0463.1, 2017.
2560–2575, https://doi.org/10.1002/jgrd.50142, 2013. Fadnavis, S., Sabin, T. P., Roy, C., Rowlinson, M., Rap, A.,
Bian, J. C., Pan, L. L., Paulik, L., Vömel, H., and Chen, H. B.: Vernier, J.-P., and Sioris, C. E.: Elevated aerosol layer over
In situ water vapor and ozone measurements in Lhasa and Kun-
Atmos. Chem. Phys., 21, 5533–5547, 2021 https://doi.org/10.5194/acp-21-5533-2021S. Ravindra Babu et al.: Asian summer monsoon anticyclone in the extreme El Niño of 2015–2016 5545 South Asia worsens the Indian droughts, Sci. Rep., 9, 10268, COSMIC GPS Radio Occultation Measurements, J. Climate, 25, https://doi.org/10.1038/s41598-019-46704-9, 2019. 5343–5360, https://doi.org/10.1175/JCLI-D-11-00554.1, 2012. Fan, Q., Bian, J., and Pan, L. L.: Stratospheric entry point Kumar, K. K., Rajagopalan, B., and Cane, M. A.: On the weakening for upper-tropospheric air within the Asian summer mon- relationship between the Indian monsoon and ENSO, Science, soon anticyclone, Sci. China Earth Sci., 60, 1685–1693, 287, 2156–2159, 1999. https://doi.org/10.1007/s11430-016-9073-5, 2017. Kursinski, E. R., Hajj, G. A., Schofield, J. T., Linfield, R. P., and Fishman, J. and Seiler, W.: Correlative nature of ozone and car- Hardy, K. R.: Observing Earth’s atmosphere with radio occulta- bon monoxide in the troposphere – Implications for the tro- tion measurements using the Global Positioning System, J. Geo- pospheric ozone budget, J. Geophys. Res. 88, 3662–3670, phys. Res., 102, 23429–23465, 1997. https://doi.org/10.1029/JC088iC06p03662, 1983. Konopka, P., Ploeger, F., Tao, M., and Riese, M.: Zonally resolved Fueglistaler, S., Dessler, A. E., Dunkerton, T. J., Folkins, I., Fu, Q., impact of ENSO on the stratospheric circulation and water va- and Mote, P. W.: Tropical Tropopause Layer, Rev. Geophys., 47, por entry values, J. Geophys. Res.-Atmos., 121, 11486–11501, G1004, https://doi.org/10.1029/2008RG000267, 2009. https://doi.org/10.1002/2015JD024698, 2016. Gadgil, S. and Francis, P. A.: El Niño and the Indian rainfall in June, Li, Q., Jiang, J. H., Wu, D. L., Read, W. G., Livesey, N. J., Waters, Curr. Sci., 110, 1010–1022, 2016. J. W., Zhang, Y., Wang, B., Filipiak, M. J., Davis, C. P., Turquety, Garny, H. and Randel, W. J.: Transport pathways from the S., Wu, S., Park, R. J., Yantosca, R. M., and Jacob, D. J.: Convec- Asian monsoon anticyclone to the stratosphere, Atmos. Chem. tive outflow of South Asian pollution: A global CTM simulation Phys., 16, 2703–2718, https://doi.org/10.5194/acp-16-2703- compared with EOS MLS observations, Geophys. Res. Lett., 32, 2016, 2016. L14826, https://doi.org/10.1029/2005GL022762, 2005. Gettelman, A., Randel, W. J., Massie, S., and Wu, F.: El Niño as a Li, D., Vogel, B., Müller, R., Bian, J., Günther, G., Li, Q., natural experiment for studying the tropical tropopause region, J. Zhang, J., Bai, Z., Vömel, H., and Riese, M.: High tropo- Clim., 14, 3375–3392, 2001. spheric ozone in Lhasa within the Asian summer monsoon an- Gettelman, A., Kinnison, D. E., Dunkerton, T. J., and Brasseur, ticyclone in 2013: influence of convective transport and strato- G. P.: Impact of monsoon circulations on the upper troposphere spheric intrusions, Atmos. Chem. Phys., 18, 17979–17994, and lower stratosphere, J. Geophys. Res.-Atmos., 109, D22101, https://doi.org/10.5194/acp-18-17979-2018, 2018. https://doi.org/10.1029/2004JD004878, 2004. Lin, Z., and Lu, R.: Inter annual meridional displacement of the Hajj, G. A., Ao, C. O., Iijima, B. A., Kuang, D., Kursinski, E. R., East Asian upper tropospheric jet stream in summer. Adv. Atmos. Mannucci, A. J., Meehan, T. K., Romans, L. J., de la Torre Juarez, Sci., 22, 199–211, https://doi.org/10.1007/BF02918509, 2005. M., and Yunck, T. P.: CHAMP and SAC-C atmospheric occulta- Livesey, N. J., Read, W. G., Wagner, P. A., Froidevaux, L., Lambert, tion results and inter comparisons, J. Geophys. Res.-Atmos., 109, A., Manney, G. L., Valle, L. F. M., Pumphrey, H. C., Santee, M. D06109, https://doi.org/10.1029/2003JD003909, 2004. L., Schwartz, M. J., Wang, S., Fuller, R. A., Jarnot, R. F., Knosp, Holton, J. R., Haynes, P. H., McIntyre, M. E., Dou- B. W., and Martinez, E.: Version 4.2x Level 2 data quality and glass, A. R., Rood, R. B., and Pfister, L.: Stratosphere description document, available at: https://mls.jpl.nasa.gov/data/ Troposphere exchange, Rev. Geophys., 33, 403–439, v4-2_data_quality_document.pdf (last access: 15 January 2021), https://doi.org/10.1029/95RG02097, 1995. 2018. Honomichl, S. B. and Pan, L. L.: Transport from the Kishore, P., Namboothiri, S. P., Jiang, J. H., Sivakumar, V., and Asian summer monsoon anticyclone over the western Igarashi,K.: Global temperature estimates in the troposphere and Pacific, J. Geophys. Res.-Atmos., 125, e2019JD032094, stratosphere: a validation study of COSMIC/FORMOSAT- https://doi.org/10.1029/2019JD032094, 2020. 3 measurements, Atmos. Chem. Phys., 9, 897–908, Hossaini, R., Chipperfield, M., Montzka, M. P., Rap, S. A., Dhomse, https://doi.org/10.5194/acp-9-897-2009, 2009. S., and Feng, W.: Efficiency of short-lived halogens at influ- NASA: NASA GES DISK Aura MLS level 2 data, avail- encing climate through depletion of stratopsheric ozone, Nat. able at: https://acdisc.gesdisc.eosdis.nasa.gov/data/Aura_MLS_ Geosci., 8, 186–190, https://doi.org/10.1038/ngeo2363, 2015. Level2/, last access: 15 January 2021. Jiang, J. H., Su, H., Zhai, C., Wu, L., Minschwaner, K., NCEP-DOE (National Centers for Environmental Predic- Molod, A. M., and Tompkins, A. M.: An assessment of tion/National Weather Service/NOAA/U.S. Department of Com- upper troposphere and lower stratosphere water vapor in merce): NCEP/DOE Reanalysis 2, available at: http://www.cpc. MERRA, MERRA2, and ECMWF reanalyses using Aura MLS ncep.noaa.gov/products/wesley/reanalysis2/kana/reanl2-1.html, observations, J. Geophys. Res.-Atmos., 120, 11468–11485, last access: 15 January 2021. https://doi.org/10.1002/2015JD023752, 2015. Nützel, M., Dameris, M., and Garny, H.: Movement, drivers and Kanamitsu, M., Ebisuzaki, W., Woollen, J., Yang, S.-K., Hnilo, bimodality of the South Asian High, Atmos. Chem. Phys., J. J., Fiorino, M., and Potter, G. L.: NCEP-DOE AMIP-II 16, 14755–14774, https://doi.org/10.5194/acp-16-14755-2016, Renalalysys (R-2), B. Am. Meteorol. Soc., 83, 1631–1643, 2016. https://doi.org/10.1175/BAMS-83-11-1631, 2002. Pan, L. L., Honomichl, S. B., Kinnison, D. E., Abalos, M., Khan, A. and Jin, S.: Effect of gravity waves on the tropopause tem- Randel, W. J., Bergman, J. W., and Bian, J. C.: Trans- perature, altitude and water vapor in Tibet from COSMIC GPS port of chemical tracers from the boundary layer to strato- Radio Occultation observations, J. Atmos. Sol.-Terr. Phy., 138– sphere associated with the dynamics of the Asian sum- 139, 23–31, https://doi.org/10.1016/j.jastp.2015.12.001, 2016. mer monsoon, J. Geophys. Res.-Atmos., 121, 14159–14174, Kim, J. and Son, S.-W.: Tropical Cold-Point Tropopause: Climatol- https://doi.org/10.1002/2016JD025616, 2016. ogy, Seasonal Cycle, and Intraseasonal Variability Derived from https://doi.org/10.5194/acp-21-5533-2021 Atmos. Chem. Phys., 21, 5533–5547, 2021
You can also read