Study of the Current Situation of the Ubangi Basin in the Face of Current Geopolitical Challenges
←
→
Page content transcription
If your browser does not render page correctly, please read the page content below

769              International Journal of Progressive Sciences and Technologies (IJPSAT)
                 ISSN: 2509-0119.
                 © 2021 International Journals of Sciences and High Technologies
                 http://ijpsat.ijsht‐journals.org                                        Vol. 29 No. 1 October 2021, pp.167-177

Study of the Current Situation of the Ubangi Basin in the Face of
                Current Geopolitical Challenges
Alphonse K. Benza1, Faustin E. Bolia2, Jean Jacques D. Amogu2, Blaise Mbembo Wa Mbembo2, Jocelyn N.
                  Djamano3, Jean-Claude M. Tshilumbayi1, Koto-Te-Nyiwa Ngbolua2
      1
          Department of International Relations, Faculty of Social, Administrative and Political Sciences, University of
                          Kinshasa, P.O Box 190, Kinshasa XI, Democratic Republic of the Congo. *
       2
           Department of Biology, Faculty of Sciences, University of Kinshasa, P.O Box 190, Kinshasa XI, Democratic
                                                   Republic of the Congo. *
 3
     Department of Development Economics, Faculty of Economics and Management, University of Kinshasa, P.O Box
                               190, Kinshasa XI, Democratic Republic of the Congo.*

Abstract
Aim : The objective of this study was to evaluate the flow (monthly and annual), the climate model, the plant biomass, the heat islands,
the albedo (hourly and monthly), the evaporation, the precipitation and the evapotranspiration of the Oubangui river basin and to follow
the evolution of these parameters with data from 1999 to 2018.
Methodology: Thanks to Landsat satellite images and those of the American site Giovanni, we collected data on the flow (monthly and
annual), the climate model, plant biomass, heat islands, albedo (hourly and monthly), evaporation, precipitation and evapotranspiration
of the Ubangi basin, then analyzed with ArcGis software.
Results: The results showed that the monthly flows of the Oubangui River have dropped from 6,000 to 3,000 m3/Sec) from 1940 to the
present. The Maximum Plant Biomass Value NDVI from 1999 to 2018 shows that the Biomass has gone from 65% dense vegetation/pixel
(dense forest) to 37% dense vegetation/pixel (very degraded dense forest). The analysis on the evolution of Ground Heat Islands per pixel
shows that the temperature has evolved from 29.8°C (hot) in 1999 to 42.63°C (hot) in 2018. The ratio of energy released to energy received
from the Sun (albedo) in the Ubangi Sangha basin is in the range of 10.68 to 14.29% annual cumulative albedo. The river loses water by
free vaporization from 7 to 14 mm/day.
Conclusion: This study provides information on recent values of parameters such as: discharge (monthly and annual), climate model,
plant biomass, heat islands, albedo (hourly and monthly), evaporation, precipitation and evapotranspiration of the Ubangi River basin
for which there is not enough information in the literature
Keywords – Plant Biomass, Heat Islands, Albedo, Precipitation, Climate Model.

                                                          I. INTRODUCTION
    Global warming is one of the factors behind the disruption of the water cycle, and consequently the reduction of rainfall [1].
However, the decrease in annual flows of major African rivers is a direct consequence of the reduction in rainfall, which is reflected
in the phenomenon of drought that has marked the major African rivers in recent decades; including the Ubangi basin, where several
studies have been conducted to describe and understand its hydrological functioning and those of its various tributaries, either by
classifying the various hydrological systems in relation to their functioning, or by breaking down the rainfall regimes of each
tributary, at different phases of the hydrograph of the Congo River [1-5].

Corresponding Author: Jean Jacques D. Amogu                                                                                        167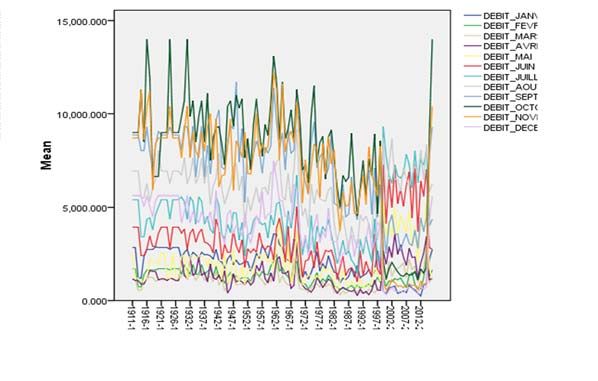
Study of the Current Situation of the Ubangi Basin in the Face of Current Geopolitical Challenges
Other works have allowed the splitting of their hydro-climatic chronicles into stationary segmentations, using statistical
procedures for detecting breaks, namely the "Buishand" test, the "Pettitt" test, the Lee-Heghinian Bayesian method and the Hubert
segmentation, which have been successfully used in the study of hydro-meteorological series of West Africa [2, 6-8]. Pandi et al,
2009 described the variations of the Oubangui river flows at the hydrometric station of Bangui and the impact of the variability of
the flows on the navigation in the Oubangui. Thus, this study was initiated to monitor the evolution of parameters such as: flow
(monthly and annual), climate model, plant biomass, heat islands, albedo (hourly and monthly), evaporation, rainfall and
evapotranspiration of the Oubangui basin [9].
II. STUDY ENVIRONMENT & METHODOLOGY
2.1 Study environment
Overview
The Oubangui River, which is 2,500 km long from the source of the Uélé, drains a basin with an area of 488,500 km2 at Bangui.
The basin has an elongated shape from east to west, with the downstream part curving southward slightly upstream from Bangui.
The length of the basin is about 1800 km, with an average width of 500 km. It extends from latitude 00°30'S to 09°16'N and from
longitude 15°35'E to 30°57'E. Its relief is a vast peneplain shaped by meteoric erosion phenomena that have succeeded one another
during Phanerozoic times. The high reliefs, which rarely exceed 1100 meters, represent only 50% of the surface of the basin. The
highest point is at 1796 meters in the Blue Mountains, in the DRC at the Congo-Nile interfluve and at the eastern end of the basin.
The plateaus, which range in altitude from 500 to 900 meters, make up 70% of the surface area and the Ubangi plains make up the
remaining 25% [9]
.
Fig.1: Overview map of the Congo River drainage network, with indication of the sampling location and the extent of the
Oubangui catchment upstream of the sampling site. Modified after Runge and Nguimalet (2005) [9].
Hydroclimatology of the Oubangui River
The climate of the Ubangi basin is characterized by a dry season that begins in October in the northeast and spreads throughout
the basin from January; an inter-season before the rainy season that begins in the south of the country in March and reaches the
north in April-May; and finally, a rainy season that affects the entire basin from June to September and lasts from the south to the
north for 9 to 4 months. Rainfall varies from 1700 mm/year in the south to less than 100 mm/year in the north, which corresponds
respectively to the transition from the Guinean forest zone to the Sudano-Guinean zone [9].
2.2 Methodology
The data for this study were collected using Landsat satellite images and those of the American Giovanni site, then analyzed
using ArcGis software in the Observatoire Spatiale de Télédétection du Climat (OSRNaC) laboratory at the Université Pédagogique
Nationale (RD Congo).
Vol. 29 No. 1 October 2021 ISSN: 2509-0119 168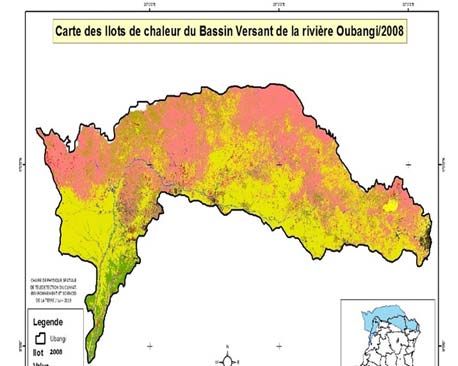
Study of the Current Situation of the Ubangi Basin in the Face of Current Geopolitical Challenges

                                                   III. RESULTS & DISCUSSION
3.1 Monthly flows of the Oubangui River from 1936-2050
   Monthly and annual flow data for the Ubangi River from 1936 to 2050 are shown in Figures 2a and 2b

  Fig.2a : Monthly flows of the Oubangui River from                  Fig.2b : Monthly flows of the Oubangui River from 1936-
             1936-2050 at the Ultraviolet                                                2050 at Infrared

                                 Source: C.T Alphonse B., NOAA/OSRNaC satellite data (2021)

   The figures below (Fig.2a and Fig.2b) show the monthly flows of the Ubangi River from 1936-2050.
    From these figures (Fig. 2a and Fig. 2b), it can be seen that the monthly flows of the UBANGI River have tended to drop by
half (6,000 to 3,000 m3/Sec) from 1940 to the present: Ubangi has no water. According to forecasts, these figures could reach 2,000
m3/Sec of flow by the year 2050. The evolution of the flows (annual and monthly) of the Ubangi, shows more or less important
oscillations that can be grouped into two major hydrological phases, as already indicated by [10-11]: - a wet phase that extends
from 1936 to 1970, characterized by excess flows, with generalized floods, the most important of which are those observed in 1936,
1941, 1948, 1961, 1963 and 1969. During this phase, the interannual flow is close to 4397 m3/s, which represents a difference of
628, i.e. an excess of 16%; - A post-1970 period which is deficient; the calculated modulus is 3141 m3/s, which corresponds to a
deficit of -28%, compared to the interannual flow of the chronic, with an accentuation of the phenomenon from 1982.
    The lowest low water flow is observed in 1990, that is 2187 m3/s. The study of the Ubangi during the different phases of flow
that characterize this century, indicates that it has undergone the greatest variations in water conditions in the Congo basin according
to [12]. With a record decrease in its runoff (-18%), the Ubangi basin is affected by the climatic variability of non-Sahelian West
Africa, marked by a strong downward trend for more than 30 years, similar to the even more intense trend that has affected the
Sahel further north. The decrease in the flow of the Ubangi River has had serious consequences for the use of its water resources,
particularly for navigation. These results corroborate with those observed by [9]. And 2018 we observe that these values are still
tending to decline and could reach 2000 m3/s by 2050.
3.2 Behaviour of the monthly flows of the Ubangi River
    The behavior of the monthly flows of the Oubangui River is given in Figure 3

Vol. 29 No. 1 October 2021                               ISSN: 2509-0119                                                          169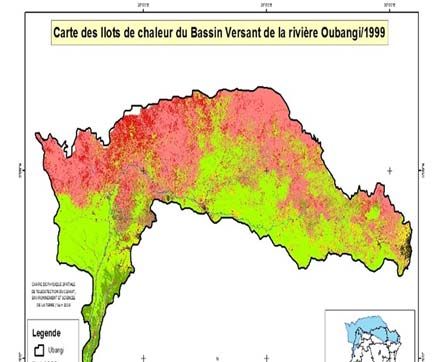
Study of the Current Situation of the Ubangi Basin in the Face of Current Geopolitical Challenges

                               Fig.3 : Behavior of the monthly flows of the Oubangui River

                             Source: C.T Alphonse B., NOAA/OSRNaC satellite data (2021)

    This figure shows that the principal component analysis of monthly flows in the Oubangui basin shows that the months of June,
July, March, August, April and May are diametrically opposed to the months of flooding, i.e. February, January, December, October
and November, with February and August being the two months with the highest flows.
3.3 Maximum Values of Plant Biomass NDVI of the Oubangui River
    The Maximum Plant Biomass NDVI values of the Oubangui River from 1999, 2008 and 2018 are shown in Figures 4a, 4b and
4c respectively

 Fig. 4a: Maximum Plant Biomass Value         Fig. 4b: Maximum Value of Plant           Fig. 4c: Maximum Value of Plant Biomass
 NDVI of the Oubangui River en 1999           Biomass NDVI of the Oubangui              NDVI of the Oubangui River in 2018

                          Source: C.T Alphonse B., NOAA/OSRNaC satellite data (2021)

Vol. 29 No. 1 October 2021                              ISSN: 2509-0119                                                      170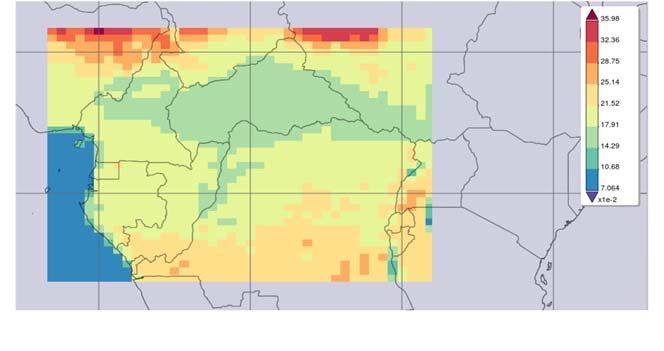
Study of the Current Situation of the Ubangi Basin in the Face of Current Geopolitical Challenges

    These figures show that the vegetation in the Ubangi basin is gradually degrading. In 1999 we had a very dense forest, in 2008
a degraded forest and in 2018 the images show us a very degraded clear forest.
3.4 Evolution of the combined NDVI Maximum Plant Biomass Values of the Oubangui River
   The evolution of the maximum combined NDVI plant biomass values of the Oubangui River from 1999 to 2018 is presented in
Figures 5a and 5b.

          Fig. 5a: Evolution of the combined NDVI Maximum Plant Biomass    Fig. 5b: Evolution of the combined NDVI Maximum Plant Biomass
                    Values of the Oubangui River from 1999 to 2018              Values of the Oubangui River from 1999 to 2018 on excel

                                  Source: C.T Alphonse B., NOAA/OSRNaC satellite data (2021)

    From these figures, it can be seen that the trend in the evolution of the Maximum Plant Biomass values of the Ubangi River
decreases from 1999 to 2018 (figures 5a, 5b and 5c). Thus, the maximum NDVI Plant Biomass values from 1998 to 2018 are shown
in Table 1.
                                Table 1: Maximum values of Plant Biomass NDVI from 1998 to 2018
          Years       Maximum Plant Biomass Value NDVI                    Pixel LANDSAT          Tendance de la Forêt
                                                                             TM
          1999        65% of dense vegetation /pixel                      30m*30m                Very Dense Forest
          2008        52% of dense vegetation /pixel                      30m*30m                Degraded Forest
          2018        37% of dense vegetation /pixel                      30m*30m                Very Degraded Clear Forest

    From this table it can be seen that the measurements of maximum values of plant biomass per pixel showed a decrease as
follows: in 1999 we have a plant density of 65% (very dense forest), in 2008 we have a plant density of 52% (degraded forest) and
then 2018 we have a plant density of 37% (very degraded light forest). These results corroborate with those found by [12-13] where
they proved that the vegetation biomass dropped by half from 1990 to 2005.
3.5 Temperature evolution in the Ubangi Basin
   The evolution of the Temperature within the Ubangi Basin from 1999 to 2018 is presented in Figures 6a, 6b and 6c.

Vol. 29 No. 1 October 2021                                   ISSN: 2509-0119                                                               171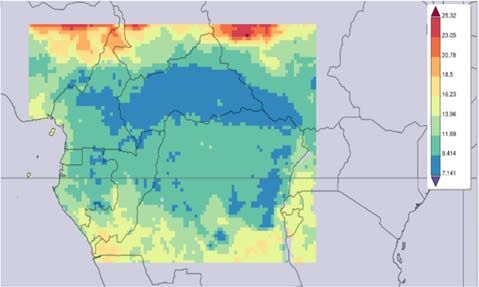
Study of the Current Situation of the Ubangi Basin in the Face of Current Geopolitical Challenges

           Fig. 6a: Temperature evolution in the Ubangi Basin          Fig. 6b: Temperature evolution in the Ubangi
                                in 1999                                               Basin in 2008

                                 Fig. 6c : Temperature trends in the Ubangi Basin in 2018

                                Source : C.T Alphonse B., données satellitaires NOAA/OSRNaC
                         Figures 6a, 6b, and 6c show how the temperature has changed from 1999 to 2018.
   The images show that the temperature has increased significantly and could get even worse by 2040.
3.6 Evolution of Ground Heat Islands by Pixel
   The evolution of Ground Heat Islands by Pixel from 1999 to 2018 is presented in Figures 7a and 7b.

Vol. 29 No. 1 October 2021                              ISSN: 2509-0119                                               172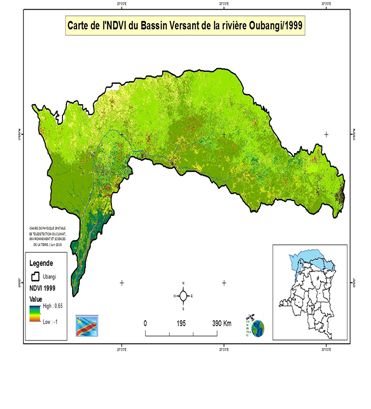
Study of the Current Situation of the Ubangi Basin in the Face of Current Geopolitical Challenges

              Fig. 7a: Evolution of ground heat islands per pixel           Fig. 7b: Evolution of ground heat islands per
                              from 1999 to 2018                                       pixel from 1999 to 2018

                                Source: C.T Alphonse B., NOAA/OSRNaC satellite data

   From these figures, it can be seen that the analysis on the evolution of Ground Heat Islands per pixel from 1999 to 2018 at the
level of the Ubangi basin is progressively increasing, whose temperature values are shown in Table 2.
                                            Tableau 2 : Ground Heat Pockets per Pixel.
          Years       Ground Heat Pockets per Pixel.                   Pixel LANDSAT TM             Observation
          1999        29,8°C                                           60m*60m                      Chaud
          2008        35,62°C                                          60m*60m                      Très Chaud
          2018        42,63°C                                          60m*60m                      Caniculaire

   It appears from this table that the analysis on the evolution of heat islands on the ground per pixel at the level of the Ubangi
basin has increased significantly from 1999, 2018 and 2018 with respective values of 29.8 ° C; 35.62 ° C and 42.63 ° C and these
values could increase significantly by 2040.
3.7 Combined evolution of vegetation - heat islands
   The combined evolution of the vegetation-heat island is given by figures 8a and 8b

      Fig. 8a: Vegetation-heat island bi-plots from 1999 to               Fig. 8b: Vegetation-heat island bi-plots from 1999
                             2018                                                              to 2018

                                Source: C.T Alphonse B., NOAA/OSRNaC satellite data (2021)

Vol. 29 No. 1 October 2021                              ISSN: 2509-0119                                                        173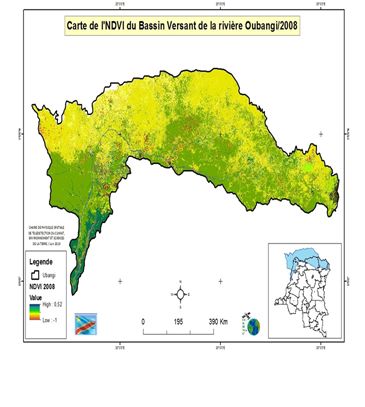
Study of the Current Situation of the Ubangi Basin in the Face of Current Geopolitical Challenges

   It can be seen from these figures that the analysis on vegetation degradation is proportional to the increase in heat.
3.8 Monthly albedo of the Oubangui River
   The monthly albedo of the Oubangui River is given in Figure 9

                                        Fig.9: Monthly albedo of the Oubangui River
                              Source: C.T Alphonse B., satellite data NOAA/OSRNaC/2021

   It appears from this figure that the ratio of energy released in relation to the energy received from the Sun in the Ubangi Sangha
Basin is in the order of 10.68 to 14.29% of cumulative annual albedo, thus an environment absorbing light rays thanks to the
Peatland.
3.9 Hourly albedo ratio of the Ubangi River
   The hourly albedo ratio for the Oubangi River is given in Figure 10.

                                 Fig. 10: Hourly albedo ration of the Oubangui River

                             Source: C.T Alphonse B., NOAA/OSRNaC satellite data (2021)

   It appears from this figure that the hourly ratio of energy released in relation to the energy received from the Sun in the Oubangui
Sangha basin is of the order of 7 to 12%, thus an environment that absorbs light rays thanks to the peat bog.
3.10 Evaporation of the Ubangi River
    The values in mm/day of evaporation from the Oubangui River are given in Figure 12

Vol. 29 No. 1 October 2021                               ISSN: 2509-0119                                                         174
Study of the Current Situation of the Ubangi Basin in the Face of Current Geopolitical Challenges

                                           Fig. 12: Evaporation from the Ubangi River

                               Source: C.T Alphonse B., satellite data (2021) NOAA/OSRNaC

   It appears from this figure that the Oubangui Sangha basin loses water by free vaporization from 7 to 14 mm/day, the lowest
value in the entire Congo Basin, thanks to the Forest and Peatland.
3.11 Rainfall trends in the Ubangi River
   The evolution of rainfall in the Ubangi River from 1936 to 2050 is shown in Figure 13

                               Fig. 13: Precipitation trends from 1936 to 2050
                                  Source: C.T Alphonse B. NOAA/OSRNaC (2021)

   This figure shows that the Ubangi basin loses more water through free evaporation when rainfall simultaneously decreases.
3.12 Evapotranspiration of the Ubangi River
   The evapotranspiration of the Oubangui River is given in Figure 14

Vol. 29 No. 1 October 2021                              ISSN: 2509-0119                                                   175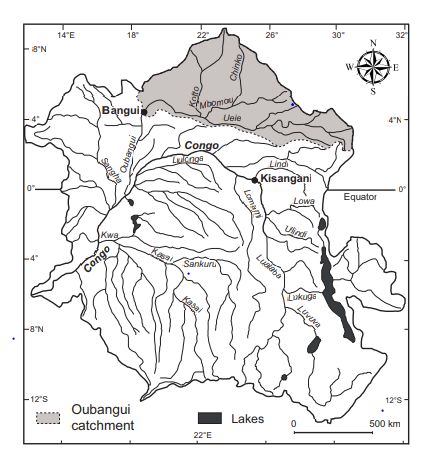
Study of the Current Situation of the Ubangi Basin in the Face of Current Geopolitical Challenges

                                            Fig. 14: Evapotranspiration of the Ubangi River

                                      Source : C.T Alphonse B., NOAA/OSRNaC          (2021)
   This figure shows that the Oubangui Sangha basin loses water through free evapotranspiration and from 243 to 325 mm/day,
thanks to the Forest and the Peatland, and this, the values in perpetual decrease according to the graphs even the graph of the
precipitations above.
                                                        IV. CONCLUSION
   The objective of this study was to provide recent data on the current situation of the Ubangi River Basin, which is facing multiple
geopolitical challenges at the moment. It emerged from this study that several parameters, including: the flow (monthly and annual),
the climate model, the plant biomass, the heat islands, the albedo (hourly and monthly), the evaporation, the rainfall and the
evapotranspiration that can ensure the survival of this basin are in a very advanced state of degradation. In such a context,
cooperation between the riparian countries of the basin becomes essential to protect the resource and organize the distribution of
uses between the various priority activities.
COMPETING INTERESTS
    Authors have declared that no competing interests exist.
AUTHORS’ CONTRIBUTIONS
   This work was carried out in collaboration among all authors. Authors AKB and JCMT designed the study. Authors, FEB and
JJDA, wrote the first draft of the manuscript, JND managed the literature searches. All authors read and approved the final
manuscript.
REFERENCES
[1] Eau et changement climatique 2010. Le mouvement des ONG françaises engagées pour l’accès à l’eau et à l’assainissement
pour tous. www.coalition-eau.org.
[2] Orange D, Féizouré C, Wesselink A et Callède J, 1995. Variabilités hydrologiques de l’Oubangui à Bangui au cours du XXe
siècle. Actes des Journées Scientifiques FRIEND-AOC, Cotonou (Bénin), 20 p.
[3] Laraque A et Pandi A, 1996. Rôle des données physiographiques dans la classification hydrologique des affluents congolais du
fleuve Congo-Zaïre. C .R. Acad. Sci. Paris ; 323 (IIa) : 855-858.
[4] Orange D, Olivry JC, Censier C, 1995. Variations et bilans de flux de matières particulières et dissoutes de l’Oubangui à Bangui
(1987 à 1992). In : Grands bassins fluviaux périatlantiques : Congo, Niger, amazone. Actes du colloque PEGI-INSU- ORSTOM,
du 22 au 24 novembre 1993, éd. Orstom, Paris, France, pp. 147-158

Vol. 29 No. 1 October 2021                              ISSN: 2509-0119                                                         176
Study of the Current Situation of the Ubangi Basin in the Face of Current Geopolitical Challenges [5] Bricquet JP ; 1995. Les écoulements du Congo à Brazzaville et la spatialisation des apports. In Grands bassins fluviaux périatlantiques : Congo, Niger, Amazone. Actes du colloque PEGI-INSU-CNRS- ORSTOM, du 22 au 24 novembre 1993, éd. Orstom, Paris, France, 27-38 [6] Hubert P, Carbonnel J P, 1989. Segmentation des séries hydrométéorologiques. Application à des séries des précipitations et de débits de l’Afrique de l’ouest. Journal of hydrologie ; 110 : 349-367 [7] Lubès H, Masson J.M, Servat E, Paturel et al., 1995. Caractérisation des fluctuations dans une série chronologique par application des tests statistiques. Etude bibliographique. Programma ICCARE. Rapport n° 3, ORSTOM, Montpellier, juin 1994. [8] Paturel J E, Servat E, Kouame B., Boyer J.F. et al., 1996. Procédures d’identification de « ruptures » dans des séries chronologiques; modification du régime pluviométrique en Afrique de l’Ouest non sahélienne. « L’hydrologie tropicale : géoscience et outil pour le développement ». IAHS Publ., n°238. [9] Pandi A, Ibiassi G, Tondo B, Ladel J. et Laraque A, 2009. Impact de la variabilité des écoulements sur la navigabilité de l’Oubangui, un affluent du fleuve Congo. Annales de l’Université Marien NGOUABI, 2009 ; 10 (1) 75-81 Lettres et Sciences Humaines ISSN : 1815-4433. [10] Laraque, A., Mahé, G., Orange, D., Marieu, B., 2001. Spatiotemporal variations in hydrological regimes within Central Africa during the twentieth century. J. Hydrology, 245(1-4), 104-117. [11] Wesselink A., Orange D., Feizoure C., Randriamiarisoa, 1996. Les régimes hydroclimatiques et hydrologiques d’un bassin- versant de type tropical humide : l’Oubangui (République Centrafricaine). In: Chevallier P. et Pouyaud B. (Eds) (1996): L’Hydrologie Tropicale: géoscience et outil pour le développement, IAHS Publ, 238, 179-194. [12] Mayaux P, Gond V, Massart M, Michelle Pain-Orcet et Achard F, 2003. Evolution du couvert forestier du bassin du Congo mesurée par télédétection spatiale. Bois et foret des tropiques, 277(3). [13] Hansen, J., M. Sato, P. Kharecha, D. Beerling, R. Berner, V. Masson-Delmotte, M. Pagani, M. Raymo, D.L. Royer, and J.C. Zachos, 2008: Target atmospheric CO2: Where should humanity aim? Open Atmos. Sci. J., 2, 217-231. Vol. 29 No. 1 October 2021 ISSN: 2509-0119 177
You can also read