Sugar and Sweeteners Outlook: February 2023
←
→
Page content transcription
If your browser does not render page correctly, please read the page content below

Economic Research Service | Situation and Outlook Report

                          SSS-M-414 | February 14, 2023                  Next release is March 14, 2023

 Sugar and Sweeteners                                                               In this report:

 Outlook: February 2023                                                             U.S. Sugar Outlook
                                                                                    Mexico Sugar Outlook
                                                                                    Special Article: Sidney
 Vidalina Abadam, coordinator                                                       Sugars Beet Sugar
                                                                                    Factory to Close

   U.S. Sugar Supply Higher; Mexican Balance
   Sheet Mostly Unchanged
   In the February 2023 World Agricultural Supply and Demand Estimates (WASDE), the 2022/23
   U.S. total sugar supply is reduced from last month by 10,000 short tons, raw value (STRV) to
   14.514 million as the increase in beet sugar production and imports are offset by the decline in
   cane sugar production. Total imports are increased marginally to incorporate an upward
   revision in the portion of the 2021/22 World Trade Organization (WTO) raw sugar tariff-rate
   quota (TRQ) imports that were granted extension and arrived in December. The forecast for
   high-tier imports remains at 125,000 STRV. With the forecast for total use unchanged at
   12.640 million STRV, ending stocks are lowered from last month by 10,000 to 1.874 million.
   The resulting ending stocks-to-use ratio is 14.8 percent, down by 0.1 percentage point
   compared with last month.

   The 2022/23 Mexican supply and use balance sheet is unchanged from last month, except for
   a slight increase in exports to countries other than the United States and a concurrent
   decrease in domestic sugar deliveries. The forecast for Mexican sugar production remains at
   5.9 million metric tons (MT). Per the terms of the U.S.-Mexico Sugar Suspension Agreements,
   the final 2022/23 Mexican Export Limit based on a 13.5-percent U.S. stocks-to-use will be
   calculated by the U.S. Department of Commerce (DOC) next month using information from the
   March WASDE.

Approved by USDA’s World Agricultural Outlook Board
U.S. Outlook Summary
U.S. Sugar Supply Decreased; Use Unchanged
In the February 2023 WASDE, the 2022/23 U.S. total sugar supply is reduced by 10,000 short
tons, raw value (STRV) to 14.514 million from last month as the increase in beet sugar
production and imports are offset by the decline in cane sugar production (table 1).

Beet sugar production in 2022/23 is raised by 52,000 STRV to 5.100 million from last month on
an increased forecast of sucrose recovery based on processors data from August‒December
reported in the USDA, Farm Service Agency Sweetener Market Data (SMD). The effect of the
higher sucrose recovery offsets the projected reduction in early August‒September 2023 sugar
production due to the closure of the Sidney Sugars beet processing plant. Cane sugar
production is reduced by 68,000 STRV to 4.131 million from last month as the 24,000-STRV
increase in Florida is countered by the over-the-month reduction in Louisiana and Texas by
83,000 and 10,000, respectively. With the cane sugar production decrease offsetting the beet
sugar production increase, total sugar production in 2022/23 is reduced by 16,000 STRV to
9.231 million from last month (figure 1).

Total imports in 2022/23 are increased by 5,000 STRV to 3.463 million from last month. This
reflects an upward revision in the 2021/22 raw sugar imports that arrived in December since the
entry for the quota was extended through the end of 2022. The rest of the import categories are
unchanged, including the 125,000-STRV forecast for high-tier imports.

With the forecast for total use unchanged at 12.640 million STRV, ending stocks are lowered by
10,000 to 1.874 million from last month. The resulting ending stocks-to-use ratio is 14.8 percent,
down by 0.1 percentage point compared with last month.

                                                  2
              Sugar and Sweeteners Outlook: February 2023, SSS-M-414, February 14, 2023
                                 USDA, Economic Research Service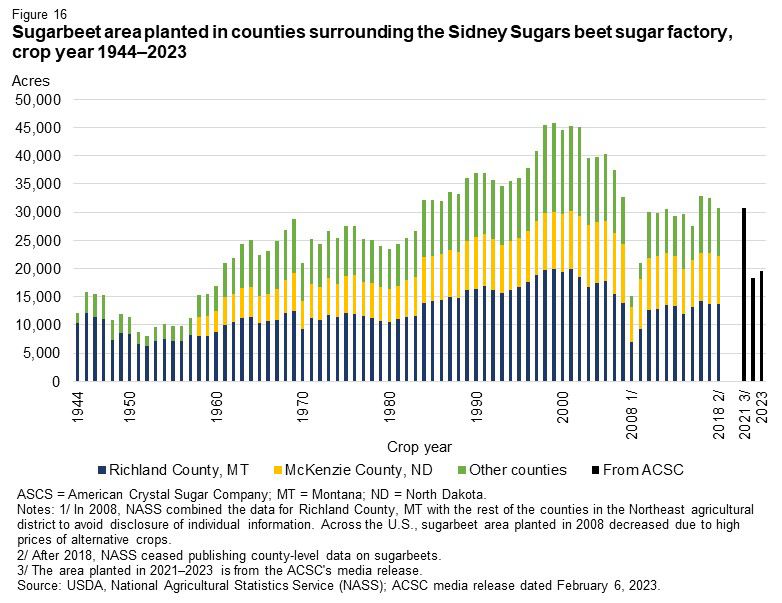
Table 1: U.S. sugar: supply and use by fiscal year (October/September), February 2023
Items                                                 2020/21                 2021/22                                  2022/23
                                                         Final     January     February     Monthly         January      February    Monthly
                                                                 (estimate)   (estimate)    change        (forecast)    (forecast)   change
                                                                                      1,000 short tons raw value
Beginning stocks                                         1,618       1,705        1,705            0        1,819           1,820         2

Total production                                         9,233       9,156        9,157           2           9,248         9,231        -16
 Beet sugar                                              5,092       5,155        5,155           0           5,048         5,100         52
 Cane sugar                                              4,141       4,000        4,002           2           4,199         4,131        -68
   Florida                                               2,090       1,933        1,934           2           1,989         2,014         24
   Louisiana                                             1,918       1,944        1,944           0           2,113         2,030        -83
   Texas                                                   134         124          124           0              97            87        -10

Total imports                                            3,221       3,646        3,646           0           3,458         3,463         5
 Tariff-rate quota imports                               1,749       1,579        1,579           0           1,606         1,611         5
 Other program imports                                     292         298          298           0             250           250         0
 Non-program imports                                     1,180       1,769        1,769           0           1,602         1,602         0
   Mexico                                                  968       1,379        1,379           0           1,477         1,477         0
   High-duty                                               212         390          390           0             125           125         0

Total supply                                            14,072      14,506       14,508           2         14,525        14,514         -10

Total exports                                               49          29           29           0              35            35         0

Miscellaneous                                               40          81           81           0               0             0         0

Total deliveries                                        12,277      12,578       12,578           0         12,605        12,605          0
 Domestic food and beverage use                         12,161      12,470       12,470           0         12,500        12,500          0
 To sugar-containing products re-export program             89          80           80           0             80            80          0
 For polyhydric alcohol, feed, other alcohol                27          27           27           0             25            25          0
 Commodity Credit Corporation (CCC) for ethanol              0           0            0           0              0             0          0

Total use                                               12,367      12,688       12,688           0         12,640        12,640          0

Ending stocks                                            1,705       1,819        1,820           2           1,885         1,874        -10
Private                                                  1,705       1,819        1,820           2           1,885         1,874        -10
Commodity Credit Corporation                                 0           0            0           0               0             0          0

Stocks-to-use ratio (percent)                              13.8          14.3       14.3         0.0           14.9          14.8       -0.1
Source: USDA, World Agriculural Outlook Board, World Agricultural Supply and Demand Estimates (WASDE) .

                                                        3
                    Sugar and Sweeteners Outlook: February 2023, SSS-M-414, February 14, 2023
                                       USDA, Economic Research Service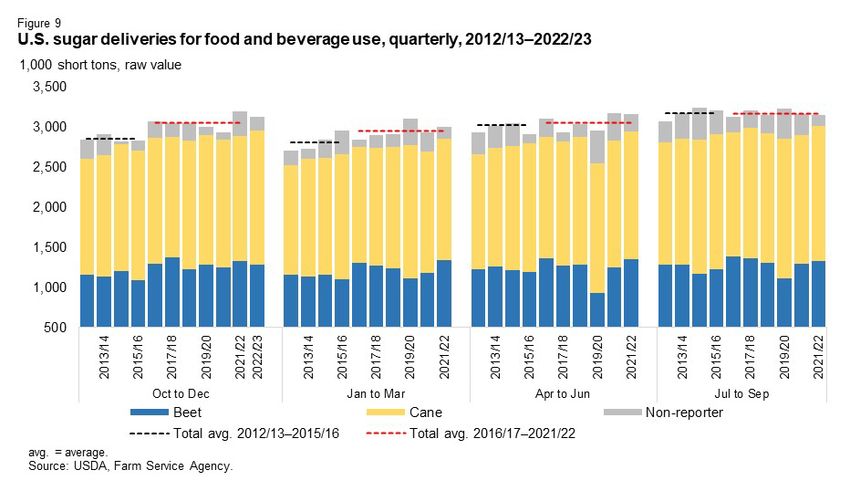
Beet Sugar Production Raised
Beet sugar production in fiscal year 2022/23 is raised by 52,000 STRV to 5.1 million from last
month as the 62,000-STRV increase in crop year production offsets the 10,000-STRV reduction
in the August–September 2023 production due to the impending closure of the beet facility in
Sidney, Montana (table 2). The closing is the topic of a Special Article starting on page 19.

Crop year sugar production increased by 62,000 STRV to 4.614 million STRV from last month
due to the increased expectation for sugar recovery. Sucrose recovery is raised from 15 percent
last month to 15.204 based on a statistical relationship of the recovery between the 5-month
period and the full crop year season. This is still lower than the cumulative sucrose recovery
from the August–December SMD sugar production data of 15.433 percent–the largest over the
5-month period in the last decade (figure 2). A regional breakdown shows that recovery rates
across the major sugarbeet producing regions (Red River Valley, Great Lakes, Great Plains,
and Pacific Northwest) are above their respective 10-year averages, indicating that the relatively
high recovery is not driven by a single region.

Table 2: Beet sugar production calculations, 2019/20‒2020/23
                                                                 2020/21     2022/23    Monthly     2022/23     2022/23    Monthly
                                                                    Final   February    change      January    February    change
Sugarbeet production (1,000 short tons) 1/                        33,610      36,751          0      32,574      32,574          0
Sugarbeet shrink (percent)                                          6.60         7.9        0.0         6.8        6.83        0.0
Sugarbeet sliced (1,000 short tons)                               31,392      33,850          0      30,348      30,348          0
Sugar extraction rate from slice (percent)                         15.34       14.63          0       15.00       15.20      0.20
Sugar from beets sliced (1,000 STRV) 2/                            4,817       4,954          0       4,552       4,614         62
Sugar from molasses (1,000 STRV) 2/                                  362         341          0         360         360          0
Crop year sugar production (1,000 STRV) 2/                         5,181       5,294          0       4,912       4,974         62
Aug.–Sep. sugar production (1,000 STRV)                              765         676          0         537         537          0
Aug.–Sep. sugar production of subsequent crop (1,000 STRV)           676         537          0         643         633        -10
Sugar from imported beets (1,000 STRV) 3/                            N/A         N/A       N/A           30          30          0
Fiscal year sugar production (1,000 STRV)                          5,092       5,155          0       5,048       5,100         52
STRV = short tons, raw value; NA = not applicable.
1/ USDA, National Agricultural Statistics Service.
2/ August–July.
3/ Sugar from imported beets in 2020/21 and 2021/22 are already included in the crop year production. Typically, this component
is separated for projections and included in total once full crop year slice is available.
Source: USDA, Economic Research Service; USDA, World Agricultural Outlook Board; USDA, Farm Service Agency.

                                                     4
                 Sugar and Sweeteners Outlook: February 2023, SSS-M-414, February 14, 2023
                                    USDA, Economic Research Service
Cane Sugar Production Lowered
U.S. cane sugar production in fiscal year 2022/23 is reduced by 68,000 STRV to 4.131 million
from last month as the 24,000-STRV increase in Florida is offset by the 83,000 and 10,000
decreases in Louisiana and Texas, respectively (table 3). Nonetheless, this reflects a 129,000-
STRV increase (3 percent) from last year’s cane sugar production (4.002 million) and would be
the second largest in the last two decades behind 2020/21 (4.142 million).

Louisiana cane sugar production in fiscal year 2022/23 is reduced by 83,000 STRV to 2.030
million from last month based on USDA’s communication with sugar mills; the NASS February
Crop Production report did not contain updates for Louisiana. With the campaign over by
January 21, the revised estimate reflects the processors’ final assessment of sugarcane yield
reduction due to the freeze in late December when temperatures dropped to 25 degrees
Fahrenheit (°F) then warmed to about 65°F. The rapid shift in temperatures led to freeze-
affected sugarcane plants deteriorating faster and reduced the recoverable sugar. Despite the
reduction, the updated forecast of 2.030 million STRV, if realized, would still be a record. If
realized, this would mark the first time that the State produced more than 2 million STRV of
sugar and would surpass last year’s 1.944 million by 86,000 STRV or 4 percent. Strong sugar
production in both 2021/22 and 2022/23 indicates that Louisiana has produced more sugar than
                                                  5
              Sugar and Sweeteners Outlook: February 2023, SSS-M-414, February 14, 2023
                                 USDA, Economic Research Service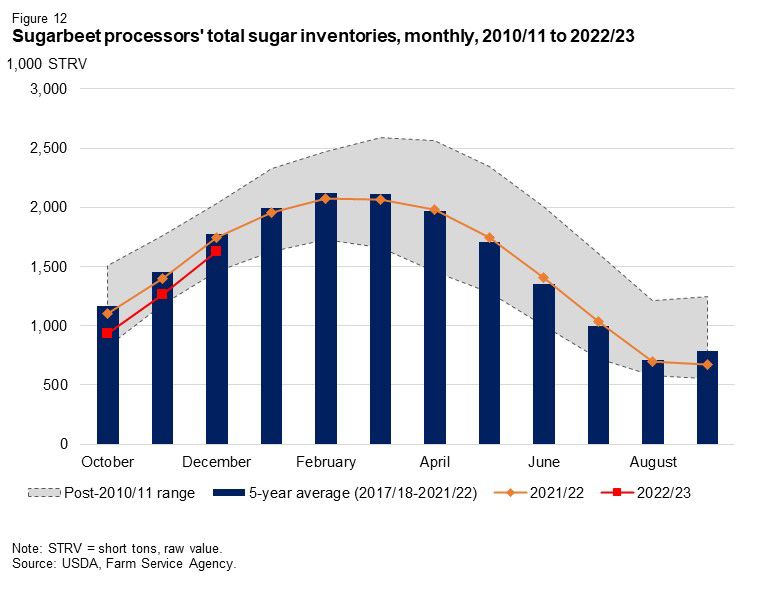
Florida in consecutive years for the first time since 2002/03.

Table 3: U.S. sugarcane and cane sugar production, by State, 2017/18–2022/23
                                                                                      2021/22        2021/22         2022/23          2022/23       2022/23 monthly
                                                                        2020/21
                                                                                        Jan.          Feb.             Jan.            Feb.         change (percent)
Florida
 Sugarcane harvested for sugar and seed (1,000 acres)   423.3                           403.5           403.5           396.5            397.9              0.4
 Sugarcane harvested for sugar (1,000 acres)            409.0                           388.0           388.0           382.2            382.0              0.0
 Sugarcane yield (short tons per acre)                   44.3                            42.4            42.4            44.0             44.3              0.7
 Sugarcane production (1,000 net tons)                 18,119                          16,451          16,451          16,815           16,923              0.6
 Recovery rate (percent)                                11.53                           11.75           11.76           11.83            11.90              0.6
 Sugar production (1,000 STRV)                          2,090                           1,933           1,934           1,989            2,014              1.2
Louisiana
 Sugarcane harvested for sugar and seed (1,000 acres)   488.4                           495.3           495.3           497.8            497.8               0.0
 Sugarcane harvested for sugar (1,000 acres)            461.0                           466.0           466.0           475.0            475.0               0.0
 Sugarcane yield (short tons per acre)                   32.9                            29.0            29.0            33.3             33.3               0.0
 Sugarcane production (1,000 net tons)                 15,167                          13,514          13,514          15,818           15,818               0.0
 Recovery rate (percent)                                13.03                           13.92           13.92           13.48            12.97              -3.8
 Crop year sugar production (1,000 STRV) 1/             1,976                           1,881           1,881           2,133            2,051              -3.8
 Sep. sugar production (1,000 STRV)                        70                              12              12              75               75               0.0
 Sep. sugar production of subsequant crop (1,000 STRV)     12                              56              75              55               55               0.0
 Fiscal year sugar production (1,000 STRV) 1/           1,918                           1,924           1,944           2,113            2,030              -3.9
Texas
 Sugarcane harvested for sugar and seed (1,000 acres)    35.9                            36.4             36.4            32.0            32.0              0.0
 Sugarcane harvested for sugar (1,000 acres)             33.4                            34.3             34.3              30              30              0.0
 Sugarcane yield (short tons per acre)                   31.5                            30.8             30.8           25.00           25.00              0.0
 Sugarcane production (1,000 net tons)                  1,052                           1,056            1,056             760             760              0.0
 Recovery rate (percent)                                12.00                           11.78            11.72           12.76           11.47             -10.1
 Sugar production (1,000 STRV)                            134                             124              124              97              87             -10.1
United States
 Sugarcane harvested for sugar and seed (1,000 acres)   947.6                           935.2           935.2           926.3            927.7               0.2
 Sugarcane harvested for sugar (1,000 acres)            903.4                           888.3           888.3           887.6            887.4               0.0
 Sugarcane production (1,000 net tons)                   38.0                            34.9            34.9            37.6             37.8               0.3
 Sugarcane production (1,000 short tons)               34,338                          31,021          31,021          33,393           33,500               0.3
 Recovery rate (percent)                                 12.2                           12.69            12.7            12.6             12.4              -1.9
 Crop year sugar production (1,000 STRV)                4,200                           3,938           3,939           4,219            4,152              -1.6
 Fiscal year sugar production (1,000 STRV)              4,142                           3,982           4,002           4,199            4,131              -1.6
STRV = short tons, raw value.
1/ Louisiana's harvest and processing of sugarcane begins typically in September, thus the crop year and fiscal year sugar production for this State tend to be
slightly different. Fiscal year production is the final value used for official USDA estimates. For Florida and Texas, the crop year is the same as the fiscal year.
Source: USDA, Farm Service Agency; USDA, National Agricultural Statistics Service; USDA, World Agricultural Outlook Board.

Texas cane sugar production in 2022/23 is reduced by 10,000 STRV to 87,000, based on
processor reporting of lower sugarcane yield and recovery rate in the SMD since NASS did not
have updates for the State. This would be a 37,000-STRV reduction (30 percent) from last
year’s 124,000 and would be 199,000-STRV lower (58 percent) than the State’s record-high
production of 206,000 STRV since 2000/01 (figure 3)

                                                           6
                       Sugar and Sweeteners Outlook: February 2023, SSS-M-414, February 14, 2023
                                          USDA, Economic Research Service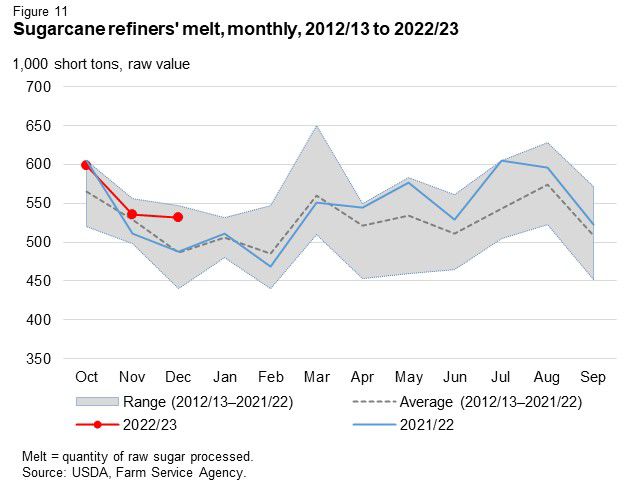
Florida cane sugar production in fiscal year 2022/23 is increased by 24,000 STRV to 2.014
million from last month based on updated processors’ forecast in the SMD that reflect higher
expectations for harvested acreage and sugarcane yield. This aligns with the NASS Crop
Production report which likewise increased total harvested area and sugarcane yield for the
State. The cane sugar production of 2.014 million-STRV implies a 79,000-STRV increase from
last year (1.934 million), which was affected by an unusual freeze event in January 2020. If the
2022/23 sugar production is realized, this would put Florida back to producing at least 2 million
tons, which it has been doing for the past decade except for last year and 2017/18 (1.983
million) (figure 4).

In the first fiscal year quarter of the campaign, the Florida produced 632,000 STRV of sugar or
31 percent of the 2.014 million-STRV fiscal year forecast. This is the second lowest October‒
December production since fiscal year 2015/16 as hurricanes Ian and Nicole caused a brief
stoppage to harvest operations in September and November, respectively. But as seen during
the 2020/21 campaign‒which posted the slowest production pace over the same period also
due to a rain-delayed November harvest‒the State can ramp up production in the succeeding
months to make up for lost time and extend the campaign into June if necessary.

                                                   7
               Sugar and Sweeteners Outlook: February 2023, SSS-M-414, February 14, 2023
                                  USDA, Economic Research Service
Minimal Change to Total Imports
The 2022/23 import forecast is revised upwards by 5,000 STRV to 3.463 million, which would
be 183,000 lower than last year (3.646 million) (figure 5). The increase is solely attributed to
the upward adjustment to the fiscal year 2021/22 World Trade Organization (WTO) raw sugar
tariff-rate quota (TRQ) that entered in December 2022. Imports from the prior fiscal year were
granted an extension through December, and thus accounted for in the 2022/23 ledger.
There were no changes for the other import categories.

Based on the USDA, Foreign Agriculture Service (FAS) U.S. Sugar Monthly Import and Re-
Exports report in February, total imports between October 2022‒January 2023 were 1.115
million STRV (table 4). This volume is larger than the 5-year average (1.073 million STRV)
over the same 4 months, but lower than last year’s pace by 59,000. Cumulative imports from
Mexico (218,000 STRV) are ahead of last year by 41,000, and imports under the WTO raw
and refined sugar TRQs are marginally higher; though both are offset by the lower pace of
imports under the re-export program, high-duty, and Free Trade Agreement (FTA) TRQs,
which are lower than 2021/22 by 70,000 STRV, 21,000 and 18,000, respectively.

                                                  8
              Sugar and Sweeteners Outlook: February 2023, SSS-M-414, February 14, 2023
                                 USDA, Economic Research Service
Table 4: Pace to date of U.S. sugar imports by type, October to December, 2017/18 to 2022/23
                                                                                             2021/22    2022/23          5-year
                                                                                                                                         Over-the-year change
                                          2017/18      2018/19       2019/20     2020/21       est.       proj.          average
To-date: October to January                                         1,000 short tons, raw value (STRV)                                       STRV          Percent
  Mexico                                         128          86           85           81          177        218              111             41            23.3
  WTO raw sugar TRQ                              700         522          587          644          594        598              610              3             0.6
   WTO refined sugar TRQ                         120         124          131          101          142        146              124              4             3.0
   FTA sugar TRQ                                  41          45           68           44           57         39               51            -18           -31.3
   Re-export program                              96         191          207           50           94         24              127            -70           -74.0
   High-duty sugar                                 5          33           29           71          112         91               50            -21           -18.9
    Total                                      1,090       1,001        1,107          991       1,175      1,115             1,073            -59            -5.1

Fiscal year: October to September                                   1,000 short tons, raw value (STRV)                                       STRV          Percent
   Mexico                                      1,223       1,000        1,376          968       1,379         1,477          1,189             98             7.1
   WTO raw sugar TRQ                           1,272       1,144        1,468        1,296       1,096         1,146          1,272             50             4.5
   WTO refined sugar TRQ                         190         207          408          217         237           241            248              4             1.8
   FTA sugar TRQ                                 202         190          276          236         246           223            223            -22            -9.0
   Re-export program                             326         438          432          292         298           250            382            -48           -16.1
   High-duty sugar                                64          91          183          186         390           125            107           -265           -68.0
    Total                                      3,277       3,070        4,143        3,195       3,646         3,463          3,387           -183            -5.0

Share of to-date to fiscal year total                                            Percent                                                Percentage
  Mexico                                          10            9           6            8           13           15               11             2
  WTO raw sugar TRQ                               55           46          40           50           54           52               46            -2
  WTO refined sugar TRQ                           63           60          32           47           60           60               50             1
  FTA sugar TRQ                                   20           24          25           19           23           17               24            -6
  Re-export program                               29           44          48           17           32           10               33           -22
  High-duty sugar                                  8           36          16           38           29           72               25            44
   Total                                          33           33          27           31           32           32               31             0
WTO = World Trade Organization; TRQ = tariff-rate quota; FTA = free trade agreement; est. = estimated; proj. = projected.
Note: Using the "Total" category, the share is interpreted as follows: The total imports of 494,000 STRV from October to November represent 14 percent of the total
fiscal year imports.
Source: USDA, Foreign Agricultural Service.

                                                         9
                     Sugar and Sweeteners Outlook: February 2023, SSS-M-414, February 14, 2023
                                        USDA, Economic Research Service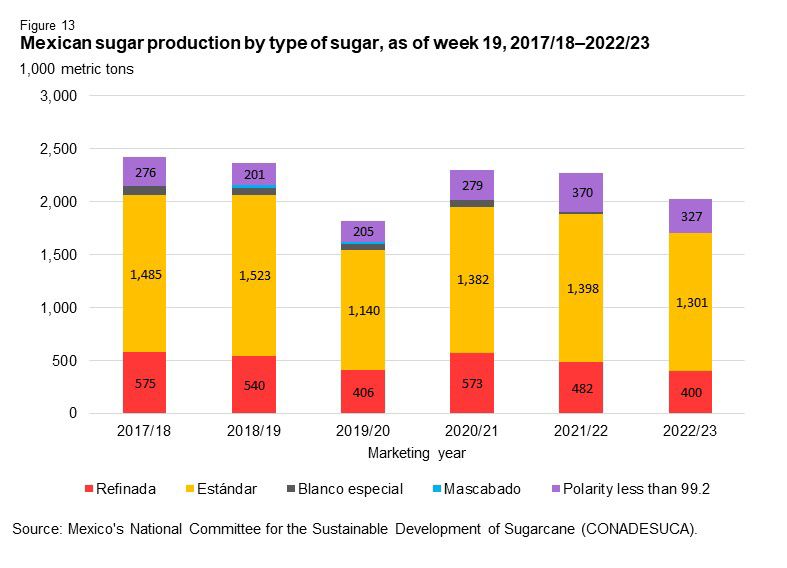
Imports From Mexico Surged in January
The cumulative imports from Mexico between October 2022 and January 2023 of 218,000
STRV is the strongest during this period since 2017/18. This pace to date volume is larger
than last year and the 5-year average by 41,000 and 106,000, respectively. The strong pace
is mainly driven by imports during the last two months (figure 6). While the pace was
relatively slow in October and November, it picked up in December and particularly in
January. The volume in December (63,000 STRV) came close to matching last year’s 56,000,
the 5-year high. The 137,000-STRV of sugar imports in January is almost twice the amount of
the prior 5-year high in 2017/18 (71,000). At 218,000 STRV, imports from Mexico to date
would represent 15 percent of the projected 2022/23 U.S. Needs (1.477 million) that the U.S.
Department of Commerce’s (DOC) calculated in December 2022. Per the terms of the U.S.-
Mexico Sugar Suspension Agreements, the final 2022/23 Mexican Export Limit will be
calculated by DOC next month using the information from the March WASDE.

                                                10
             Sugar and Sweeteners Outlook: February 2023, SSS-M-414, February 14, 2023
                                USDA, Economic Research Service
Fiscal Year 2022/23 Sugar Deliveries Unchanged
No changes are made to the fiscal year 2022/23 projected sugar use of 12.605 million STRV.
The major subcomponent, domestic food and beverage use deliveries, remains at 12.500
million STRV, reflecting a 27,000-STRV increase (0.2 percent) from 12.470 million in 2021/22.
Pace-to-date methods using average monthly and quarterly shares, as well as a suite of
regression analyses, provide no compelling evidence to change the forecast of sugar deliveries
for food and beverage use based on the October–December deliveries data.
The first quarter (Q1) of fiscal year 2022/23 deliveries amounts to 3.121 million STRV, which
are 68,000-STRV lower (2 percent) than last year as the stronger pace of the cane refiners is
offset by the slower pace of beet processors and particularly of non-reporters (table 5).
However, while lower than last year, this Q1 volume would be the second largest since 2012/13,
and reflect a continuity of a trend, starting in 2016/17, characterized by the increased volume in
fiscal Q1 deliveries relative to the other quarters (figure 9)
Table 5: Food and beverage deliveries, October–December, 2017/18–2022/23
2017/18 2018/19 2019/20 2020/21 2021/22 est. 2022/23 proj. Annual change
1,000 short tons, raw value (STRV) 1,000 STRV Percent
Beet sugar processors 1,372 1,222 1,277 1,242 1,319 1,279 -40 -3
Cane sugar refiners 1,491 1,597 1,612 1,590 1,559 1,668 109 7
Non-reporter (direct consumption) 180 221 107 95 311 175 -137 -44
Total 3,043 3,039 2,995 2,927 3,189 3,121 -68 -2
Percent share in total 5-year average
Beet sugar processors 45 40 43 42 41 41 42
Cane sugar refiners 49 53 54 54 49 53 52
Non-reporter (direct consumption) 6 7 4 3 10 6 6
Total 100 100 100 100 100 100 100
est. = estimated; proj. = projected.
Source: USDA, Farm Service Agency.
Cane sugar deliveries in December amounted to 525,000 STRV, which is second only to
2019/20’s record-high of 536,000 (figure 10). The uptick was perceptible since deliveries in
December tend to be slower relative to the other months because of the holiday season
slowdown.
Combined with the similarly high October deliveries, cane sugar cumulative deliveries during the
first 3 months of the fiscal year were 1.668 million STRV. This volume represents a new high for
the quarter overtaking the previous record of 1.629 million STRV in 2015/16 and is 109,000-
STRV (4 percent) more than last year’s 311,000. The strong pace in cane sugar deliveries is
11
Sugar and Sweeteners Outlook: February 2023, SSS-M-414, February 14, 2023
USDA, Economic Research Servicesupported by the elevated pattern of the cane refiners’ melt over the same 3-month period
(figure 11) since cane refiners typically melt raw cane sugar when there is a contemporaneous
customer delivery to be fulfilled. It is costly to store and maintain the quality of refined sugar in
inventory for uncontracted needs. The cane refiners’ record-high raw sugar stock holding at the
end of December (590,000-STRV) reflects an adequate raw sugar supply, partly due to USDA’s
actions and larger-than-usual high-tier raw sugar imports last year, which in turn is expected to
enable the sector to fulfill orders particularly during the busy spring and summer seasons.
On the other hand, cumulative beet sugar deliveries through December are 1.279 million STRV,
40,000-STRV less (2 percent) compared with last year’s pace. The slower pace can be
attributed to several factors including this year’s lower-than-average beginning stocks (figure
12), delays in the 2022/23 harvest start dates, and the lack of spot sales. Non-reporters
delivered 175,000 STRV of sugar through December, which is 137,000-STRV lower (44
percent) than last year’s Q1 record of 311,000, but in line with the 5-year average (183,000).
12
Sugar and Sweeteners Outlook: February 2023, SSS-M-414, February 14, 2023
USDA, Economic Research Service13
Sugar and Sweeteners Outlook: February 2023, SSS-M-414, February 14, 2023
USDA, Economic Research Service14
Sugar and Sweeteners Outlook: February 2023, SSS-M-414, February 14, 2023
USDA, Economic Research ServiceMexico Outlook
Sugar Production Unchanged; Pace to Date Continues to
Lag
The 2022/23 Mexican supply and use balance sheet is unchanged from last month, except for a
slight 1000-metric ton (MT) increase in exports to countries other than the United States based
on pace- to- date information from the Mexican National Committee for the Sustainable
Development of Sugarcane (CONADESUCA). Consequently, with the 2022/23 stocks pegged
to a 2.5-months’ worth of supply (971,000 MT), deliveries to the Industria Manufacturera,
Maquiladora y de Servicios de Exportación (IMMEX) program are adjusted down by the same
amount to accommodate the increase in exports.
Table 6: Mexican sugar: supply and use by fiscal year (October/September), February 2023
Items 2020/21 2021/22 2022/23
Final January February Monthly January February Monthly
(estimate) (estimate) change (forecast) (forecast) change
1,000 metric tons, actual weight
Beginning stocks 858 1,053 1,053 0 964 964 0
Production 5,715 6,185 6,185 0 5,900 5,900 0
Imports 65 31 31 0 35 35 0
Imports for consumption 32 7 7 0 10 10 0
Imports for sugar-containing product exports (IMMEX) 1/ 33 24 24 0 25 25 0
Total supply 6,638 7,269 7,269 0 6,899 6,899 0
Disappearance
Human consumption 3,935 4,113 4,113 0 4,168 4,168 0
For sugar-containing product exports (IMMEX) 485 532 532 0 493 493 -1
Other deliveries and end-of-year statistical adjustment -16 -16
Total 4,420 4,629 4,629 0 4,661 4,660 -1
Exports 1,165 1,676 1,676 0 1,267 1,268 1
Exports to the United States and Puerto Rico 828 1,180 1,180 0 1,264 1,264 0
Exports to other countries 337 495 495 0 3 4 1
Total use 5,585 6,305 6,305 0 5,928 5,928 0
Ending stocks 1,053 964 964 0 971 971 0
Stocks-to-human consumption (percent) 26.8 23.4 23.4 0 23.3 23.3 0
Stocks-to-use (percent) 18.9 15.3 15.3 0 16.4 16.4 0
High-fructose corn syrup (HFCS) consumption (dry weight) 1,320 1,291 1,291 0 1,291 1,291 0
1/ IMMEX = Industria Manufacturera, Maquiladora y de Servicios de Exportación.
Sources: USDA, World Agricultural Outlook Board; Mexico’s National Committee for the Sustainable Development of Sugarcane (CONADESUCA).
The forecast for Mexican sugar production remains at 5.9 million MT, a 2.6-percent decline from
last year’s 6.185 million MT, and lower than CONADESUCA’s 6.025 million-MT forecast. The
cumulative sugar production of 2.065 million MT through the nineteenth week of campaign (as
15
Sugar and Sweeteners Outlook: February 2023, SSS-M-414, February 14, 2023
USDA, Economic Research Serviceof February 4) is about 9 percent behind last year’s 2.275 million and is second lowest in the
last 5 years after 2019/20 (table 7). As noted by the USDA Foreign Agricultural Service (FAS)
post in Mexico City, most mills’ start dates were delayed this season due to unfavorable late
rains that prevented the timely harvest of sugarcane and its transportation to mills. While this
year’s harvested area finally caught up and surpassed both last year and the 5-year average
through the same date, cumulative sugarcane yields, and sucrose recovery are behind (table
4). As such, production across the different sugar types, particularly for refinada (refined sugar),
remains lagging (figure 13).
Table 7: Mexican sugar production as of week 18, 2021/22, 2022/23, and five-year average
As of week 19 Difference vs. 2021/22 Difference vs. 5-year average
5-year average
2021/22 2022/23 (2017/18–2021/22) Level Percent Level Percent
Area harvested (ha) 277,823 288,572 282,712 10,749 4 5,860 2
Sugarcane processed (MT) 21,588,105 20,194,670 21,552,663 -1,393,435 -6 -1,357,993 -6
Sugarcane yield (MT per ha) 77.70 69.98 76.16 -7.7 -10 -6.2 -8
Number of mills in operation 49 48 50 -1 -2 -2 -3
Extraction rate (percent) 10.54 10.23 10.35 -0.31 -3 -0.12 -1
Total factory yield (MT per sugar ha) 8.19 7.16 7.89 -1.03 -13 -0.73 -9
Sugar production (metric tons) 2,274,491 2,065,174 2,234,947 -209,317 -9 -169,773 -8
ha = hectares; MT = metric tons.
Source: USDA, Economic Research Service calculations using data from Mexico's National Committee for the Sustainable Development of Sugarcane
(CONADESUCA).
16
Sugar and Sweeteners Outlook: February 2023, SSS-M-414, February 14, 2023
USDA, Economic Research ServiceUSDA and CONADESUCA production forecasts have comparable expectations for yield (64.06
MT per hectare) and sucrose recovery (11.3 percent). The forecasts differ in area harvested,
with USDA at 814,850 hectares and the latter at 832,245 hectares. Both of which, if realized,
would be new records overtaking the prior high of 804,060 hectares in 2018/19. Given the
relatively slower pace to date, achieving either would require acceleration in the coming weeks
and/or extension of the campaign beyond the normal timeline.
Historically, Mexico’s sugar production typically winds down by mid-April and concludes by late
June. Production is highly determined by the length of the harvest campaign, which in turn, is
dependent on the onset of the rainy season. Wet conditions make it very challenging to
continue harvest operations and complicates the transportation of sugarcane to the mills in
areas with poor road conditions. If dry conditions continue into May and June, the season can
be extended which allows for additional area to be harvested and supports more sugar
production. The FAS post in Mexico City, however, noted that the climatological forecast for
April to June indicates above average precipitation in most sugarcane producing regions, which
may reduce the possibility for an extended season. A sensitivity analysis, assuming an 11.3
percent sucrose recovery, demonstrates that the forecast can be as low as 5.600 million MT if
harvested acres and sugarcane yields turned out be smaller (table 8). A concern is whether
Mexico can produce enough sugar, particularly the type below the 99.2 polarity, to fill its export
quota to the U.S. The current USDA projection will be reevaluated next month as additional
data are expected to increase the statistical validity of forecast based on progress to date.
Table 8: Mexican sugar production scenarios for the 2022/23 crop year assuming an 11.3 percent sucrose recovery
Yield (metric ton per hectare)
63.00 63.50 64.06 64.50 65.00 65.50 66.00 66.50 67.00
1,000 metric tons, actual value
785,000 5,588 5,633 5,682 5,721 5,766 5,810 5,855 5,899 5,943
790,000 5,624 5,669 5,719 5,758 5,803 5,847 5,892 5,936 5,981
795,000 5,660 5,705 5,755 5,794 5,839 5,884 5,929 5,974 6,019
800,000 5,695 5,740 5,791 5,831 5,876 5,921 5,966 6,012 6,057
Harvested
804,060 1/ 5,724 5,770 5,820 5,860 5,906 5,951 5,997 6,042 6,088
area
810,000 5,766 5,812 5,863 5,904 5,949 5,995 6,041 6,087 6,133
(hectares)
814,850 2/ 5,801 5,847 5,899 5,939 5,985 6,031 6,077 6,123 6,169
820,000 5,838 5,884 5,936 5,977 6,023 6,069 6,116 6,162 6,208
825,000 5,873 5,920 5,972 6,013 6,060 6,106 6,153 6,199 6,246
832,245 3/ 5,925 5,972 6,024 6,066 6,113 6,160 6,207 6,254 6,301
1/ The largest planted area since 2000/01 w as 2018/19's 804,060 hectares.
2/ USDA's forecast for harvested area is 814,850 hectares.
3/ CONADESUCA's forecast for harvested area is 832,245 hectares.
Note: Shaded area represents sugar production that is below the current USDA projection of 5.9 million metric tons.
Source: USDA, Economic Research Service calculations; Mexico's National Committee for the Sustainable Development of Sugarcane (CONADESUCA).
17
Sugar and Sweeteners Outlook: February 2023, SSS-M-414, February 14, 2023
USDA, Economic Research ServiceConsidering its current supply and use balance forecast, Mexico would be able to meet its
export quota to the U.S. if its exports to non-U.S. destinations would equal 4,000 MT – last
year’s volume was 495,000 MT– and if deliveries to the IMMEX program would be at 493,000
MT, which is lower than last year’s 532,000. IMMEX is a federal program that allows
manufacturers of sugar-containing products to use imported and domestically produced sugar
as inputs so long as the products are exported within six months. Sugar delivered to IMMEX
participants have been trending upwards since 2008/09. This year’s pace through December
(84,000 MT) is relatively strong and second only to last year’s 105,000 over the same period
(figure 14). If Mexico’s sugar production turns out to be lower than the current 5.9-million MT
forecast or if the U.S. requires additional sugar, sugar destined for IMMEX, can be adjusted
to fulfill U.S. export commitments. In that case, the ability to meet the minimum or additional
U.S. exports commitments would likely be balanced with IMMEX commitments such that
IMMEX-dependent companies, which include Mexico-based U.S. manufacturing companies,
have adequate supplies.
18
Sugar and Sweeteners Outlook: February 2023, SSS-M-414, February 14, 2023
USDA, Economic Research ServiceSpecial Article: Sidney Sugars Beet Sugar
Factory to Close
On February 6, 2023, the American Crystal Sugar Company (ACSC) announced that the nearly
century-old Sidney Sugars beet sugar processing plant in Sidney, Montana will start shutdown
operations on April 14. Sidney Sugars was built in January 1925 and was originally called
Midland Sugar Company, which was later changed to Holly Sugar Corporation. In 1988,
Imperial Sugar Company, then headquartered in Sugar Land, Texas, merged with Holly Sugar.
The resulting company, Imperial Holly Corporation, became a public company that same year.
In October 2022, ACSC purchased the Holly Sugar factor from Imperial and named it Sidney
Sugars Incorporated.
ACSC’s media release referred to the continued decline in contracted acres necessary for a
financially sustainable operations as the main reason for the closure. While refined beet sugar
prices have been historically high since 2020, production costs have also been relatively high
due to increasing prices of farm inputs such as fertilizers and fuel. Given that sugarbeets are
grown in a 2- or 3-year rotation (as opposed to sugarcane which is on a multi-year planting
cycle), alternative crops, such as wheat and corn that likewise have attractive prices and require
less intensive crop management, have taken acreage away from sugarbeets in the eastern
Montana (MT) and western North Dakota (ND) regions.
Historically, growers in 5 counties in eastern MT and 2 counties in western ND supply
sugarbeets to Sidney Sugars (figure 15). County sugarbeet planted acreage in these regions is
available from USDA, National Agricultural Statistics Service (NASS) starting with crop year
1944 until NASS ceased reporting the data in 2018.
Since 1944, total planted sugarbeet acreage in these counties steadily increased before
peaking at 45,000 acres between 1998‒2002 (figure 16). Since then, acreage has declined and
stabilized at around 30,000 acres between 2010 and 2018, and presumably into 2021 based on
the ACSC’s media release which indicated that 30,774 acres were planted during that year. The
only exception was in 2008 when sugarbeet planted area in these counties dropped to 15,200
acres due to high prices of alternative crops. Richland County, MT has the largest planted
acreage, averaging about 13,200 acres, or 44 percent of the total, over the same 2010–2018
19
Sugar and Sweeteners Outlook: February 2023, SSS-M-414, February 14, 2023
USDA, Economic Research Serviceperiod 1, followed by McKenzie County, ND with 8,800 acres (29 percent), and the rest with
8,300 acres (27 percent).
Per ACSC, planted area in 2022 went down to 18,400 acres, 40 percent lower than 2021’s
30,774 acres, and the contracted area offered for the 2023 season increased by just 6 percent
to 19,500 acres.
Based on the 19,500 acres that ACSC contracted for the 2023 season, the NASS’ 5-year
average (2014‒2018) for yield (31.3 tons per acre) and for sucrose recovery (18.2 percent) in
these counties, and the February WASDE’s 6.8 percent forecast for the national sugarbeet
shrink (6.8 percent), it is estimated that the closure of Sidney would reduce crop year 2023/24
beet sugar production by around 105,000 short tons, raw value (STRV). Of this total, 10,000
STRV (10 percent) is expected to be produced during the early season (August–September
2023), which would be accounted for in the fiscal year 2022/23 forecast. Thus, this month, the
WASDE forecast for August–September 2023 beet sugar production is reduced by 10,000
STRV to 643,000 from last month.
The impact of the processing facilities’ closure on planted area will likely be reflected in the
NASS’ March 31 Prospective Plantings report and/or the June 30 Acreage report. The Farm
Service Agency, which oversees the U.S. sugar marketing allotment program, would potentially
review ACSC’s marketing allocation for fiscal year 2024 because of Sidney Sugar’s closure.
ACSC indicated that Sidney Sugars finished processing the 2022 crop in December, and that
cleanup at the factory will continue until April. The warehouse will continue operations through
the summer.
1
In 2008, NASS combined the data for Richland County, MT with the rest of the counties in the Northeast agricultural district to avoid
disclosure of individual information. See Appendix 1 for a snippet of the physical copy of the 2010 Agricultural Statistics bulletin for
Montana. For simplicity of graphing the data in figure 16, all of the 6,900 planted acres in the Northeast district is assigned to Richland
County.
20
Sugar and Sweeteners Outlook: February 2023, SSS-M-414, February 14, 2023
USDA, Economic Research Service21
Sugar and Sweeteners Outlook: February 2023, SSS-M-414, February 14, 2023
USDA, Economic Research ServiceAppendix
22
Sugar and Sweeteners Outlook: February 2023, SSS-M-414, February 14, 2023
USDA, Economic Research ServiceSuggested Citation
Abadam, Vidalina. Sugar and Sweeteners Outlook: February 2023, SSS-M-414, U.S. Department of
Agriculture, Economic Research Service, February 14, 2023.
Use of commercial and trade names does not imply approval or constitute endorsement by USDA.
In accordance with Federal civil rights law and U.S. Department of Agriculture (USDA) civil rights regulations and
policies, the USDA, its Agencies, offices, and employees, and institutions participating in or administering USDA
programs are prohibited from discriminating based on race, color, national origin, religion, sex, gender identity
(including gender expression), sexual orientation, disability, age, marital status, family/parental status, income derived
from a public assistance program, political beliefs, or reprisal or retaliation for prior civil rights activity, in any program
or activity conducted or funded by USDA (not all bases apply to all programs). Remedies and complaint filing
deadlines vary by program or incident.
Persons with disabilities who require alternative means of communication for program information (e.g., Braille, large
print, audiotape, American Sign Language, etc.) should contact the responsible Agency or USDA's TARGET Center
at (202) 720-2600 (voice and TTY) or contact USDA through the Federal Relay Service at (800) 877-8339.
Additionally, program information may be made available in languages other than English.
To file a program discrimination complaint, complete the USDA Program Discrimination Complaint Form, AD-3027,
found online at How to File a Program Discrimination Complaint and at any USDA office or write a letter addressed to
USDA and provide in the letter all of the information requested in the form. To request a copy of the complaint form,
call (866) 632-9992. Submit your completed form or letter to USDA by: (1) mail: U.S. Department of Agriculture,
Office of the Assistant Secretary for Civil Rights, 1400 Independence Avenue, SW, Washington, D.C. 20250-9410;
(2) fax: (202) 690-7442; or (3) email: program.intake@usda.gov.
USDA is an equal opportunity provider, employer, and lender.
23
Sugar and Sweeteners Outlook: February 2023, SSS-M-414, February 14, 2023
USDA, Economic Research ServiceYou can also read