Trends in Flood Insurance Behavior Following Hurricanes in North
←
→
Page content transcription
If your browser does not render page correctly, please read the page content below
The North Carolina Geographer, Volume 20, pp. 2-12

     Trends in Flood Insurance Behavior Following Hurricanes in North
                                 Carolina

                                      Julia Cardwell
                        University of North Carolina at Chapel Hill

In the past fifty years, North Carolina has experienced damage from a number of large hurricanes. The National
Flood Insurance Program (NFIP) exists to offer federally backed flood insurance for at risk home owners. This
study examines county level NFIP insurance uptake behavior after six major hurricanes in North Carolina to
understand the relationship between experiencing a hurricane and novel insurance uptake in the following year,
and finds conflicting results as to whether experiencing a hurricane is associated with a comparative increase in
novel insurance uptake as compared to counties that did not experience hurricane damage. In addition, this
study analyzes zip code level participation in recovery programs following Hurricane Florence as it relates to
novel insurance uptake and finds that participation in disaster assistance is positively associated with insurance
uptake.

Introduction                                                   However, NFIP uptake and market infiltration has
    The National Flood Insurance Program (NFIP) was       been, and remains low (Petrolia, Landry, and Coble
established in 1968 to address growing issues with        2013). This low uptake rate exists despite the fact that
flooding in the United States. The NFIP was developed     NFIP coverage is required in existing Special Flood
after an onslaught of expensive disasters in the mid-     Hazard Areas (100-yr floodplain). Many households
60’s (Strother 2016). These disasters were                that technically require coverage because of their
significantly damaging to communities in part due to      location in the special flood hazard area remain
the fact that most homeowners were not insured and        without coverage due, in large part, to the fact that
that private insurance companies generally saw            enforcement of this insurance purchase requirement
catastrophe insurance, like flood insurance, as bad       falls to mortgage holders, which often fail to fully
business and refused coverage, which lead to a            carry out this requirement (Huber 2012). It is also the
growing consensus that the federal government             case that low-income and minority populations
should play a role in protecting communities and          uptake insurance at a lower rate than higher-income,
individuals from flood risk (Strother 2016). The basis    whiter communities (Brody et al. 2017; Holladay and
of the NFIP program is that risk and damage will be       Schwartz 2010; Stewart and Duke 2017; Thomas and
reduced in a number of ways. To begin, insurance          Leichenko 2011). In order to encourage participation
coverage will reduce strain on individual households      in the NFIP, coverage has often been offered at
by providing support after a damaging event (Thomas       subsidized or grandfathered rates, which combined
and Leichenko 2011). Additionally, collective risk will   with the increasing costs of flood damage, has
be reduced because for a community to participate in      resulted in the program now operating at an extreme
the NFIP they must commit to efforts to limit new         deficit of billions of dollars to the United States
development and reduce existing development in            Treasury Department (Wriggins 2014).
flood-prone      areas by       adopting floodplain            The Biggert-Waters Flood Insurance Reform Act of
management strategies (Thomas and Leichenko               2012 required significant changes to the functioning
2011).                                                    of the NFIP, focused largely on the actuarial
                                                          soundness of the program (Vazquez 2015). The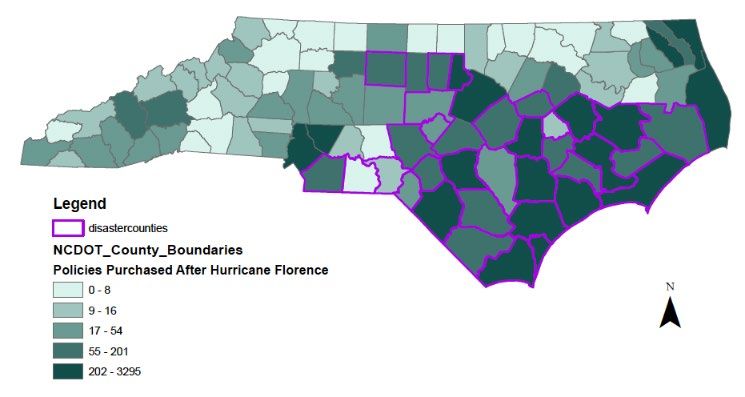
Trends in Flood Insurance Behavior following Hurricanes in North Carolina                                        3

Biggert-Waters Act largely focused on removing                   Complicating the trajectory of the “Katrina Effect”
subsidies and grandfathered rates, which were                is the operation of other flood recovery programs
originally implemented to improve the affordability of       available to uninsured individuals, including FEMA
insurance in high flood-risk areas. However, the             grant programs that do not require repayment.
Biggert-Waters Act faced immediate backlash as               “Charity hazard” refers to the potential pattern in
communities and individuals reeled from the increase         which expectations for disaster assistance after
in insurance rates (Vazquez 2015). The rate increases        hazards results in individuals choosing to forgo
for many communities would be devastating to                 insurance (Browne and Hoyt 2000). In this scenario,
individual and community financial sustainability, and       people may rely on federal recovery programs, like
low-income areas were more dramatically affected by          FEMA grants that do not require repayment and also
Biggert-Waters Act than high-income areas (Frazier,          do not require homeowners to pay insurance
Boyden, and Wood 2020). In response to the disarray          premiums, to assist if their home is damaged in a
caused by the Biggert-Waters Act, steps were taken           hurricane or other extreme event. In the event of
towards delaying the insurance premium increases             “charity hazard” individuals and homeowners avoid
implicated in Biggert-Waters (Vazquez 2015). The             personal responsibility for protective actions like
Homeowner Flood Insurance Affordability Act of 2014          insurance by focusing on the potential for recovery aid
delayed rate increases and other parts of the Biggert-       from other sources. However, examinations of the
Waters Act to give the Federal Emergency                     existence of charity hazards have had conflicting
Management Agency (FEMA) time to conduct an                  results in terms of the role of the expectation of
affordability study and check the accuracy of the flood      disaster assistance and insurance decisions (Atreya
maps (Vazquez 2015).                                         and Ferreira 2013; Landry, Turner, and Petrolia 2021;
    Besides uptake issues, the NFIP has suffered from        Petrolia, Landry, and Coble 2013).
inappropriate risk assessment. Analysis by both FEMA             This study examines absolute and comparative
and external sources has indicated that the NFIP             novel insurance policy purchases, referred to as
floodplain mapping efforts can, at times, be                 uptake, in counties with and without FEMA disaster
inaccurate in predicting flood risk (FEMA 2006; Xian,        declarations after six major hurricane years in North
Lin, and Hatzikyriakou 2015). This, in combination           Carolina. This study finds conflicting patterns
with low uptake rates, results in situations where the       depending on the year and the storm. In addition, it
majority of damage after extreme events exists in            explores the impact of the “charity hazard”
uncovered areas (First Street Foundation 2019;               phenomenon after Hurricane Florence in North
Kousky and Michel‐Kerjan 2017).                              Carolina by modeling participation in disaster
    The highest penetration rate of the NFIP has been,       assistance as it compares to insurance uptake after
and remains, in coastal areas that have experienced          Florence and finds that participation in disaster
frequent damaging flood events (Michel-Kerjan,               assistance is positively associated with insurance
Lemoyne de Forges, and Kunreuther 2011). Major               uptake after Hurricane Florence.
events, including hurricanes, are typically associated
with at least a temporary increase in policy uptake.         Methodology
For example, following Hurricane Katrina, Rita, and              All NFIP policies were downloaded from FEMA’s
Wilma, the number of policies increased by three to          open-source data platform (downloaded 10-22-2020).
four times the growth rates from years before                Of these policies, all policies that were purchased to
(Michel-Kerjan, Lemoyne de Forges, and Kunreuther            cover property within North Carolina were selected
2011). This has been referred to as the “Katrina             from the entire policy sample. Six major storm years
Effect” (Michel-Kerjan, Lemoyne de Forges, and               were selected to represent the diversity of storms
Kunreuther 2011). Other studies have found                   experienced by North Carolina in recent history. After
insurance uptake spikes in the year after a flood event      examining insurance uptake trends in North Carolina
with steady declines after that year (Atreya and             (see Figure 2), Hurricane Fran and Bertha were
Ferreira 2013; Gallagher 2014).                              selected to be the first hurricanes examined in the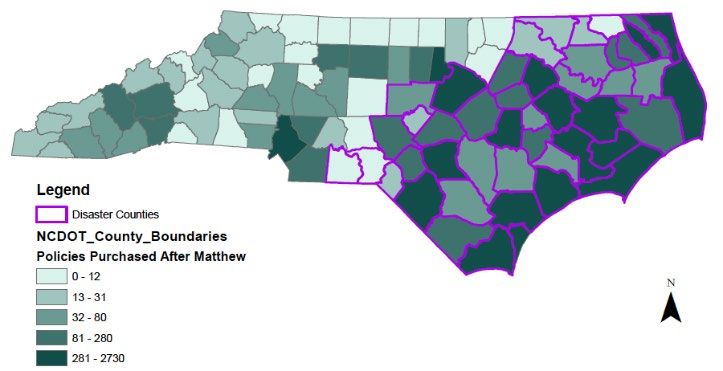
4 Cardwell
study because of the extremely limited insurance focused on novel insurance uptake before and after
uptake in the state before the 1990’s. Following each of these major storm event years. As such, for
Bertha and Fran, flood loss by storm was examined to each storm the novel policies were isolated for a full
select a sample of hurricanes that experienced a range year immediately preceding the storm, and a full year
of losses and a temporal diversity between 1996 and immediately following the storm.
present, which also represents a diversity in insurance Independent samples t-testing were run on two
coverage. The storm years selected were: variables, each separated into two groups by counties
with and without a FEMA disaster declaration that
• 1996 – Hurricane Fran and Hurricane Bertha (4 made a county eligible for Individual Assistance
July 1996 –10 September 1996) following the storm. The two variables were absolute
• 1999 – Hurricane Dennis and Hurricane Floyd (23 increase by number of policies in the year following
August 1999 – 20 September 1999) the hurricane, and percent increase from the year
• 2003—Hurricane Isabel (18 September 2003 – 26 immediately preceding the storms. In several of the
September 2003) storm years, some counties were excluded from the
• 2011—Hurricane Irene (25 August 2011 – 1 percent increase t-testing due to having 0 policies
September 2011) purchased in the year before or after the storm, which
• 2016—Hurricane Matthew (4 October 2016 – 26 precludes calculation of percent change.
October 2016) To examine the effect of charity hazard on
• 2018—Hurricane Florence (7 September 2018– 29 insurance uptake following Hurricane Florence, the
September 2018) FEMA Individual Assistance Program data
(downloaded 9/2/2020) and NFIP Redacted Claims
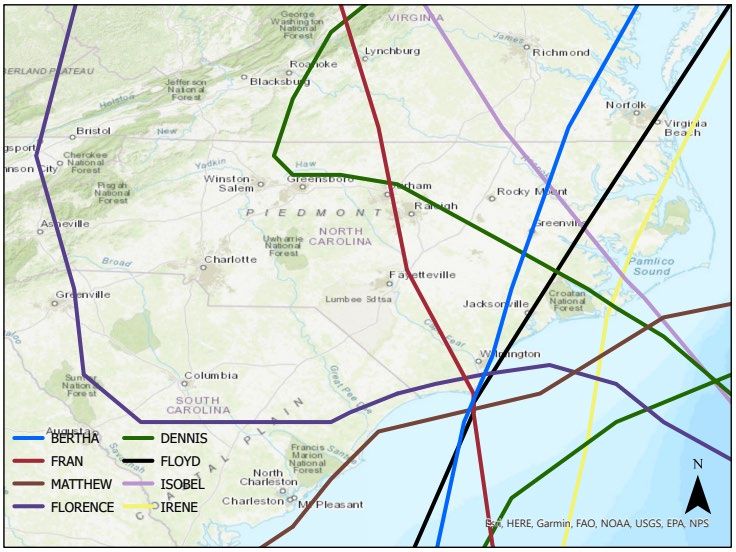
Figure 1 shows the tracks of each hurricane (downloaded 10/22/2020) were downloaded from
through North Carolina. The tracks mainly involve the FEMA’s open-source data platform. FEMA and the
eastern part of the state with the exception of Federal Government cannot vouch for the data or
Hurricane Florence, which was significantly weakened analyses derived from these data after the data have
when it traveled through the western part of the been retrieved from the Agency's website(s) and/or
state. Data.gov.
For the Individual Assistance (IA) Applications,
only those with a payout for rental assistance, repair
assistance, or replacement assistance with a Florence
disaster code (NC-4393) were isolated. Those
qualifying only for Other Needs Assistance (ONA;
including Personal Property Assistance) were
excluded because some types of this assistance
(including Personal Property Assistance) are only
available for those who also qualified for Small
Business Association loans, and these loans were not
included in this analysis. After the payouts were
isolated from all the claims, only those payouts that
were not made in combination with an insurance
claim were further isolated so comparisons could be
made between applicants who used these two
Figure 1. Tracks of all hurricanes in study (National programs separately. For FEMA NFIP Redacted Claims,
Hurricane Center and NOAA 2020) only those in North Carolina with a date of loss during
FEMA’s recognized incident period (Sept 7 – Sept 29,
The dates of each storm were determined by 2018) were isolated. The claims were further isolated
FEMA designation for major disasters. The study to identify only those claims which had a payout.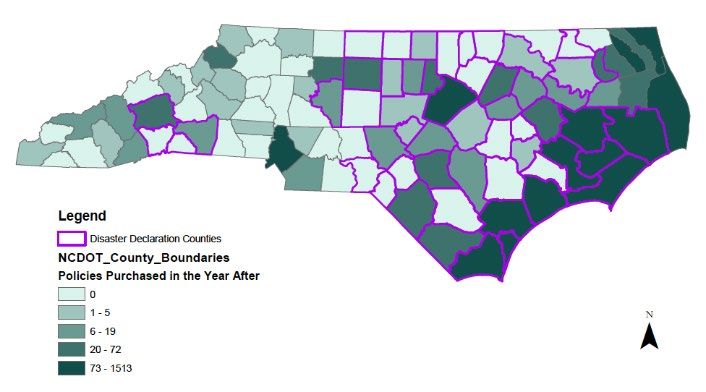
Trends in Flood Insurance Behavior following Hurricanes in North Carolina                                         5

    In addition, demographic data were downloaded            Hurricane Fran (1996). Disaster-designated counties
from the American Community Survey data for 2018             had an average increase of approximately 144
by zip code to test the influence of demographic             percent, while non-disaster counties had an average
variables on insurance uptake in the model. These            increase of approximately 38 percent. However, this
demographic data included two variables—per capita           percent change difference is not significantly different
income and percent non-Hispanic white. The per               between disaster and non-disaster counties at the p <
capita income data comes from ACS Variable B19301            .05 level (p = .219).
(2018 5-year estimates), and the percent non-                    Disaster-designated counties added around 87
Hispanic white comes from ACS Variable B03002                policies in the year following Hurricane Bertha and
(2018 5-year-estimates).                                     Hurricane Fran, while non-disaster counties added
    A negative binomial regression was run with novel        around 49. The policy uptake difference between the
insurance uptake after Hurricane Florence as the             two designations was not significant at the p < .05
dependent variable, and NFIP and IA participation,           level (p = .395).
along with the demographic variables, as the
independent variables. Three variables were recoded
to increase comprehension of the standardized beta
coefficient. Per capita income was recoded as per
capita/10,000, and NFIP and IA participation were
recoded as NFIP/100 and IA/100.

Results
    Figure 2 explores the general trends in novel
insurance uptake in North Carolina. The data indicate        Figure 3. Percent change of novel insurance uptake
that there were general increases in novel insurance         one year following Hurricane Bertha and Hurricane
uptake until 2010, with steady decline in uptake after       Fran
these years.

                                                             Figure 4. Number of policies purchased within a year
                                                             following Hurricane Bertha and Hurricane Fran

                                                             Table 1. Independent samples t-test for mean
                                                             difference in percent change between disaster- and
Figure 2. Frequency table of novel NFIP insurance            non-disaster-designated counties following Hurricane
policies                                                     Bertha and Hurricane Fran
                                                              Disaster N Mean     St. Dev         Mean Sig
Hurricane Bertha and Hurricane Fran                           County                              Diff
    Both disaster-designated counties and non-                Yes      46 144.631 493.53          106.08 .219
disaster counties had an average percent increase in          No       37 38.5502 185.4452        106.08
novel insurance uptake after Hurricane Bertha and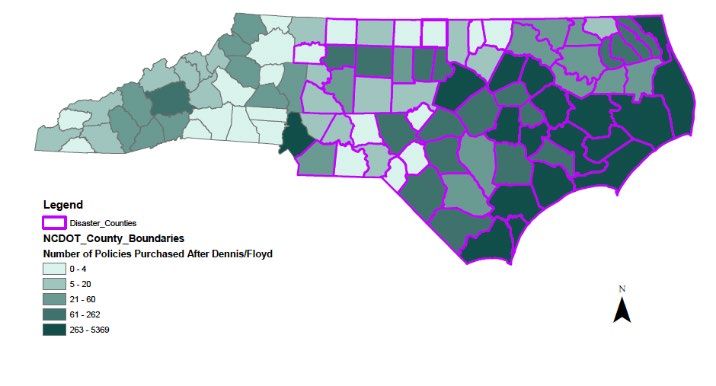
6                                                                                                      Cardwell

Table 2. Independent samples t-test for mean
difference in novel policy uptake between disaster-
and non-disaster-designated counties following
Hurricane Bertha and Hurricane Fran
 Disaster   N    Mean    St. Dev   Mean     Sig
 County                            Diff
 Yes        54   86.70   218.533   38.117   .395
 No         46   48.59   226.731   38.117

Hurricane Dennis and Hurricane Floyd                      Figure 6. Number of policies purchased within a year
    Both disaster-designated counties and non-            following Hurricane Dennis and Hurricane Floyd
disaster counties had an average percent increase in
novel insurance uptake after Hurricane Dennis and         Table 3. Independent samples t-test for mean
Hurricane Floyd (1999). Disaster-designated counties      difference in percent change between disaster- and
had an average increase of approximately 354              non-disaster-designated counties following Hurricane
percent, while non-disaster counties had an average       Dennis and Hurricane Floyd
increase of approximately 139 percent. This percent        Disaster N Mean      St. Dev      Mean    Sig
change difference is statistically significant between     County                            Diff
                                                           Yes      60 354.01   543.273      214.994 .015***
disaster and non-disaster counties at the p < .05 level
                                                           No       30 139.0157 276.591      214.994
(p = .015).
    Disaster-designated counties added about 434
                                                          Table 4. Independent samples t-test for mean
policies in the year following Hurricane Dennis and
                                                          difference in novel policy uptake between disaster
Hurricane Floyd, while non-disaster counties added
                                                          and non-disaster-designated counties following
around 36. The policy difference between the two
                                                          Hurricane Dennis and Hurricane Floyd
designations was significant at the P < .05 level (p =
                                                           Disaster N Mean St. Dev         Mean    Sig
.002).
                                                           County                          Diff
                                                           Yes      65 434.11 984.233      397.765 .002***
                                                           No       35 36.24 81.693        397.765

                                                          Hurricane Isabel
                                                              Both disaster-designated counties and non-
                                                          disaster counties had an average percent increase in
                                                          novel insurance uptake after Hurricane Isabel (2003).
                                                          Disaster-designated counties had an average increase
                                                          of approximately 26 percent, while non-disaster
                                                          counties had an average increase of approximately 92
Figure 5. Percent change of novel insurance uptake
                                                          percent. In this case, non-disaster counties had a
one year following Hurricane Dennis and Hurricane
                                                          higher percent increase, however this percent
Floyd
                                                          increase difference is not statistically significant
                                                          between disaster and non-disaster counties at the p <
                                                          .05 level (p = .226).
                                                              Disaster-designated counties added around 536
                                                          policies in the year following Isabel, while non-
                                                          disaster counties added around 30. The policy
                                                          difference between the two designations was
                                                          significant at the p < .05 level (p = .007).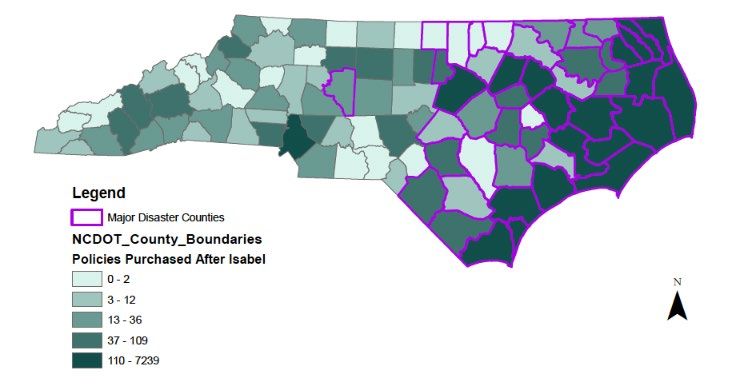
Trends in Flood Insurance Behavior following Hurricanes in North Carolina                                         7

                                                             had an average increase. Disaster-designated
                                                             counties had an average decrease of approximately
                                                             31 percent, while non-disaster counties had an
                                                             average increase of approximately 2 percent. This
                                                             percent change difference is significantly different
                                                             between disaster and non-disaster counties at the p <
                                                             .05 level (p = .016).
                                                                 Disaster-designated counties added around 642
                                                             policies in the year following Irene, while non-disaster
                                                             counties added around 106. The policy difference
Figure 7. Percent change of novel insurance uptake           between the two designations was significant at the p
one year following Hurricane Isabel                          < .05 level (p = .003).

                                                             Figure 9. Percent change of novel insurance uptake
Figure 8. Number of policies purchased within a year
                                                             one year following Hurricane Irene
following Hurricane Isabel

Table 5. Independent samples t-test for mean
difference in percent change between disaster- and
non-disaster-designated counties following Hurricane
Isabel
 Disaster N Mean         St.      Mean       Sig
 County                  Dev      Diff
 Yes      45 26.239      84.525   -66.111    .226
 No       35 92.35       275.19   -66.111
                                                             Figure 10. Number of policies purchased within a year
Table 6. Independent samples t-test for mean                 following Hurricane Irene
difference in novel policy uptake between disaster-
and non-disaster-designated counties following               Table 7. Independent samples t-test for mean
Hurricane Isabel                                             difference in percent change between disaster- and
 Disaster N Mean St. Dev            Mean    Sig              non-disaster-designated counties following Hurricane
 County                             Diff                     Irene
 Yes      47 536.09 1228.19         506.047 .007***           Disaster      N    Mean     St. Dev   Mean    Sig
 No       53 30.04 74.347           506.047                   County                                Diff
                                                              Yes           38   -31.01   28.543    -32.699 .016***
Hurricane Irene                                               No            60   1.69     96.051    -32.699
   Following Hurricane Irene (2011), disaster-
designated counties had an average decrease in policy
uptake, whereas non-disaster-designated counties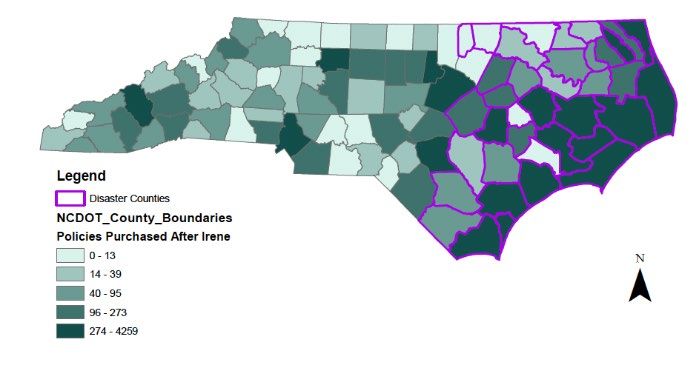
8                                                                                                         Cardwell

Table 8. Independent samples t-test for mean               Table 9. Independent samples t-test for mean
difference in novel policy uptake between disaster-        difference in percent change between disaster- and
and non-disaster-designated counties following             non-disaster-designated counties following Hurricane
Hurricane Irene                                            Matthew
 Disaster N Mean St. Dev          Mean Sig                  Disaster N Mean St. Dev          Mean Sig
 County                           Diff                      County                           Diff
 Yes      38 642.84 1045.23       536.16 .003***            Yes      45 104.74 150.317       102.43 .001***
 No       62 106.68 186.764       536.16                    No       54 2.302 133.56         102.43

Hurricane Matthew                                          Table 10. Independent samples t-test for mean
    Following Hurricane Matthew (2016), both               difference in novel policy uptake between disaster-
disaster and non-disaster counties had an increase in      and non-disaster-designated counties following
novel insurance policy uptake. Disaster-designated         Hurricane Matthew
counties had an average increase of approximately           Disaster N Mean St. Dev          Mean    Sig
105 percent, while non-disaster counties had an             County                           Diff
average increase of approximately 2 percent. This           Yes      45 391.07 572.281       288.685 .003***
percent change difference is significantly different        No       55 102.38 310.089       288.685
between disaster and non-disaster counties at the p <
.05 level (p = .001).                                      Hurricane Florence
    Disaster-designated counties added around 391              Following Hurricane Florence (2018), both
policies in the year following Irene, while non-disaster   disaster and non-disaster counties had an increase in
counties added of around 102. The policy difference        novel insurance uptake. Disaster-designated counties
between the two designations was significant at the p      had an average increase of approximately 103
< .05 level (p = .003).                                    percent, while non-disaster counties had an average
                                                           increase of approximately 13 percent. This percent
                                                           change difference is not significantly different
                                                           between disaster and non-disaster counties at the p <
                                                           .05 level, but is significant at the p < .10 level (p =
                                                           .066).
                                                               Disaster-designated counties added around 469
                                                           policies in the year following Irene, while non-disaster
                                                           counties added around 66. The policy difference
                                                           between the two designations was significant at the p
Figure 11. Percent change of novel insurance uptake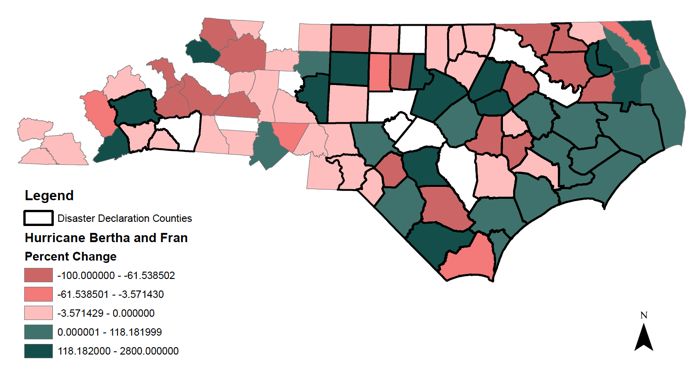
Trends in Flood Insurance Behavior following Hurricanes in North Carolina                                            9

                                                             Percent white was not a significant variable in the
                                                             model.

                                                             Table 13. Negative Binomial Distribution Model
                                                             Omnibus Test
                                                              Likelihood Ratio Chi-Square     Df     Sig.
                                                              431.822                         4      .000***

                                                             Table 14. Negative Binomial Distribution Model
Figure 14. Number of policies purchased within a year        Parameter Estimates
following Hurricane Florence                                  Parameter       B       Std.    Wald     Sig       Exp(B)
                                                                                      Error   Chi
Table 11. Independent samples t-test for mean                                                 Square
                                                              Intercept       1.219   .2375   26.354   .000***   3.385
difference in percent change between disaster- and            Per Capita      .644    .0957   45.284   .000***   1.903
non-disaster-designated counties following Hurricane          Individual      .485    .0588   71.060   .000***   1.641
Florence                                                      Assistance
 Disaster N Mean St. Dev            Mean Sig                  Participation
 County                             Diff                      NFIP            .436    .1046   17.372   .000***   1.547
 Yes      33 102.57 346.824         89.53 .066**              Participation
                                                              White           .003    .0034   .802     .371      1.003
 No       67 13.038 133.55          89.53
                                                              Percent

Table 12. Independent samples t-test for mean
                                                             Discussion
difference in novel policy uptake between disaster-
                                                                  Looking at overall trends in insurance policy
and non-disaster-designated counties following
                                                             purchasing behavior in North Carolina, there was a
Hurricane Florence
                                                             general increase in novel policies until 2010, followed
 Disaster N Mean St. Dev            Mean    Sig
                                                             by an average decrease in policies year after year. This
 County                             Diff
                                                             is likely not due to market saturation because of
 Yes      33 468.97 803.891         403.089 .007***
 No       67 65.88 151.652          403.089                  continued low uptake of NFIP policies (Petrolia,
                                                             Landry, and Coble 2013), and because each policy
Modeling Influence of Participation in Recovery              purchased is maintained for only two to four years on
Programs on Insurance Uptake                                 average (Michel-Kerjan, Lemoyne de Forges, and
    A statistically significant negative binomial            Kunreuther 2011). While in the history of NFIP
distribution model indicates that three of the               participation in North Carolina there have been over
independent variables were significant—per capita            600,000 unique policies, the amount of people
income, IA participation, and NFIP participation, with       covered by a policy at any given time is much lower
per capita income being the biggest contributor to the       considering the low overall tenure of policies.
model, followed by IA participation, and NFIP                     This study specifically examines the influence of
participation. For per capita income, a $10,000              hurricanes in NFIP uptake in the context of these
increase in per capita income was associated with a 90       general trends by examining novel purchasing
percent increase in NFIP uptake after Florence. For IA       behavior in the year immediately preceding and the
participation, an increase of 100 participants per zip       year following major hurricane events in affected and
code was associated with a 64 percent increase in            non-affected counties following these events.
NFIP uptake after Florence. For NFIP participation, an       Affected counties were represented by counties that
increase of 100 participants per zip code was                obtained a FEMA disaster declaration that qualified
associated with a 55 percent increase in NFIP uptake.        the county for IA from FEMA, whereas non-affected
                                                             counties did not obtain a declaration. The results
                                                             indicate that there is not an overarching pattern in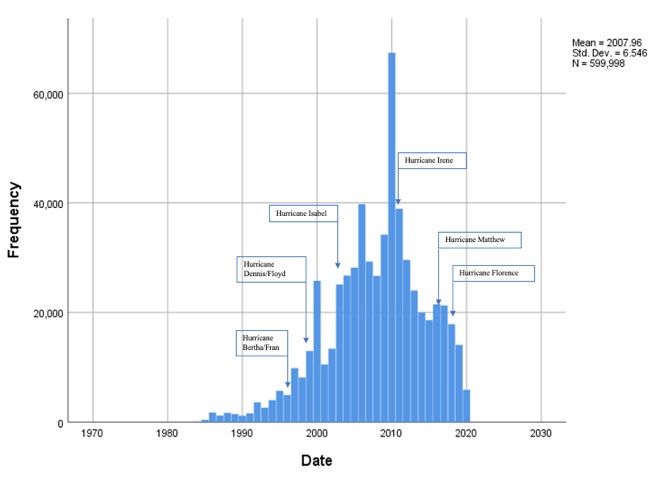
10                                                                                                         Cardwell

purchasing behavior following storms. Three of the six      However, as noted in Figure 2 insurance uptake in
storm events resulted in a statistically significant        1996 and 1997 was very low generally as compared to
difference in percent change in the year after the          following years, which could explain a non-significant
storm (Hurricane Dennis and Hurricane Floyd,                uptake after the event. Overall, this data adds to
Hurricane Matthew, and Hurricane Florence).                 literature examining the potential effects of
Hurricane Bertha and Hurricane Fran, and Hurricane          hurricanes on insurance uptake and finds that there is
Isabel were both associated with higher percent             not an overarching pattern indicating a percent
change in affected counties, but not at the statistically   increase in novel insurance uptakes, but that more
significant level. Hurricane Irene was associated with      major storms (that cause more damage) are more
a statistically significant negative increase in affected   associated with a positive pattern of novel insurance
counties as compared with non-affected counties.            uptake.
    The absence of an overarching pattern works                  All but one of the storm events were significant
contrary to studies indicating a more universal             (besides Hurricane Bertha and Hurricane Fran) in the
“Katrina Effect” following any storm. However, of           associated raw number of policies purchased in the
particular note in this study are the three storms          year after the storm in disaster-designated counties as
events that were associated with significant                opposed to non-disaster-designated counties.
differences. These three storm events were some of          However, this difference can also be explained by the
the costliest storms, which indicates that hurricanes       fact that coastal counties, in general, have higher
with more associated costs may conform more to this         uptake due to increased risk (Michel-Kerjan, Lemoyne
“Katrina Effect”.                                           de Forges, and Kunreuther 2011). Thus, the percent
                                                            difference might have more comparative predictive
Table 15. Costs of Hurricanes                               power.
 Hurricane Name             Associated Costs in North            An analysis of the impact of participation in
                            Carolina                        recovery programs and NFIP uptake after Hurricane
 Hurricane Fran and         7.2 billion (in 2009            Florence indicated that participation in both programs
 Hurricane Bertha (1996)    inflation-adjusted dollars)     (FEMA Individual Assistance, and NFIP participation)
                            (RENCI at East Carolina         were both significant on the zip code, with the IA
                            University 2009b)
                                                            program contributing more to the model. In other
 Hurricane Dennis and       7.8 billion (in 2009
                                                            words, after Hurricane Florence, both zip code
 Hurricane Floyd (1999)     inflation-adjusted dollars)
                            (RENCI at East Carolina         participation in the IA program (uninsured individuals
                            University 2009a)               obtaining federal aid) and the NFIP program were
 Hurricane Isabel (2003)    562 million (in 2013            associated with increased novel policy uptake. In this
                            inflation-adjusted              instance, the “charity hazard” actually had the
                            dollars)(NOAA n.d.)             opposite effect on the zip code level, in that
 Hurricane Irene (2011)     686 million (in 2012            participating in non-insurance programs (FEMA’s
                            inflation-adjusted dollars)     Individual Assistance Program) was associated
                            (NCDPS 2012)                    positively with insurance uptake. Because FEMA
 Hurricane Matthew          1.5 billion (Associated Press   removes personal identification information, this
 (2016)                     2016)
                                                            pattern cannot be tested at the household level,
 Hurricane Florence         17 billion (Porter 2018)
                                                            which may provide more insight on the impact of
 (2018)
                                                            disaster aid on the individual level. Of particular note
                                                            in regards to the IA program is the stipulation that
     A notable exception to this is Hurricane Fran and
                                                            approved applicants living in a Special Flood Hazard
Hurricane Bertha, which caused an estimated 7.2
                                                            Area are required to obtain and maintain flood
billion dollars in damage, close to the damage caused
                                                            insurance as a condition of receiving future assistance
by Hurricane Dennis and Hurricane Floyd, and more
                                                            through the IA program (FEMA 2019). This may be a
than the damage caused by Hurricane Matthew.
                                                            contributor to limiting the impact of “charity hazard”
Trends in Flood Insurance Behavior following Hurricanes in North Carolina 11
by creating circumstances in which participation in The results of this model indicate that social variables
federal programs may be disallowed if insurance is not should be considered more regularly when analyzing
purchased. questions of insurance uptake, especially in
In this model, per capita income also had relationship to harmful events.
significant power when examining insurance uptake
after Hurricane Florence specifically. This shows References
agreement with other studies that indicate that Associated Press. 2016. Hurricane Matthew Floods Caused
lower-income areas, in general, have lower insurance $1.5B Damage in North Carolina. New York Daily News.
uptake, which puts low-income communities at https://www.nydailynews.com/news/national/hurrica
greater risk (Brody et al. 2017). The social justice ne-matthew-floods-1-5b-damage-north-carolina-
article-1.2832916.
ramifications of this are significant, especially
Atreya, A., and S. Ferreira. 2013. An Evaluation of the
considering that currently most rates are subsidized,
National Flood Insurance Program (NFIP) in Georgia.
but are still not affordable for low-income individuals. Paper presented at Southern Agricultural Economics
There are limited studies that examine the role of Association (SAEA) 2013 Annual Meeting, Orlando, FL,
social variables in understanding the existence, or February 2-5, 2013. doi: 10.22004/ag.econ.143046.
absence of, a “Katrina Effect” after hurricanes or other Brody, S. D., W. E. Highfield, M. Wilson, M. K. Lindell, and
extreme events. This study shows that social variables R. Blessing. 2017. Understanding the Motivations of
may be significant, at least relating to one storm Coastal Residents to Voluntarily Purchase Federal
(Hurricane Florence). Because of this, more work Flood Insurance. Journal of Risk Research 20 (6):760–
should be done to understand trends in insurance 775. doi: 10.1080/13669877.2015.1119179.
uptake while considering social variables, especially as Browne, M. J., and R. Hoyt. 2000. The Demand for Flood
Insurance: Empirical Evidence. Journal of Risk and
it relates specifically to uptake after hurricanes and
Uncertainty 20 (3):291–306. doi:
other extreme events.
10.1023/A:1007823631497.
FEMA. 2006. Mitigation Assessment Team Report:
Conclusion Hurricane Katrina in the Gulf Coast: Building
This study analyzes insurance behavior after six Performance Observations, Recommendations, and
hurricane years in North Carolina, spanning from 1996 Technical Guidance. Federal Emergency Management
to 2018. The results indicate that there is not a Agency, Washington, D.C.
widespread existence of a “Katrina Effect”, in which https://www.hsdl.org/?view&did=467817.
insurance uptake spikes after hurricanes, for all FEMA. 2019. FEMA Individuals and Households Program
hurricanes with damage in North Carolina. However, (IHP) - Housing Assistance. Disaster Assistance.
there were several storms that were associated with https://www.disasterassistance.gov/get-
assistance/forms-of-assistance/4471.
significant differences in percent uptake in non-
First Street Foundation. 2019. FEMA Flood Maps and
affected versus affected counties. These results
Limitations. Medium 7 June.
indicate that there may be features of particular https://medium.com/firststreet/fema-flood-maps-
storms, for example financial damage, that result in and-limitations-ea06bf103c4d.
increased uptake in damaged counties. Frazier, T., E. E. Boyden, and E. Wood. 2020.
This study also analyzes the existence of a “charity Socioeconomic Implications of National Flood
hazard” for Hurricane Florence. This model indicates Insurance Policy Reform and Flood Insurance Rate Map
that participation in federal grants (in this case the Revisions. Natural Hazards 103 (1):329–346. doi:
FEMA IA program) is actually associated with an 10.1007/s11069-020-03990-1.
increase in insurance uptake in the following year Gallagher, J. 2014. Learning About an Infrequent Event:
after a storm. This works contrary to a “charity Evidence from Flood Insurance Take-Up in the US.
American Economic Journal: Applied Economics 6
hazard” scenario. This model also found that per
(3):206–233. doi: 10.1257/app.6.3.206.
capita income was a significant predictor in uptake,
Holladay, J. S., and J. A. Schwartz. 2010. Flooding the
meaning that higher income individuals were more Market: The Distributional Consequences of NFIP.
likely to uptake insurance in the year after a storm. Institute for Policy Integrity, New York University12 Cardwell
School of Law, New York, NY. RENCI at East Carolina University. 2009a. Hurricane Floyd.
https://policyintegrity.org/documents/FloodingtheMa RENCI at East Carolina University.
rket.pdf. https://www.ecu.edu/renci/stormstolife/Floyd/index.
Huber, D. 2012. Fixing A Broken National Flood Insurance html.
Program: Risks and Potential Reforms. Center for RENCI at East Carolina University. 2009b. Hurricane Fran.
Climate and Energy Solutions, Arlington, VA. RENCI at East Carolina University.
https://www.c2es.org/site/assets/uploads/2012/06/fl https://www.ecu.edu/renci/stormstolife/fran/econo
ood-insurance-brief.pdf. mic.html.
Kousky, C., and E. Michel‐Kerjan. 2017. Examining Flood Stewart, D. W., and L. D. Duke. 2017. Regional Differences
Insurance Claims in the United States: Six Key Findings. in Municipalities’ Flood Policies: Under-Insurance and
Journal of Risk and Insurance 84 (3):819–850. doi: Community Resilience in Pennsylvania. Poster
10.1111/jori.12106. presented at Susquehanna River Symposium,
Landry, C. E., D. Turner, and D. R. Petrolia. 2021. Flood Lewisburg, PA, October 11.
Insurance Market Penetration and Expectations of https://digitalcommons.bucknell.edu/susquehanna-
Disaster Assistance. Environmental and Resource river-symposium/2017/posters/48/.
Economics 79:357–386. doi: 10.1007/s10640-021- Strother, L. 2016. The National Flood Insurance Program: A
00565-x. Case Study in Policy Failure, Reform, and
Michel-Kerjan, E., S. L. de Forges, and H. Kunreuther. Retrenchment. Policy Studies Journal 46 (2):452–480.
2011. Policy Tenure Under the U.S. National Flood doi: 10.1111/psj.12189.
Insurance Program (NFIP). Risk Analysis 32 (4):644– Thomas, A., and R. Leichenko. 2011. Adaptation Through
658. doi: 10.1111/j.1539-6924.2011.01671.x. Insurance: Lessons from the NFIP. International
National Hurricane Center, and NOAA. 2020. Data From: Journal of Climate Change Strategies and Management
Best Track Data (HURDAT2) [dataset]. NOAA. 3 (3):250–263. doi: 10.1108/17568691111153401.
https://nhc.noaa.gov/data/#hurdat. Vazquez, L. M. 2015. Big Storms, Big Debt, and Biggery-
NCDPS. 2012. Hurricane Irene 2011. Accessed February 17, Waters: Navigating Florida’s Uncertain Flood Insurance
2021. https://www.ncdps.gov/emergency- Future. Seattle Journal of Environmental Law 5
management/recent-disasters/hurricane-irene-2011. (1):110–137.
NOAA. n.d. Hurricane Isabel, September 18, 2003. https://digitalcommons.law.seattleu.edu/sjel/vol5/iss
Accessed February 17, 2021. 1/5.
https://www.weather.gov/mhx/Isabel. Wriggins, J. 2014. Flood Money: The Challenge of U.S.
Petrolia, D. R., C. E. Landry, and K. H. Coble. 2013. Risk Flood Insurance Reform in a Warming World. Penn
Preferences, Risk Perceptions, and Flood Insurance. State Law Review 119 (2):361–437.
Land Economics 89 (2):227–245. https://papers.ssrn.com/sol3/papers.cfm?abstract_id
http://le.uwpress.org/content/89/2/227. =2550917.
Porter, F. 2018. Updated Estimates Show Florence Caused Xian, S., N. Lin, and A. Hatzikyriakou. 2015. Storm Surge
$17 Billion in Damage. NC Gov. Cooper. Damage to Residential Areas: A Quantitative Analysis
https://governor.nc.gov/news/updated-estimates- for Hurricane Sandy in Comparison with FEMA Flood
show-florence-caused-17-billion-damage. Map. Natural Hazards 79:1867–1888. doi:
10.1007/s11069-015-1937-x.You can also read