Sydney Harbour beach erosion - actions of the sea or stormwater runoff? - Risk Frontiers
←
→
Page content transcription
If your browser does not render page correctly, please read the page content below
Sydney Harbour beach erosion – actions of the sea or
stormwater runoff?
Thomas Mortlock, Barry Hanstrum and Mingzhu Wang
The heavy rain event on 28 November 2018 caused widespread flooding in the Illawarra,
Sydney Metro and Central Coast areas, with some suburbs experiencing up to 61 mm in 30
minutes in Mosman, over 100 mm in two hours in the Sydney CBD and lower north shore, and
130 mm in 24 hours in Mosman. This type of springtime flash flooding is not uncommon, but
is often associated with urban surface water flooding, and not coastal erosion.
From a coastal perspective, it raises an interesting question for erosion of Sydney’s North
Shore and Middle Harbour beaches. These areas include some of Sydney’s most expensive
residential and commercial property, and are usually regarded as protected, low wave energy
beach locations with minimal erosion risk.
However - as demonstrated over the past few days - erosion can occur at these locations, and
not necessarily due to waves from the seaward side but from urban stormwater runoff from
the landward side (or to complicate things, a combination of both). The primary cause of
erosion and consequential infrastructure damage can be important with regards to insurance
against ‘actions of the sea’.
Rain then wind then waves
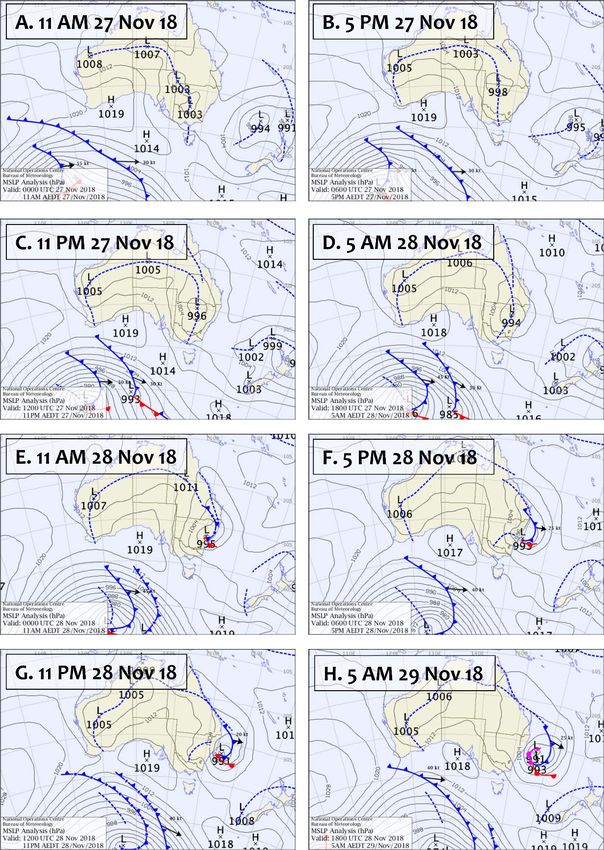
The 28 November rain event developed from a NW-SE oriented trough over the continent,
with several low-pressure cells developing 1 – 2 days prior to 28 November (Figure 1, A – C).
The deepest of these was centered over coastal NSW, reaching a moderate 994 hPa by the
morning of 28 November (Figure 1, D).
The first front and associated rainfall (blue dotted line in Figure 1) passed over the Sydney
Harbour area in the early morning of 28 November (6 to 8 AM). There was a maximum of 130
mm of rain in Mosman and 111 mm at The Rocks (Observatory Hill) – more than a month’s
volume for these areas. A second front affected Western Sydney in the afternoon of 28
November (Figure 1 F) but did not significantly impact habour beach locations.
Winds were not a key feature of this event and peaked a few hours after the most intense
rainfall was experienced on the North Shore - reaching just below 50 km/hr at 10:30 AM on 28
November (BoM Observatory Hill, BoM 2018b).
As the low-pressure cell moved offshore (Figure 1, G - H), rain and wind dropped while wave
heights at the open coast began to rise (Figure 1). Observations at the Sydney wave buoy,
located approximately 30 km off Narrabeen on Sydney’s Northern Beaches, show waves
from the SE peaked in the late afternoon of 28 November, with maximum wave heights
reaching between 7 and 10 m (Figure 2).
Briefing note 381 – page 1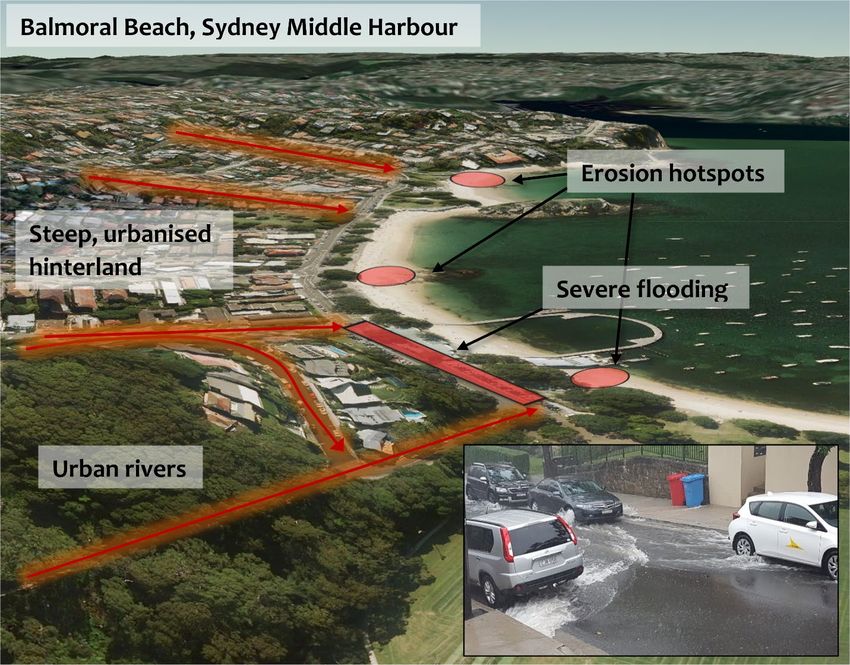
Figure 1. Synoptic evolution of the 28 November 2018 rain event in 6-hourly intervals from 11 AM on 27
November to 5 AM on 29 November. Images modified from BoM (2018a).

                                                                              Briefing note 381 – page 2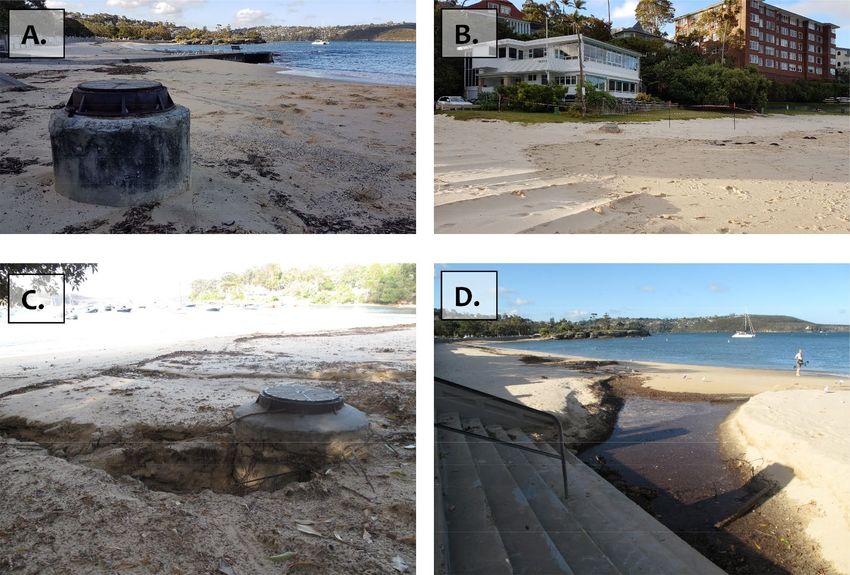
Figure 2. Wave height and direction observed at the Sydney wave buoy off Narrabeen through the 28
November rain event. Source: Manly Hydraulics Lab (2018).

A different type of East Coast Low
The 28 November event was an East Coast Low (ECL) – but not the type normally associated
with coastal erosion. It developed from a continental / inland trough low, typical of a spring-
time ECL (Browning and Goodwin, 2013), whereas most highly erosive ECLs occur in the winter
months and have a more meridional (shore-parallel) track. The severe weather, while very
intense was short lived because of the steady movement of the low.
The heavy rain was driven by intense thunderstorms that formed in the northwest of the
Sydney Basin and tracked southeast. According to design rainfall depths, there is only a 1 %
chance of this intensity of rainfall on the Lower North Shore (up to 61 mm in 30 minutes in
Mosman) occurring in any one year (ARR, 2016). The intense rainfall was probably a result of
cooler-than-normal land surface temperatures on the coast and relatively mild ocean
temperatures, resulting in strong convection and rainfall (Browning pers. comms.).

This particular event had the characteristics of an extra-tropical cyclone and was driven by the
dynamics of the upper atmosphere in a similar way to the mechanism for classic ECL
development. Rain and wind were to the south of the centre of the low with clear sky and
westerlies to the north.

It was a very unusual weather pattern for late November - the abnormal westerly flow to the
north of the low was responsible for the record maximum temperature along the tropical QLD
coast and catastrophic fire danger ratings. It's very hard to get strong surface westerlies at
these latitudes at this time of the year. The reason for this may be the unusual amount of
Antarctic sea ice for this time of year (Goodwin, pers. comms.), which acts to displace the
atmospheric cells in the Southern Hemisphere equatorward.

                                                                           Briefing note 381 – page 3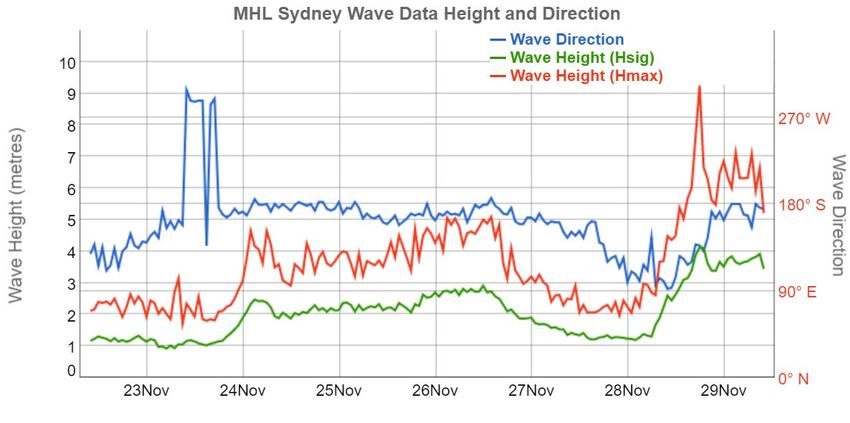
Causes of coastal erosion
In Sydney Harbour, the main cause of beach erosion was urban stormwater runoff (overland
and drainage), not waves – an important distinction for insurance. Balmoral Beach in Mosman
is a good example of the vulnerability of these largely protected, low wave energy coastal sites
to this type of erosion. A steep, urbanized hinterland directly behind the beachfront led to high
flow volumes running down several ‘urban rivers’ towards the beach (Figure 3). This washed
out beach sand from the landward side, causing flooding and some significant erosion in places
(Figure 4).

Figure 3. Conceptual plot of stormwater runoff-induced erosion at Balmoral Beach on 28 November 2018.
Erosion hotspots correspond to lowest drainage points. Inset shows an example of an ‘urban river’ down a
steep catchment in Neutral Bay.

It is possible for beaches in Middle Harbour to experience wave-driven coastal erosion. If wave
heights outside Sydney Harbour are large, and the wave direction is from the SE, wind-waves
can refract into Middle Harbour beaches and cause erosion. Interestingly, even beaches
deeper in the harbour can experience erosion during ECLs without being directly exposed to
the ocean wind waves. This (hypothetically – not tested) occurs through the propagation of
infragravity wave energy – very long period, low amplitude waves that can bounce off
headlands to reach otherwise protected locations. This type of wave energy is not detected

                                                                            Briefing note 381 – page 4
by conventional wave buoys and is often associated with phenomena such as surf-beat or
tsunamis. An example of this was during the April 2015 ECL, when Clontarf Beach – located
deep inside Middle Harbour next to Spit Bridge - suffered severe erosion which may have been
related to infragravity waves.

Figure 4. Erosion at Balmoral Beach caused by stormwater runoff. The beach level used to be at the height
of the drainage covers in (A). Photos taken by author on 29/11/18.

Conclusion
Springtime ECLs are most commonly associated with flash flooding, and not coastal erosion
because of the predominantly zonal track and limited wind and wave component of these
events. 28 November, however, was a reminder that coastal erosion is not just caused by
‘actions of the sea’ but can result from a combination of heavy rainfall and a steep, urbanized
hinterland. Fortunately, this type of rainfall is often localized – but it can lead to beach loss and
infrastructure damage in some surprising places.

Risk Frontiers is currently building an East Coast Low loss model to assist insurers to price risk
during these types of events.

                                                                             Briefing note 381 – page 5
References
Australian Rainfall Runoff [ARR] (2016), Design Rainfalls, available at
http://www.bom.gov.au/water/designRainfalls/revised-ifd/?year=2016, accessed 30/11/18.
Browning, S. and Goodwin, I.D. (2013), Large scale influences on the evolution of winter
subtropical maritime cyclones affecting Australia’s east coast. Monthly Weather Review, 141,
2416-2431.
Bureau of Meteorology [BoM] (2018a), Latest colour mean sea-level pressure analysis,
available at http://www.bom.gov.au/australia/charts/synoptic_col.shtml, accessed 29/11/18.
Bureau of Meteorology [BoM] (2018b), Latest weather observations for Sydney –
Observatory Hill, available at
http://www.bom.gov.au/products/IDN60801/IDN60801.94768.shtml, accessed 29/11/18.
Manly Hydraulics Lab [MHL] (2018), Sydney offshore wave height, period and direction,
available at https://www.mhl.nsw.gov.au/data/realtime/wave/Buoy-syddow, accessed
29/11/18.
Briefing note 381 – page 6You can also read