Synthesis of silver nanoparticles using white rot fungus Anamorphous Bjerkandera sp. R1: influence of silver nitrate concentration and fungus ...
←
→
Page content transcription
If your browser does not render page correctly, please read the page content below
www.nature.com/scientificreports
OPEN Synthesis of silver nanoparticles
using white‑rot fungus
Anamorphous Bjerkandera sp.
R1: influence of silver nitrate
concentration and fungus growth
time
Jerónimo Osorio‑Echavarría1*, Juliana Osorio‑Echavarría1,3,
Claudia Patricia Ossa‑Orozco2,3 & Natalia Andrea Gómez‑Vanegas1,3
Currently, silver nanoparticles (AgNPs) constitute an interesting field of study in medicine, catalysis,
optics, among others. For this reason, it has been necessary to develop new methodologies that
allow a more efficient production of AgNPs with better antimicrobial and biological properties. In
this research growth time effects Anamorphous Bjerkandera sp. R1 and the silver nitrate (AgNO3)
concentration over AgNPs synthesis were studied. Through the protocol used in this work, it was
found that the action of the capping proteins on the surface of the mycelium played a determining role
in the reduction of the Ag+ ion to Ag0 nanoparticles producing a particle size that oscillated between
10 and 100 nm. The progress of the reaction was monitored using visible UV–Vis spectroscopy and the
synthesized AgNPs were characterized by scanning electron microscopy (SEM), transmission electron
microscopy (TEM) and Fourier transform infrared radiation (FTIR) spectroscopy. The best synthetic
properties were found at 1 mM of AgNO3 concentration, growth time of 8 days, and reaction time of
144 h. Nanometals obtention from microorganisms could be considered as a new method of synthesis,
due to reducing abilities of metal ions through its enzymatic system and represents low-cost synthesis
that reduces the generation of harmful toxic wastes.
Silver nanoparticles (AgNPs) have recently attracted considerable attention in the development of applications
due to their excellent physical and chemical properties, such as its high thermal stability and low toxicity1. Studies
have shown that these can overcome pathologies previously treated with conventional antibiotics, due to their
strong antimicrobial characteristics and broad s pectrum2,3. One of the challenges in terms of the synthesis pro-
cess is to obtain nanoparticles with specific characteristics such as size distribution, shape, and surface charge,
among others, that will in turn determine their physical and chemical properties4. The standardization of the
nanoparticle synthesis process is a very important aspect since the antibacterial properties are highly related
with their size and surface charge. If these properties are adequately controlled, silver nanoparticles could have
an enormous potential as antibacterial a gents5,6.
The methods mostly used for the synthesis of nanoparticles have been both physical and c hemical7. The con-
ventional physical methods tend to produce low nanoparticle quantities, while the chemical methods consume
too much energy and require the use of stabilizing agents that are often toxic such as sodium dodecyl benzene
sulfonate or polyvinylpyrrolidone (PVP), which are used to avoid nanoparticle agglomeration8,9. Therefore, there
is a need to implement green and/or biological synthesis methods to reduce hazardous and toxic waste, with the
possibility of obtaining particles on the nanometric s cale10.
1
Grupo de Bioprocesos, Departamento de Ingeniería Química, Facultad de Ingeniería, Universidad de Antioquia,
Medellín, Colombia. 2Grupo de Investigación en Biomateriales, Programa de Bioingeniería, Facultad de Ingeniería,
Universidad de Antioquia, Medellín, Colombia. 3These authors jointly supervised this work: Juliana Osorio, Claudia
Patricia Ossa and Natalia Andrea Gómez. *email: jeronimo.osorio@udea.edu.co
Scientific Reports | (2021) 11:3842 | https://doi.org/10.1038/s41598-021-82514-8 1
Vol.:(0123456789)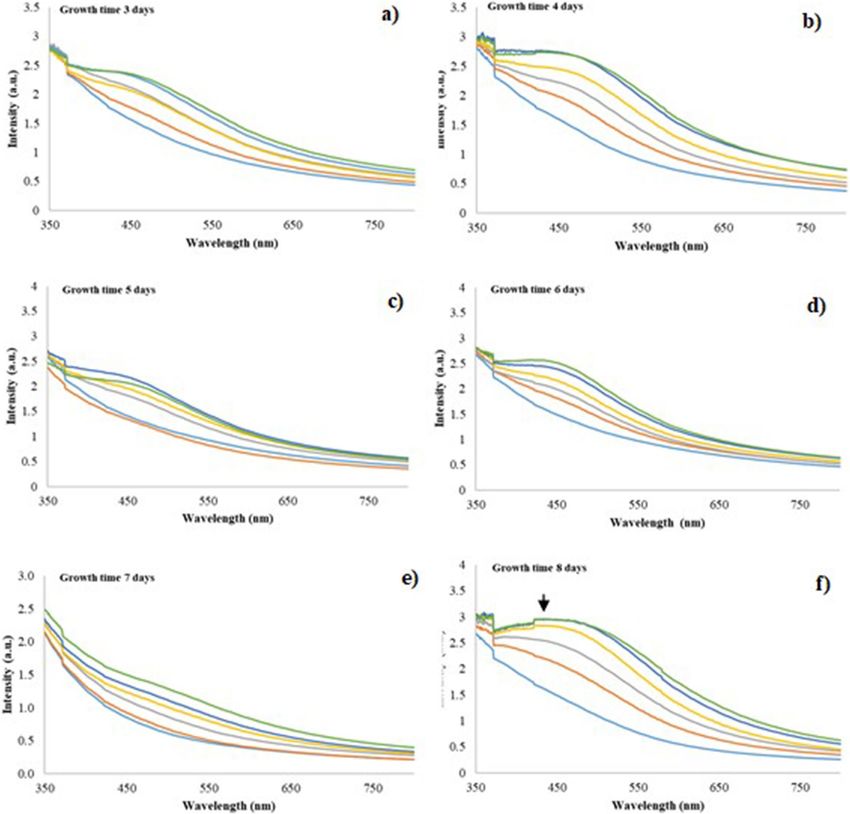
www.nature.com/scientificreports/
In the biological synthesis of AgNPs, the reducing and toxic stabilizing agents are replaced by nontoxic mol-
ecules (proteins, carbohydrates, antioxidants, etc.), produced by living organisms like bacteria, fungi, yeasts and
plants7,11. For example, the implementation of fungi is considered an important synthesis route, due to the high
binding capacity and intracellular metal uptake. It has been reported that fungal material is more advantageous
with respect to bacteria and plants, being that the mesh-like fungal mycelium can withstand flow pressures,
agitation and adverse conditions in processes that require the use of bioreactors and c hambers12. Furthermore,
fungi secrete significantly higher quantities of proteins than bacteria, which would amplify the productivity of
nanoparticle synthesis13.
There are different fungi strains that have been studied to synthesize silver nanoparticles such as Asper-
gillus niger, Aspergillus flavus, Alternaria alternate, Cladosporium cladosporioides, Fusarium solani, Fusarium
oxysporum, Penicillium brevicompactum, Trichoderma asperellum and Verticillium14,15. Azmath et al. for example
identified that using culture filtrates from various Colletotrichum sp. synthesized AgNPs with sizes between 5
and 60 nm and found that the biomolecules secreted by the fungus possibly functioned as stabilizing agents to
prevent them from agglomerating in the aqueous m edium16. With respects to white-rot f ungi17–20, their use has
been reported in the biosynthesis due to their high tolerance to metals and their powerful enzyme system (pro-
tein release); this last property gives it a great capacity for adsorption of Ag+ ions on the walls of the mycelium21.
Some white-rot fungi as Phanarochaete chrysosporium19, Trametes ljubarskyi, Ganoderma enigmaticum18 and
Trametes trogii22 have been reported to produce stable silver nanoparticles when silver nitrate (AgNO3) is used
as a metallic precursor in an aqueous medium, showing that fungal biomolecules under different experimental
conditions play an important role in the production of AgNPs. Although many studies are known about the
importance of using fungal material in obtaining nanoparticles, it is still necessary to evaluate some fungi as
particle synthesizers and verify how their growth process affects the synthesis.
In the case of the fungus used in this study, it has been reported as an anamorphous of Bjerkandera adusta.
These anamorphous are characterized by presenting asexual spores called conidia whose purpose is rapid repro-
duction and survival; this would mean great potential for various biotechnological and biomedical applications
due to its high nutritional and organoleptic quality and the ease of growing on agro-industrial by-products23.
The objective of this work was to evaluate the effect of silver nitrate concentration and growth time of fungus
of on the synthesis of silver nanoparticles (AgNPs) from the white-rot fungus anamorphous Bjerkandera sp.
R1. The formation of silver nanoparticles was monitored using UV–Vis spectrophotometry and complemented
with its morphological characterization through scanning electron microscopy (SEM) and transmission (TEM).
Methodology
Microorganisms and culture media. White-rot fungus strain Bjerkandera sp. R1 was used and cryopre-
served in pinewood splinters and bagasse. All fungi were donated by the Group of Environmental Biotechnology
from the department of chemical engineering at Universidad de Santiago de Compostela (Spain)24. The reagents
necessary for the preparation of the culture media were donated by the bioprocess group from the department
of chemical engineering at Universidad de Antioquia (Colombia). Cultures were made every month in Petri
dishes with solid Kimura medium [agar (15 g/L), glucose (20 g/L), peptone (5 g/L), yeast extract (2 g/L) KH2PO4
(1 g/L), MgSO4. 5H2O (0.5 g/L)] and pH 5.525. The inoculum necessary to start all the assays were prepared by
transferring 4 pieces of colonized agar to a Fernbach flask with liquid Kimura culture medium [glucose (20 g/L),
H2PO4 (1 g/L); MgSO4·5H2O (0,5 g/L)] and pH 5.525. Subsequently, the
peptone (5 g/L), yeast extract (2 g/L), K
mycelium layer formed was homogenized in a blender for 20 s for the different tests.
The crushed mycelium of fungus was mixed with Tween 80 and aseptically transferred to the liquid Kimura
culture medium. The sample was incubated in a shaking incubator (JEIO TECH SI-300) at 30 °C at 200 rpm to
favor the pellets formation; then it was centrifuged at 4500 rpm for 20 min to obtain two fractions: pellets and
supernatant. Each of these fractions was then used to determine the effect of silver nitrate (AgNO3) concentra-
tion and growth time on the synthesis of silver nanoparticles.
Evaluation of the operational conditions for the production of silver nanoparticles
(AgNPs). The production of AgNPs was carried out using two reduction methods.
1. Reduction of silver ions in the fungal filtrate (CS sample): 1% v/v solutions were prepared with the fungal
filtrate obtained from the different growth time of fungus and the corresponding concentrations of AgNO3
and mixed for 144 h. Control for this sample was done only using the fungal filtrate.
2. Reduction of silver ions from the mycelium-pellets (MP sample): For this method the pellets in a 1% w/v
concentration were mixed with the AgNO3 solutions and were incubated during 144 h, then the solution
was centrifuged, and the pellets were separated by membrane filtration. Finally, they were re-suspended in
deionized water and homogenized using a probe above 8.5 Hz for 5 min. Control of MP samples was carried
out mixing the pellets (1% w/v) with aqua solution
Determination of a suitable AgNO3 concentration for the synthesis of AgNPs. To determine the influence of
AgNO3 concentrations, the synthesis of AgNPs was evaluated using fungal filtrates from 5 and 7 days of growth
because these times favored AgNPs formation according to the results previously reported by Osorio et al.
(2014). For this reason, the fungal filtrate was mixed with three different final concentrations of A gNO3 (0.5,
1.0 y 1.5 Mm), they were incubated in the dark (30 °C) in a shaking incubator (JEIO TECH SI-300) at 200 rpm
for 144 h. Each test was duplicated simultaneously for the AgNO3 solution, and a control was done only with
the fungal filtrate. Samples were taken for 24, 48, 72, 96, 120 and 144 h (CS samples), and were analyzed using a
Scientific Reports | (2021) 11:3842 | https://doi.org/10.1038/s41598-021-82514-8 2
Vol:.(1234567890)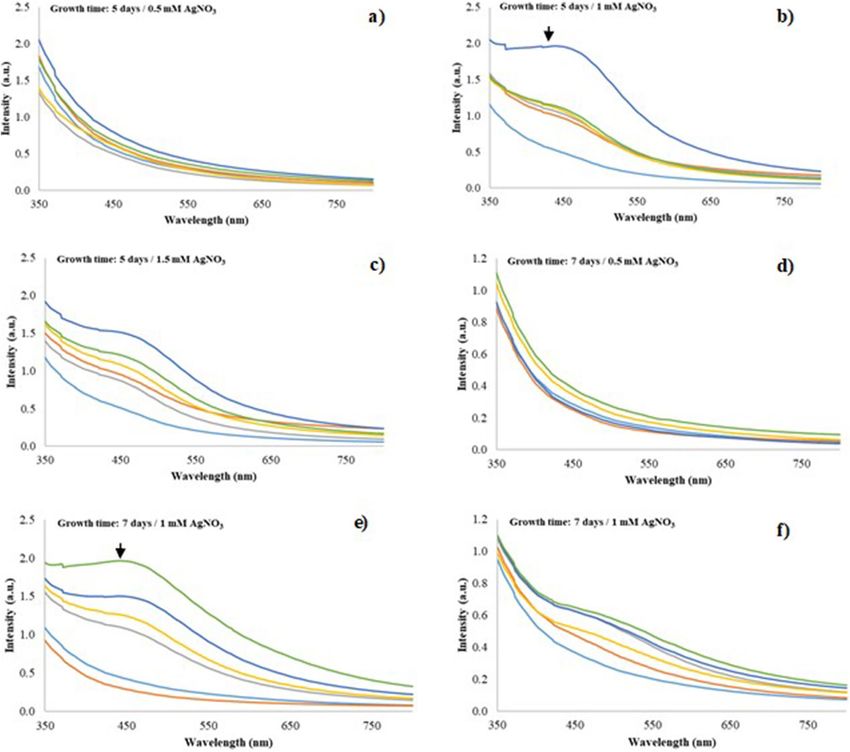
www.nature.com/scientificreports/
Factors Low High Levels Units Response variable
Growth time of fungus 5.0 7.0 2 Days Area under the curve
AgNO3 Concentration 0.5 1.5 3 mM
Table 1. Attributes of factorial design multilevel CS samples of the fungus anamorphous Bjerkandera sp. R1.
Factors Low High Levels Units Response variable
Growth time of fungus 3.0 8.0 6 days Area under the curve
Incubation time 120.0 144.0 2 hours
Table 2. Attributes of factorial design multilevel CS samples of the fungus anamorphous Bjerkandera sp. R1.
UV–Vis spectrophotometer (Helios-α Thermo Spectronic) by scanning the absorbance spectra in 350–800 nm
range of wavelength. The resulting spectra helped identify the absorption band of silver (Ag).
Table 1 shows the A gNO3 concentration values studied and the growth time of fungus on the response vari-
able, area under the curve. The area under the curve of the UV–Vis spectra (AUC) was used because a quantitative
variable was required to associate the presence or absence of AgNPs. The significance was determined using a
variance analysis (ANOVA) and statistical program Statgraphics centurion ® was used for the response surface
analysis.
Evaluation of the effect of growth time of fungus on the synthesis of AgNPs. The most suitable AgNO3 concentra-
tion found in Sect. "Determination of a suitable AgNO3concentration for the synthesis of AgNPs" was used to
evaluate the effect of growth time of fungus. Six different growth days were evaluated for the fungus anamor-
phous Bjerkandera sp. R1 (3, 4, 5, 6, 7 and 8 days of culture). In this case, the CS samples was incubated in the
dark (30 °C) in a shaking incubator (JEIO TECH SI-300) for 144 h at 200 rpm. These tests were carried out in
triplicate. Additionally, a control was performed using only fungal filtrate, with the purpose of having a reference
for the spectral analysis done. Small aliquots of CS samples were monitored every 24 h, for a total of 144 h by
the scanning the absorbance spectra using a UV–Vis spectrophotometer (Helios-α Thermo Spectronic), with the
same conditions as previously described.
Table 2 presents the studied values of growth time of fungus and incubation time, on the response variable
area under the curve (AUC). The significance was determined using an analysis of variance (ANOVA) and the
response surface analysis was done using the statistical program Statgraphics Centurion®.
Characterization of the AgNPs. The evaluation of the size distribution of the AgNPs was performed by Trans-
mission Electron Spectroscopy (TEM) and Scanning Electron Microscopy (SEM). For the SEM evaluation, the
fungus was lyophilized, and small MP samples were fixed in a graphite tape. Additionally, a thin gold coating
(Au) was placed (DENTON VACUUM Desk IV equipment) and analyzed in the scanning electron microscope
(JEOL-JSM 6490 LV) with an accelerating voltage of 20 kV. Semi-quantitative chemical composition analysis
of the sample was measured by energy dispersive X-ray Microscope-EDX (INCA PentaFETx3 Oxford Instru-
ments) using the system coupled to the SEM equipment. For the TEM evaluation a Tecnai F20 Super Twin TMP
instrument with an accelerating voltage of 200 kV and 0.1 nm resolution was used. For this, a drop of CS sample
containing AgNPs was placed on a carbon coated copper grid, and samples were dried under an infrared (IR)
lamp. A chemical compositional analysis of the colloidal suspension was measured by the detector EDX Oxford
Instruments XMAX. The reported size distribution was found using calculated averages (10–20 measurements)
over specific regions of the TEM and SEM micrographs. In this case, to measure the size of the nanoparticles
both on the surface of the mycelium and in the colloidal suspension (CS samples), they were found using the
internal software Scandium equipment for SEM and Image J for the TEM.
Finally, in order to determine the possible biomolecules responsible for the reduction of silver ions and for
the confirmation of the capping agents on AgNPs, Fourier transform infrared radiation (FTIR) spectroscopy
tests was performed (Nicolet iS50 FTIR). All measurements were carried out in the range of 400–4000 cm−1 at
a resolution of 2 cm−1.
Results and discussion
Determination and influence of silver nitrate (AgNO3) concentration on the synthesis of Ag‑
NPs from the fungus anamorphous Bjerkandera sp. R1. Synthesis of silver nanoparticles (AgNPs) in
the CS samples of the fungus anamorphous Bjerkandera sp. R1. The reduction of the silver nanoparticles (Ag-
NPs) in the fungal filtrate obtained from the white-rot fungus anamorphous Bjerkandera sp. R1 was examined
through a qualitative analysis. A yellow to brown color change was observed after 48 h of reaction when the
fungal filtrate was worked at final silver nitrate ( AgNO3) concentrations of 1 and 1.5 mM respectively (Fig. 1).
The color change explains the presence of AgNPs due to the Surface Plasmon Resonance (SPR) exhibited by the
synthesized AgNPs26,27. With respect to the color change in these solutions, the determination of the size and
shape of the synthesized AgNPs were initially corroborated through the absorption changes observed in the
Scientific Reports | (2021) 11:3842 | https://doi.org/10.1038/s41598-021-82514-8 3
Vol.:(0123456789)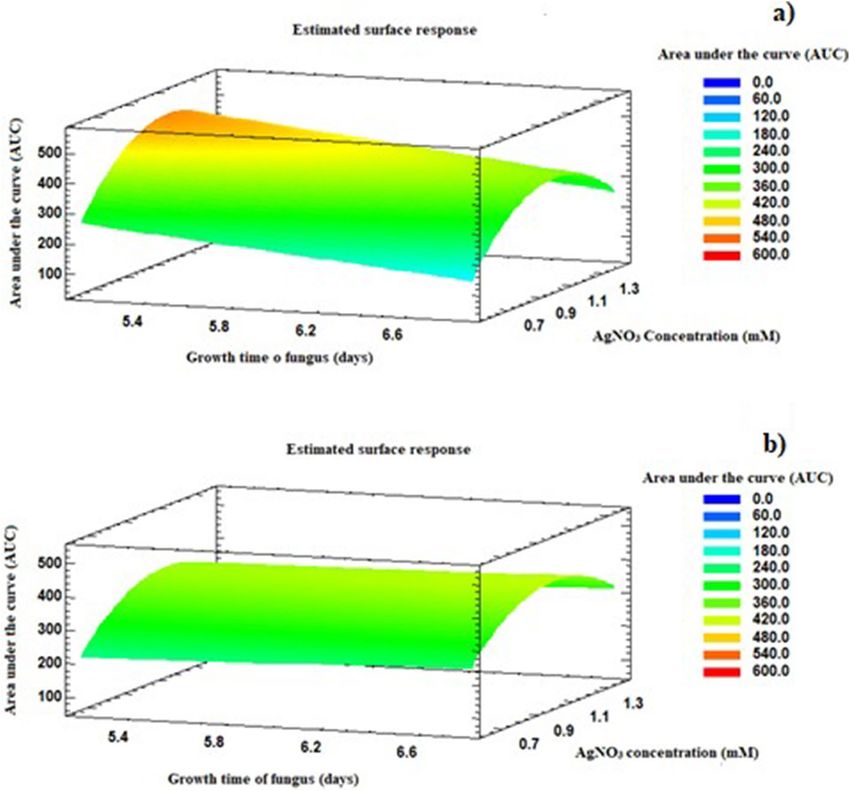
www.nature.com/scientificreports/
Figure 1. AgNPs biosynthesis in the CS sample (a) Control sample of the fungal filtrate of the fungus
anamorphous Bjerkandera sp. R1; (b) Formation of silver nanoparticles after 48 h of incubation for different
AgNO3 concentrations in the synthesis of AgNPs.
UV–Vis spectra (maximum wavelength) in function of time. A strong SPR at 430 nm was observed through
the spectra, which increased its intensity with time and reached the stabilization point after 120 h for the fungal
filtrate obtained from a growth time of fungus of 5 days and a concentration of 1 and 1.5 Mm A gNO3 (Fig. 2b,c).
A broad SPR was also observed after 144 h for the fungal filtrate obtained from 7 days of growth of the fungus
and concentration of 1.0 Mm A gNO3 (Fig. 2e), in contrast for a concentration of 1.5 mM A gNO3 a tenuous SPR
was observed (Fig. 2f). These changes in coloration, as well as the appearance of these bands were quantitative
evidence of the presence of AgNPs in the solution.
Table 3 presents the ANOVA for an incubation time of 120 h and 144 h. According to the values obtained
(p ≤ 0.05) with a confidence level of 95%, it was established that both the growth time of fungus variable and
AgNO3 concentration showed no significant effect on the area under the curve of the UV–Vis spectra (AUC), for
an incubation time of 144 h. In contrast, a significant effect was seen when the solution was incubated for 120 h.
Figure 3 shows the response surface graphs on the AUC variable, after 120 and 144 h of incubation. A higher
growth ‘rate’ favored an AUC increase and therefore the extracellular synthesis of A gNPs28. From these results,
it was found that working with a A gNO3 concentration of 1 mM for 144 h was adequate for the synthesis of
AgNPs using the fungus anamorphous Bjerkandera sp. R1. It was also found that the absorbance of these spectra
increased and were higher in contrast to the solution worked at 1.5 mM (Fig. 4b). The absorbance of AgNPs (at
the wavelength of maximal absorbance) is proportional to the concentration of AgNPs and these results indicated
the formation of a greater number of AgNPs within the fungal extract (CS sample)29 and are in accordance with
research conducted by Gudikandula et al.18 and Saravanan et al.19, who reported that working at a final concen-
tration of 1 mM AgNO3 facilitates the stable formation of AgNPs from white-rot fungi.
Effect of silver nitrate ( AgNO3) concentration on the biosynthesis of AgNPs using the fungus anamorphous Bjerkan-
dera sp. R1. To observe the effect of A gNO3 on the synthesis on the surface of the mycelium, measurements
were taken using a scanning electron microscope (SEM). The SEM images show the micrographs of lyophilized
fungus (MP samples) from day 7 of growth time of fungus (best result found according to Table 3, Fig. 3 and
Fig. 4b on the CS sample), which was incubated for 144 h using different A gNO3 concentrations. Low accu-
mulation of silver residues (macroparticles (Fig. 5a, see red circle) and well-defined particle distributions were
observed for 1 mM AgNO3, with spherical shape and size distribution of 70–90 nm (Fig. 5a, see black circle).
Regarding the other A gNO3 concentrations, the synthesis of AgNPs was highly regulated for a final concentra-
tion of 0.5 mM AgNO3 (Fig. 5b). In this case there was little formation of silver residues (Ag macroparticles)17
since the ions released in the solution were not adsorbed on the surface of the mycelium. From this analysis, this
substrate concentration was not enough for some biomolecules to act appropriately as stabilizing and reducing
agents. On the other hand, for a final concentration of 1.5 mM A gNO3 (Fig. 5c), the reduction of silver ions could
have occurred intracellularly, but the combinations and interactions of the functional groups present in the wall
of the fungus were affected by the implementation of higher levels of AgNO3; under these conditions the nuclea-
tion process of the Ag+ species became slower, which caused excessive accumulations of macroparticles on the
surface of the mycelium (Fig. 5c, see red circle). Regarding the ideal concentration for intracellular synthesis,
the results found are different from those reported by Kobashigawa et al. where it was found that 5 mM AgNO3
favors both intra and extracellular synthesis of AgNPs from white-rot fungus Trametes trogii22. In contrast to the
fungus implemented in this research, the EDX spectra revealed the synthesis of AgNPs, due to the presence of a
peak at approximately 3 keV that corresponds to the formation of pure s ilver14,30, indicating that a final concen-
tration of 1 mM is ideal for carrying out the reduction of the Ag+ ion to A g0 from the fungus anamorphous Bjer-
kandera sp. R1. In the EDX support carbon and oxygen peaks can also be observed, these peaks could indicate
the presence of proteins and/or fungal filtrate remains that were retained in the interstitial spaces of the fungus.
As described in the methodology, the culture medium is rich in carbon and this is an essential element that the
fungus requires to fulfill its metabolic functions24,31.
Effects of growth time of the fungus anamorphous Bjerkandera sp. R1 on the synthesis of
AgNPs. Synthesis and characterization of AgNPs of the CS samples using the fungus anamorphous Bjerkan-
dera sp. R1. Regarding the influence of growth time of fungus on the synthesis of AgNPs, a change of color
was evidenced with respect to the positive control for all the CS samples from all the different growth times of
Scientific Reports | (2021) 11:3842 | https://doi.org/10.1038/s41598-021-82514-8 4
Vol:.(1234567890)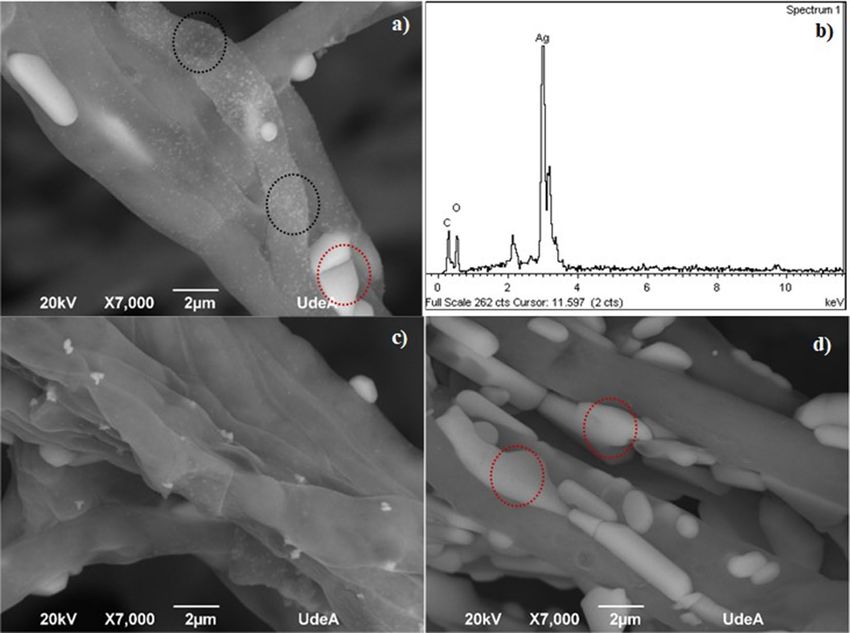
www.nature.com/scientificreports/
Figure 2. UV–Vis spectra for synthesized AgNPs using fungal filtrate from anamorphous Bjerkandera
sp. R1 with a calculated error of: (a) Growth time: 5 days/0.5 mM AgNO3 (0.045–0.001); (b) Growth time:
5 days/1.0 mM AgNO3 (0.045–0.001), (c) Growth time: 5 days/1.5 mM AgNO3 (0.25–0.002); (d) Growth time:
7 days/0.5 mM AgNO3 (0.015–0.001); (e) Growth time: 7 days/1.0 mM AgNO3 (0.020–0.001) and (f) Growth
time: 7 days/1.5 mM A gNO3 (0.4–0.010). Incubation time: 24 h , 48 h , 72 h , 96 h , 120 h , 144 h
.
Source F-Ratio-120 h P Value-120 h F-Ratio-144 h P Value-144 h
A:Growth time of fungus: 5 and 7 days 32.82 0.0012 0.14 0.7167
B:AgNO3 Concentration: 0.5. 1 and 1.5 mM 17.85 0.0055 1.17 0.3202
AB 0.21 0.6601 0.01 0.9390
BB 54.93 0.0003 6.03 0.0494
Table 3. Variance analysis for the variable area under the curve. Growth time of fungus 120 and
144 h-anamorphous Bjerkandera sp. R1.
the fungus (Fig. 6). This sharper contrast in color elucidates a higher proportion of AgNPs due to the surface
plasmon resonance (SPR)26,27.
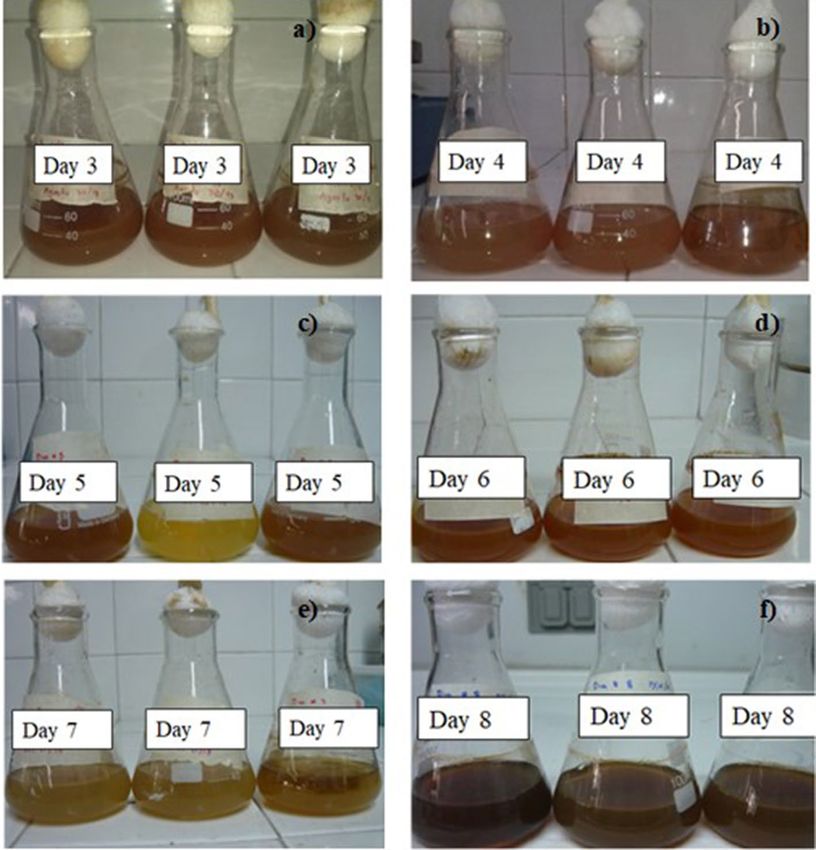
The change in color (CS samples in triplicate) were also verified with the Uv–Vis spectra. The higher absorb-
ance peaks were seen at 430 nm for the fungal extracts obtained from the following growth days: 4, 5, 6, 7 and 8
(Fig. 7). For the latter growth day, the highest absorbance band was seen after 144 h of reaction with 1 mM A
gNO3
Scientific Reports | (2021) 11:3842 | https://doi.org/10.1038/s41598-021-82514-8 5
Vol.:(0123456789)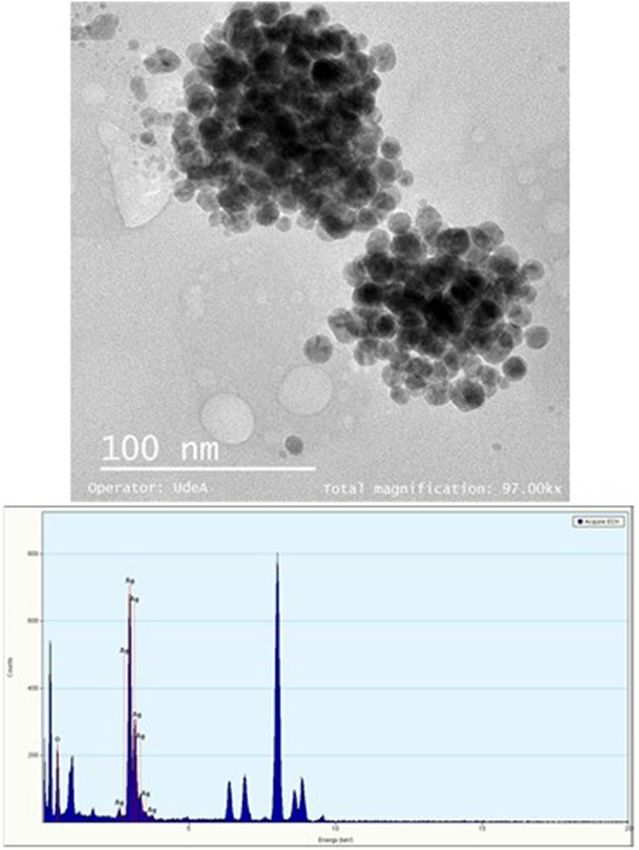
www.nature.com/scientificreports/

                                            Figure 3.  Response surface graphs for (a) t = 120 h (b) t = 144 h.

                                            Figure 4.  Area under the curve of the UV–Vis spectra (AUC). (a) t = 120 h (b) t = 144 h.

          Scientific Reports |   (2021) 11:3842 |                https://doi.org/10.1038/s41598-021-82514-8                             6

Vol:.(1234567890)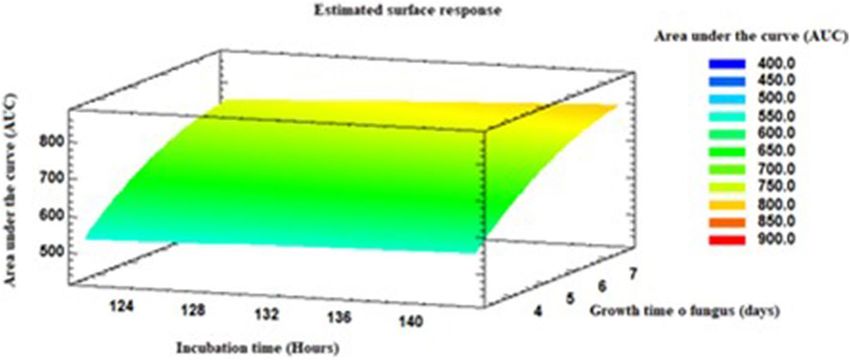
www.nature.com/scientificreports/
Figure 5. SEM–EDX analysis of the anamorphous Bjerkandera sp. R1 (a) 1 mM AgNO3 solution. Growth time:
7 days, incubation time 144 h. (b) EDX spectra 1 mM AgNO3 solution. Growth time: 7 days, incubation time
144 h (c) 0.5 mM AgNO3 solution. Growth time: 7 days. 144 h of incubation time (d) 1.5 mM AgNO3 solution.
Growth time: 7 days. 144 h of incubation time.
(CS sample) (Fig. 7f). With respect to day 7 of growth, it can be established that the filtered fungal extract from
this day, at the time of reacting with AgNO3 1 mM, showed much less color compared to day 6 and 8. This prob-
ably could have occurred because under these conditions anamorphous Bjerkandera sp. R1 finished its stationary
growth phase and entered the death phase. In this case, the secretion of proteins involved in the stabilization and
reduction process of Ag+ ions could be affected, causing a low synthesis rate in the fungal extract and an adverse
effect regarding the dispersion of the synthesized A gNPs23. With these growth days evaluated for the synthesis,
it could be seen that there were no shifts to the left (blue) or to the right (red) on the maximum wavelength in
the SPR peak; this process indicated according to Mie’s t heory32, that the anisotropy of the AgNPs decreased
considerably and that the size could have possibly been controlled (Fig. 7a-e)32–34. In this study, the SPR bands
founds suggested that the nanoparticles synthesized were s pherical32.
Table 4 presents the ANOVA on the effects of growth time of fungus, according to the values achieved
(p ≤ 0.05) with a confidence level of 95%. It was established that the growth time of the fungus had a significant
effect on the response variable, area under the curve of the UV–Vis spectra (AUC). Observing the response sur-
face graph, the best growth results obtained for the fungal extract was seen on the 8th day, which was incubated
for 144 h with 1 mM AgNO3 (Fig. 8). With regards to this result, the optimal time required for the fungus to
release more biomolecules in charge of the reduction process is the 8th day, and a greater AgNPs production is
more feasible with longer reaction times with 1 mM A gNO3. These findings can be compared with the research
carried out by Birla et al. where it reported that an absorbance peak intensity increase over time indicates the
continuous reduction of silver ions and an increase in the concentration of A gNPs35.
Considering the previously cited results, the TEM micrographs (Fig. 9) show the difference in size and shape
of the AgNPs once the fungal filtering was adjusted under the different conditions worked with. Most of the
particles observed were spherical and separated from each other, with little agglomeration and size distribu-
tion between 10 and 30 nm. These results suggest that in this process, biological residues (capping agents) may
have performed the function of reduction and stabilization of AgNPs36,37, as reported by Seetharaman et al.14,
Saravanan et al. 19 and Balakumaran et al.38 in studies using different types of fungi. Analysis through Energy
Dispersive X-ray (EDX) confirmed the presence of elemental silver signal (Fig. 8). Identification lines for the
major emission energies for silver (Ag) are displayed in a range between 2.8 and 3.4 keV confirming the pres-
ence of AgNPs in the fungal filtrate. Other peaks appear in the EDX spectra; this indicates that in the process
biomolecules were bound to the surface of AgNPs39.
Scientific Reports | (2021) 11:3842 | https://doi.org/10.1038/s41598-021-82514-8 7
Vol.:(0123456789)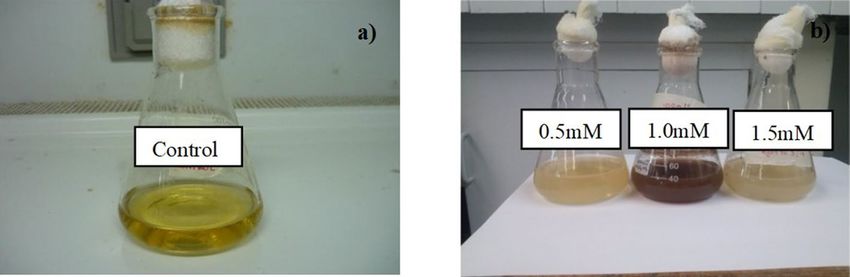
www.nature.com/scientificreports/
Figure 6. Formation of AgNPs after (a) 48 h of being incubated using a concentration of 1 Mm AgNO3 for
different growth times of the fungus anamorphous Bjerkandera sp. R1.
Effect of growth time on the biosynthesis of AgNPs using the fungus anamorphous Bjerkandera sp. R1. To evaluate
the possible molecules involved in the process of reduction and subsequent formation of AgNPs FTIR was used
(Fig. 10). These analyzes showed a broadband between 3300 and 3500 cm−1. This band can be assigned to the
–N–H stretching vibrations of amide band I and the O–H stretching of aromatic amines. On the other hand, a
prominent band was found between 1630 and 1680 cm−1, this band appears due to the vibrations of the –C=O
(carbonyl) stretching vibrations in the amide bond of the proteins secreted by the fungus in the CS sample29,40.
Another band appeared at 667 cm−1, this band corresponds to C–S stretching vibrations and possibly corre-
sponds to heterocyclic compounds that can be found in the fungal filtrate41. From these results it was shown that
probably the strong functional groups like carbonyl (–C=O) present in the fungal filtrate had more participation
in the synthesis. In this context, FTIR study confirmed that possibly the adsorptive carbonyl group from amino
acid residues and peptides of proteins had the stronger ability to bind silver ions (Ag+) in the mycelium21, and
then; the bioreduction of these ions both the wall of the fungus and the CS sample was perhaps due to the release
of some proteins which managed the nucleation and subsequent synthesis of A gNPs15,40,42,43, for this conditions,
an adequate affinity between the substrate and the biomolecules responsible for the reduction process may have
been achieved26. These findings are in agreement with several investigations that argue that functional groups
present in the extracellular substances work as a capping agent and better adsorb the particles located on the
surface of the mycelium, sealing the AgNPs and forming a coating with that prevents them from agglomerating
when the sample is being rocked17,40,44.
According to the evaluated days of growth, the SEM images show that most of the AgNPs biosynthesized,
present on the cell surface, are spherical with an approximate size of 30–100 nm. The result indicated that the
reduction process occurred on the surface of the mycelium and that the AgNPs were uniformly distributed,
forming small groups for the fungal material for all the growth times (Fig. 11a–e); but inhibiting the agglomerate
formation for the fungus that grew for 8 days (Fig. 11f, see black circles).
Since the best synthesis results were seen for the biomass obtained from day 8 of growth time of fungus
(Fig. 11f, see black circles), it is likely that the long-time exposure caused the depletion of the carbon and nitrogen
sources present in the fungal filtrate, and therefore facilitating the lysis of the fungal mycelium. In this context,
the membrane becomes more permeable; therefore, more extracellular substance (proteins) is retained between
Scientific Reports | (2021) 11:3842 | https://doi.org/10.1038/s41598-021-82514-8 8
Vol:.(1234567890)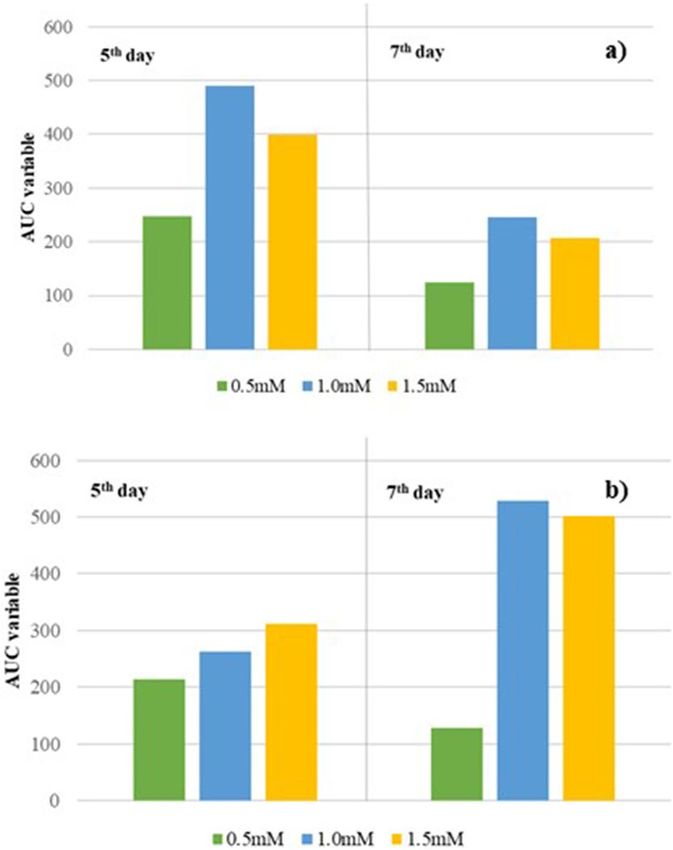
www.nature.com/scientificreports/
Figure 7. UV–Vis spectra for synthesized AgNPs using fungal filtrate from anamorphous Bjerkandera sp. R1
with a calculated error of: (a) Growth time 3 days (0.020–0.001); (b) Growth time 4 days (0.10–0.02); (c) Growth
time: 5 days (0.15–0.004); (d) Growth time: 6 days (0.1–0.001) (e) Growth time:7 days (0.04–0.0008) and f)
Growth time: 8 days (0.04–0.001). For a concentration of 1 mM A gNO3. Incubation time: 24 h , 48 h , 72 h
, 96 h , 120 h , 144 h .
Source F-Ratio P Value
A: Growth time of fungus 19.38 0.0001
B: Incubation time 0.64 0.4286
AA 1.00 0.3259
AB 0.05 0.8177
Table 4. Analysis of variance for the variable area under the curve. Effect growth time of fungus in the
synthesis of AgNPs.
Scientific Reports | (2021) 11:3842 | https://doi.org/10.1038/s41598-021-82514-8 9
Vol.:(0123456789)www.nature.com/scientificreports/
Figure 8. Response surface graphs. Effect growth time of the fungus in the synthesis of AgNPs.
Figure 9. Transmission Electron Microscopy (TEM) images and EDX spectra of silver nanoparticles
synthesized in the CS samples of the fungus anamorphous Bjerkandera sp. R1. Growth time of fungus: 8 days.
Incubation time: 144 h.
the interstices of the mycelium (Fig. 12b). Under these conditions, it was possible that at the time of reaction with
1 mM AgNO3 there was a greater adsorption of AgNPs on the surface of the mycelium, causing a better coating
and greater stabilization of particle size. The contrary occurred using biomass from shorter growth times (for
example, 5 days of growth time of the fungus) since little extracellular substance accumulated in the interstitial
spaces (in these conditions the fungal mycelium is not smoothed, (Fig. 12a) and the process of stabilization and
reduction of AgNPs was possibly affected, generating agglomerates and macroparticles formation. The EDX sup-
port showed strong signs of Ag014,30 and other elements such as carbon and oxygen. Regarding to these results
and considering what has been reported by Taboada-Puig et al.24, where it is argued that growth long periods of
the same fungus increase the production of proteins; it could be stated that a higher concentration of carbonyl
groups (Figs. 10 and 12b) act better as a capping agent by arresting the nucleation growth of AgNPs during
formation, giving rise to small sized particles (Fig. 11f, see black circles).
Scientific Reports | (2021) 11:3842 | https://doi.org/10.1038/s41598-021-82514-8 10
Vol:.(1234567890)www.nature.com/scientificreports/
Figure 10. FT-IR spectra of AgNPs synthesized by anamorphous Bjerkandera sp. R1.
Figure 11. SEM micrographs of the fungal mycelium anamorphous Bjerkandera sp. R1 treated with a 1 mM
AgNO3 solution. Growth time. (a) 3 days. (b) 4 days. (c) 5 days. (d) 6 days (e) 7 days and (f) 8 days.
Scientific Reports | (2021) 11:3842 | https://doi.org/10.1038/s41598-021-82514-8 11
Vol.:(0123456789)www.nature.com/scientificreports/
Figure 12. EDX spectra-data of the fungal mycelium anamorphous Bjerkandera sp. R1 treated with a 1 mM
AgNO3 solution. (a) Growth time 5 days. 144 h of incubation time. (b) Growth time 8 days. 144 h of incubation
time.
Conclusions
The effect of silver nitrate ( AgNO3) concentrations on the silver nanoparticle synthesis (AgNPs) was evaluated
and was established that this factor significantly affected the behavior of the fungus anamorphous Bjerkandera sp.
R1 against the ion reduction both in the fungal extract and on the mycelium surface. The best synthesis behavior
was observed for an incubation time of 144 h using a 1 mM A gNO3 concentration. When evaluating the effect
of growth time of fungus on the synthesis of AgNPs using this concentration, it was possible to corroborate that
proteins on surface of the mycelium or chemical functional groups fell off more easily on the fungal extract from
day 8, thus reducing most of the Ag+ in the 1 mM AgNO3 solution (CS sample) in A g0 nanoparticles. Finally, it
was found that the increase of the interstitial spaces of the mycelium was favored when the fungus grew during
this period. This condition triggered greater adsorption of the silver ions on the surface of the mycelium. In
this context and under prolonged reaction times with 1 mM A gNO3 (144 h), the greatest reduction of A g+ ions
g0 (MP sample) occurred.
in situ to A
Received: 15 October 2019; Accepted: 14 January 2021
References
1. Rhim, J.-W. & Wang, L.-F. Preparation and characterization of carrageenan-based nanocomposite films reinforced with clay mineral
and silver nanoparticles. Appl. Clay Sci. 97–98, 174–181 (2014).
2. Rajendran, N. K., Kumar, S. S. D., Houreld, N. N. & Abrahamse, H. A review on nanoparticle based treatment for wound healing.
J. Drug Deliv. Sci. Technol. 44, 421–430 (2018).
3. Naseri-Nosar, M. & Ziora, Z. M. Wound dressings from naturally-occurring polymers: a review on homopolysaccharide-based
composites. Carbohydr. Polym. 189, 379–398 (2018).
4. Prabhu, S. & Poulose, E. K. Silver nanoparticles: mechanism of antimicrobial action, synthesis, medical applications, and toxicity
effects. Int. Nano Lett. 2, 32 (2012).
5. Patil, S., George, T. & Mahadik, K. Green synthesized nanosilver loaded silk fibroin gel for enhanced wound healing. J. Drug Deliv.
Sci. Technol. 30, 30–36 (2015).
Scientific Reports | (2021) 11:3842 | https://doi.org/10.1038/s41598-021-82514-8 12
Vol:.(1234567890)www.nature.com/scientificreports/
6. Guan, Q., Xia, C. & Li, W. Bio-friendly controllable synthesis of silver nanoparticles and their enhanced antibacterial property.
Catal. Today 327, 196–202 (2019).
7. Wei, L. et al. Silver nanoparticles: synthesis properties and therapeutic applications. Drug Discov. Today 20, 595–601 (2015).
8. Dhayalan, M. et al. Biogenic synthesis, characterization of gold and silver nanoparticles from Coleus forskohlii and their clinical
importance. J. Photochem. Photobiol. B Biol. 183, 251–257 (2018).
9. Gurunathan, S. Biologically synthesized silver nanoparticles enhances antibiotic activity against gram-negative bacteria. J. Ind.
Eng. Chem. 29, 1–10 (2015).
10. Sana, S. S. & Dogiparthi, L. K. Green synthesis of silver nanoparticles using Givotia moluccana leaf extract and evaluation of their
antimicrobial activity. Mater. Lett. 226, 47–51 (2018).
11. Rajesh, K., Sourav, D. and Patra, C. R. Therapeutic applications of green-synthesized silver nanoparticles. In Green Synthesis,
Characterization and Applications of Nanoparticles 389–428 (2019)
12. Patel, D., Patel, M. & Krishnamurthy, R. Silver Nanoparticles : biosynthesis and its antimicrobial activity. Cibtech. J. Bio-Protoc. 2,
50–57 (2013).
13. Pantidos, N. & Horsfall, L. E. Biological synthesis of metallic nanoparticles by bacteria, fungi and plants. J. Nanomed. Nanotechnol.
5, 10 (2014).
14. Seetharaman, P. K. et al. Antimicrobial and larvicidal activity of eco-friendly silver nanoparticles synthesized from endophytic
fungi Phomopsis liquidambaris. Biocatal. Agric. Biotechnol. 16, 22–30 (2018).
15. Madakka, M., Jayaraju, N. & Rajesh, N. Mycosynthesis of silver nanoparticles and their characterization. MethodsX 5, 20–29 (2018).
16. Azmath, P., Baker, S., Rakshith, D. & Satish, S. Mycosynthesis of silver nanoparticles bearing antibacterial activity. Saudi Pharm.
J. 24, 140–146 (2016).
17. Chan, Y. S. & Don, M. M. Biosynthesis and structural characterization of Ag nanoparticles from white rot fungi. Mater. Sci. Eng.
C 33, 282–288 (2013).
18. Gudikandula, K., Vadapally, P. & Charya, M. A. S. Biogenic synthesis of silver nanoparticles from white rot fungi: their charac-
terization and antibacterial studies. OpenNano 2, 64–78 (2017).
19. Saravanan, M., Arokiyaraj, S., Lakshmi, T. & Pugazhendhi, A. Synthesis of silver nanoparticles from Phenerochaete chrysosporium
(MTCC-787) and their antibacterial activity against human pathogenic bacteria. Microb. Pathog. 117, 68–72 (2018).
20. Osorio-echavarría, J., Gómez-vanegas, N. A., Osorio-echavarría, J. & Ossa-orozco, C. P. Preparation of carrageenan biofilms
mixed with silver nanoparticles by biological synthesis method • Obtención de biopelículas de carragenina suplementadas con
nanopartículas de plata sintetizadas biológicamente. Dyna 84, 82–87 (2017).
21. He, K. et al. Applications of white rot fungi in bioremediation with nanoparticles and biosynthesis of metallic nanoparticles. Appl.
Microbiol. Biotechnol. 101, 4853–4862 (2017).
22. Kobashigawa, J. M., Robles, C. A., Martínez Ricci, M. L. & Carmarán, C. C. Influence of strong bases on the synthesis of silver
nanoparticles (AgNPs) using the ligninolytic fungi Trametes trogii. Saudi J. Biol. Sci. 26, 1331–1337 (2019).
23. Osorio-echavarría, J. Mejoramiento de la Síntesis de Nanopartículas de Plata a partir del Hongo Ligninolítico Anamorfo R1 de
Bjerkandera sp. y su Evaluación para Aplicación en Apósitos. http://bibliotecadigital.udea.edu.co/handle/10495/15557 (2020).
24. Taboada-Puig, R. et al. A new strain of Bjerkandera sp. production, purification and characterization of versatile peroxidase. World
J. Microbiol. Biotechnol. 27, 115–122 (2011).
25. Gaviria-arroyave, M. I., Osorio-echavarría, J. & Gómez-vanegas, N. A. Evaluating the scale-up of a reactor for the treatment of
textile effluents using Bjerkandera sp. Rev. Fac. Ing. Univ. Antioquia 88, 80–90 (2018).
26. Husseiny, S. M., Salah, T. A. & Anter, H. A. Biosynthesis of size controlled silver nanoparticles by Fusarium oxysporum, their
antibacterial and antitumor activities. Beni-Suef Univ. J. Basic Appl. Sci. 4, 225–231 (2015).
27. Delgado-Beleño, Y., Martinez-Nuñez, C. E., Cortez-Valadez, M., Flores-López, N. S. & Flores-Acosta, M. Optical properties of
silver, silver sulfide and silver selenide nanoparticles and antibacterial applications. Mater. Res. Bull. 99, 385–392 (2018).
28. Arenas-Ramos, C. Síntesis de nanopartículas metálicas a partir de extractos de raspo de uva. Preprint at https://upcommons.upc.
edu/handle/2117/118065 (2017).
29. Hamedi, S., Shojaosadati, S. A., Shokrollahzadeh, S. & Hashemi-Najafabadi, S. Extracellular biosynthesis of silver nanoparticles
using a novel and non-pathogenic fungus, Neurospora intermedia: controlled synthesis and antibacterial activity. World J. Microbiol.
Biotechnol. 30, 693–704 (2014).
30. AbdelRahim, K. et al. Extracellular biosynthesis of silver nanoparticles using Rhizopus stolonifer. Saudi J. Biol. Sci. 24, 208–216
(2017).
31. Zhang, J. & Elser, J. J. Carbon:Nitrogen:Phosphorus stoichiometry in fungi: a meta-analysis. Front. Microbiol. 8, 1–9 (2017).
32. De Sio, L. Active Plasmonic Nanomaterials. (ed. De Sio, L.) 37–40 (Taylor & Francis Group, LLC, 2015).
33. Verma, A. & Mehata, M. S. Controllable synthesis of silver nanoparticles using neem leaves and their antimicrobial activity. J.
Radiat. Res. Appl. Sci. 9, 109–115 (2016).
34. Mogensen, K. B. & Kneipp, K. Size-dependent shifts of plasmon resonance in silver nanoparticle films using controlled dissolution:
monitoring the onset of surface screening effects. J. Phys. Chem. C 118, 28075–28083 (2014).
35. Birla, S. S., Gaikwad, S. C., Gade, A. K. & Rai, M. K. Rapid synthesis of silver nanoparticles from Fusarium oxysporum by optimiz-
ing physicocultural conditions. Sci. World J. 2013, 1–12 (2013).
36. Nayak, B. K., Nanda, A. & Prabhakar, V. Biogenic synthesis of silver nanoparticle from wasp nest soil fungus, Penicillium italicum
and its analysis against multi drug resistance pathogens. Biocatal. Agric. Biotechnol. 16, 412–418 (2018).
37. Syed, A., Saraswati, S., Kundu, G. C. & Ahmad, A. Biological synthesis of silver nanoparticles using the fungus Humicola sp. And
evaluation of their cytoxicity using normal and cancer cell lines. Spectrochim. Acta Part A Mol. Biomol. Spectrosc. 114, 144–147
(2013).
38. Balakumaran, M. D., Ramachandran, R., Balashanmugam, P., Mukeshkumar, D. J. & Kalaichelvan, P. T. Mycosynthesis of silver
and gold nanoparticles: optimization, characterization and antimicrobial activity against human pathogens. Microbiol. Res. 182,
8–20 (2016).
39. Ravichandran, V. et al. Green synthesis, characterization, antibacterial, antioxidant and photocatalytic activity of Parkia speciosa
leaves extract mediated silver nanoparticles. Results Phys. 15, 1–8 (2019).
40. Sanghi, R. & Verma, P. Biomimetic synthesis and characterisation of protein capped silver nanoparticles. Bioresour. Technol. 100,
501–504 (2009).
41. Wang, L., Wu, Y., Xie, J., Wu, S. & Wu, Z. Characterization, antioxidant and antimicrobial activities of green synthesized silver
nanoparticles from Psidium guajava L. leaf aqueous extracts. Mater. Sci. Eng. C. 86, 1–8 (2018).
42. Devi, L. S. & Joshi, S. R. Ultrastructures of silver nanoparticles biosynthesized using endophytic fungi. J. Microsc. Ultrastruct. 3,
29–37 (2014).
43. Wanarska, E. & Maliszewska, I. The possible mechanism of the formation of silver nanoparticles by Penicillium cyclopium. Bioorg.
Chem. 93, 1–9 (2019).
44. Vigneshwaran, N., Kathe, A. A., Varadarajan, P. V., Nachane, R. P. & Balasubramanya, R. H. Biomimetics of silver nanoparticles
by white rot fungus, Phaenerochaete chrysosporium. Colloids Surf. B Biointerfaces 53, 55–59 (2006).
Scientific Reports | (2021) 11:3842 | https://doi.org/10.1038/s41598-021-82514-8 13
Vol.:(0123456789)www.nature.com/scientificreports/
Acknowledgements
The authors express their special appreciations to Bioprocesos Research Group and Biomateriales Research Group
belonging to the Engineering School of Universidad de Antioquia for their collaboration in the development
of this research work.
Author contributions
J.O.E. wrote the main manuscript text, prepared all figures and tables. J.O.E., C.P.O.O. and N.A.G.V. oversaw the
project, assisted with the writing of the manuscript, and checked the methodology and analysis of the results.
Competing interests
The authors declare no competing interests.
Additional information
Correspondence and requests for materials should be addressed to J.O.-E.
Reprints and permissions information is available at www.nature.com/reprints.
Publisher’s note Springer Nature remains neutral with regard to jurisdictional claims in published maps and
institutional affiliations.
Open Access This article is licensed under a Creative Commons Attribution 4.0 International
License, which permits use, sharing, adaptation, distribution and reproduction in any medium or
format, as long as you give appropriate credit to the original author(s) and the source, provide a link to the
Creative Commons licence, and indicate if changes were made. The images or other third party material in this
article are included in the article’s Creative Commons licence, unless indicated otherwise in a credit line to the
material. If material is not included in the article’s Creative Commons licence and your intended use is not
permitted by statutory regulation or exceeds the permitted use, you will need to obtain permission directly from
the copyright holder. To view a copy of this licence, visit http://creativecommons.org/licenses/by/4.0/.
© The Author(s) 2021
Scientific Reports | (2021) 11:3842 | https://doi.org/10.1038/s41598-021-82514-8 14
Vol:.(1234567890)You can also read