Public service governance and administration survey 2020-21
←
→
Page content transcription
If your browser does not render page correctly, please read the page content below
Public service governance and administration survey 2020-21

Research report

Prepared for The Pensions Regulator by OMB Research
June 2021

      OMB Research Limited – The Stables, Bradbourne House, East Malling, West Malling, Kent, ME19 6DZ
                 T: 01732 220582 E: info@ombresearch.co.uk W: www.ombresearch.co.uk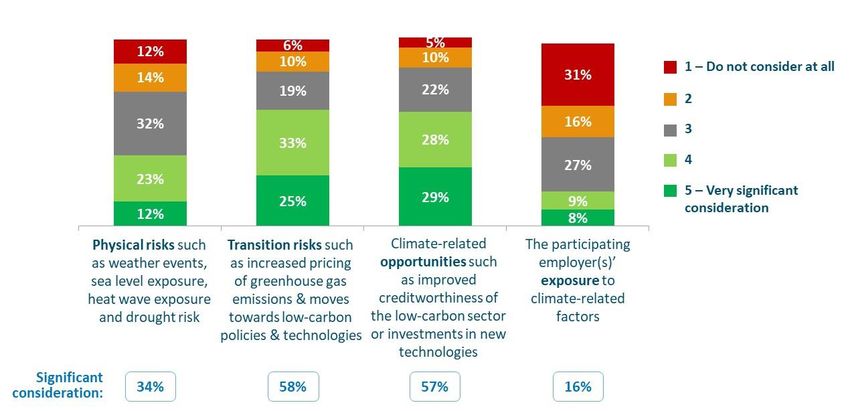
Contents

Contents

1.     Executive summary ............................................................................... 1
     1.1    Introduction ........................................................................................ 1
     1.2    Key processes ................................................................................... 1
     1.3    The pension board ............................................................................. 2
     1.4    Managing risk .................................................................................... 3
     1.5    Administration and record-keeping .................................................... 3
     1.6    Cyber security .................................................................................... 4
     1.7    Annual benefit statements ................................................................. 5
     1.8    Resolving issues ................................................................................ 5
     1.9    Reporting breaches ........................................................................... 6
     1.10   Addressing governance and administration issues............................ 6
     1.11   COVID-19 pandemic.......................................................................... 6
     1.12   Pensions dashboards ........................................................................ 7
     1.13   Climate change .................................................................................. 7
     1.14   Perceptions of TPR............................................................................ 8

2.     Introduction............................................................................................ 9
     2.1    Background ....................................................................................... 9
     2.2    Objectives .......................................................................................... 9
     2.3    Communications activities ............................................................... 10

3.     Methodology ........................................................................................ 10
     3.1    Sampling.......................................................................................... 11
     3.2    Fieldwork ......................................................................................... 11
     3.3    Respondent profile .......................................................................... 12
     3.4    Analysis and reporting conventions ................................................. 12
Contents

4.     Research findings ............................................................................... 14
     4.1    Scheme governance ........................................................................ 14
     4.2    Managing risk .................................................................................. 24
     4.3    Administration and record-keeping .................................................. 31
     4.4    Cyber security .................................................................................. 39
     4.5    Annual benefit statements ............................................................... 43
     4.6    Resolving issues .............................................................................. 47
     4.7    Reporting breaches ......................................................................... 50
     4.8    Addressing governance and administration issues.......................... 53
     4.9    The COVID-19 pandemic ................................................................ 55
     4.10   Pensions dashboards ...................................................................... 58
     4.11   Climate change ................................................................................ 62
     4.12   Perceptions of TPR.......................................................................... 66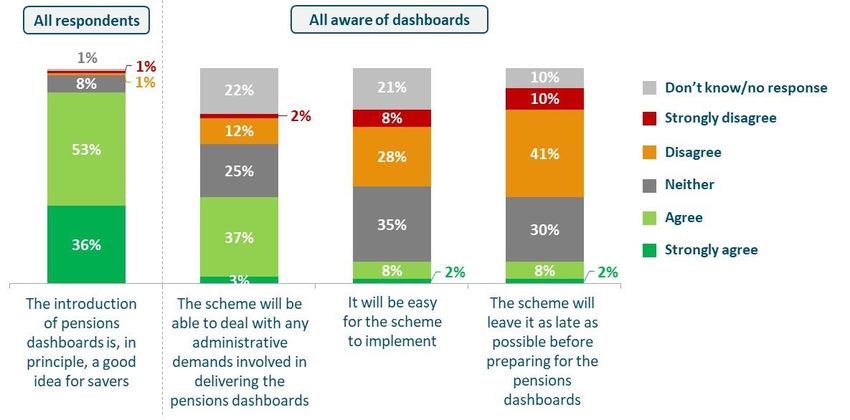
1.        Executive summary

1.        Executive summary
1.1       Introduction
This report summarises results from The Pensions Regulator’s (TPR’s) Public
Service Pension Scheme (PSPS) Governance and Administration Survey
2020-21. The survey was undertaken by OMB Research, an independent
market research agency, on behalf of TPR.
The primary objective of the survey was to track governance and
administration practices among public service pension schemes. In addition,
the 2020-21 survey also included new questions on schemes’ response to the
COVID-19 pandemic, awareness and perceptions of the pensions dashboards,
and the actions taken by Local Government schemes in relation to climate-
related risks and opportunities.
The survey was conducted online between January and March 2021, and was
completed by representatives of 193 public service pension schemes out of the
existing entirety of 206.

1.2       Key processes
There was little change since 2019 for the key processes that The
Pensions Regulator (TPR) monitors as indicators of public service
scheme performance. However, the proportion of schemes with all six
processes in place increased to 70% from 64% in 2019.
Between 85% and 95% of schemes reported that they had each of these
processes in place. Results were generally similar to the 2019 survey.
However, there was an increase in the proportion with processes to monitor
the accuracy and completeness of records (from 92% to 95%) and a decrease
in the proportion with the knowledge, understanding and skills needed to
properly run the scheme (from 97% to 95%).
Over two-thirds (70%) of schemes had all six of these processes in place,
together representing 68% of all memberships. This was an increase from
2019, when 64% of schemes had all six.
Three-quarters of Local Government (75%) and Firefighters’ (74%) schemes
had all six processes in place. This proportion was lower for ‘Other’1 (64%) and
Police (55%) schemes.

1
  Centrally administered unfunded schemes, i.e. excluding relevant Local Government, Firefighters’ and Police
schemes.

                                                                                                                1
1.        Executive summary

Figure 1.2.1 Schemes’ performance on key processes

1.3      The pension board
Approaching half of schemes held four or more pension board meetings
in the previous 12 months2, a fall from 2019. The mean number of current
board members at the time they completed the survey was 7.1.
Schemes held an average of 3.4 board meetings in the previous 12 months,
with 45% reporting that they held four or more (-12 percentage points from
2019) and 22% that they met twice or less. ‘Other’ and Police schemes were
most likely to have held at least four board meetings in the previous 12 months
(82% and 74% respectively), with Firefighters’ and Local Government schemes
least likely (32% and 33% respectively).
On average 93% of board meetings were attended by the scheme manager or
their representative, similar to in 2019.
Almost three-quarters (72%) of schemes had more than five current board
members at the time they completed the survey, and the mean number was
7.1. Around a third (31%) of schemes had one or more vacant position on the
board. Six schemes (3%) reported that they had fewer current board members

2
  TPR sets an expectation that the governing boards of pension schemes should meet often enough to maintain
effective oversight and control, which in most cases will be at least quarterly.

                                                                                                              2
1.        Executive summary

at the time they completed the survey than specified by their respective
regulations3.
Over half (58%) of schemes had a succession plan for members of the pension
board, rising to 76% of Police schemes. This was consistent with the 2019
survey results.
The majority of schemes (94%) felt that, over the previous 12 months, their
pension board had access to all the information about the operation of the
scheme that it needed to fulfil its functions. A similar proportion believed the
board was able to obtain sufficient specialist advice on cyber security (92%).
Both of these were higher than in the 2019 survey (5 percentage points higher
in both cases).
Overall, 85% of schemes evaluated the board’s knowledge, understanding and
skills at least annually, an increase from 76% in 2019. This increase was
driven by Police schemes, 88% of which evaluated the board at least annually
(+28 percentage points from 2019). On average, pension board members
received ten hours of training per year in relation to their role on the board.

1.4       Managing risk
Risk exposure was reviewed at the majority of board meetings, but there
was a fall in the proportion of schemes with their own risk register.
On average, schemes’ exposure to new and existing risks had been reviewed
at 84% of the pension board meetings held in the previous 12 months, an
increase from 77% in 2019. Just over a third (35%) of schemes reported that
risk exposure had been reviewed at four or more board meetings over this
period, consistent with the 2019 survey.
The proportion of schemes with their own risk register fell from 93% in 2019 to
89% in the 2020-21 survey. This decline was primarily caused by ‘Other’ and
Police schemes (-18 and -7 percentage points respectively).
Approaching two-thirds (61%) of schemes identified remediation (the McCloud
judgment) as one of the top three risks they faced. A smaller proportion of
Local Government schemes cited this (37%).

1.5       Administration and record-keeping
As in the 2019 survey findings, administration was included on the
agenda at the majority of board meetings and three-quarters of schemes
had an administration strategy.
On average, administration was included on the agenda at 92% of the board
meetings held in the previous 12 months (similar to 2019). Most schemes

3
  Five of these six schemes reported that they had vacant positions on their board at the time they completed the
survey. If these vacant positions were filled then, four of these five schemes would have met the minimum requirement
for the number of pension board members for their type of scheme (the other scheme would still have been below the
minimum threshold). The remaining scheme did not report any vacant positions.

                                                                                                                 3
1.     Executive summary

(73%) had an administration strategy in place, although this was less
widespread among Firefighters’ schemes (47%).
Every scheme (100%) saw implementing legislative change and addressing
issues that impaired their ability to run the scheme effectively as important
administration objectives (with 97% and 94% respectively describing these as
‘very important’). In contrast, schemes were least likely to see reducing costs
(53%) or moving to a new administrator/administration system (26%) as
important.
Four in ten schemes stated that all their employers had always provided
data on time in the last 12 months (40%) and had always provided
accurate and complete data (39%), consistent with the 2019 results.
These proportions were lower for multi-employer schemes than single
employer schemes. Approximately one in ten (9%) multi-employer schemes
said all their employers had always provided the data required each month on
time over the previous 12 months, compared with 85% of single employer
schemes. Similarly, 9% of multi-employer schemes said all their employers
always provided accurate and complete data, compared with 83% of single
employer schemes.
A higher proportion of schemes (64%) reported that all their employers
had submitted all data electronically in the last 12 months.
There was little difference between multi-employer and single employer
schemes in this respect, with 61% of the former and 69% of the latter reporting
that all their employers had submitted all data electronically.
On average, 4% of employers had not provided any data electronically in the
last 12 months.

1.6   Cyber security
Nine in ten schemes (90%) had at least half of the recommended cyber
risk controls in place, an improvement since 2019. The proportion who
reported experiencing any cyber breaches or attacks in the last 12
months was lower than in 2019.
Schemes were asked about 14 specific cyber controls and 90% had at least
half of these in place, an increase from 82% in 2019.
For 11 of the 14 cyber controls, the overall proportion of schemes with these in
place was higher than in 2019. The greatest increases were seen for the
scheme manager assuring themselves of third party providers’ controls (+12
percentage points), assessment of the likelihood of different types of breaches
occurring (+12 percentage points) and the scheme manager receiving regular
updates on cyber risks, incidents and controls (+10 percentage points).
A third (34%) of schemes reported that they had experienced some kind of
cyber breach or attack in the previous 12 months (a decrease from 42% in

                                                                             4
1.     Executive summary

2019). These incidents typically involved staff receiving fraudulent emails or
being directed to fraudulent websites (29%).
Most schemes that experienced any cyber breaches or attacks in the previous
12 months said that these had no impact, but 5% reported a negative impact
(equating to 2% of all public service schemes). This is a fall from 15% in the
2019 survey.
A fifth (20%) of schemes that experienced cyber security breaches or attacks
in the last 12 months had reported these to other parties (typically to their
pension board and/or members), and 11% of those with an incident response
plan indicated that this had been triggered by the cyber breach/attack.

1.7    Annual benefit statements
Over nine in ten active members received their annual benefit statement
by the statutory deadline in 2020, unchanged from 2019. More schemes
achieved this for all their active members than in 2019.
On average, 94% of active members received their statement by the deadline,
consistent with the 95% seen in 2019. The proportion of schemes meeting the
deadline for all their active members increased from 53% to 59%. This
proportion was highest for Firefighters’ and Police schemes (83% and 60%
respectively) but lower for ‘Other’ (45%) and Local Government (48%)
schemes (both of which are primarily multi-employer schemes and typically
have a greater number of members than Firefighters’ and Police schemes).
Fewer schemes who missed the annual benefit statement (ABS) deadline for
any active members reported this to TPR than in 2019 (29% vs. 42%). A fifth
(18%) made a breach of the law report. Those schemes which did not report
the missed deadline typically said this was because it was not seen as material
as few statements were affected or it was a very short delay.
As in 2019, the vast majority of schemes (92%) reported that every statement
they sent out contained all the data required by regulations.

1.8    Resolving issues
Around 10,000 complaints were estimated to have been made to public
service schemes in the last year. This equated to 0.6 complaints per
1,000 members, a similar ratio to in 2019.
On average, half (50%) of all complaints entered the Internal Dispute
Resolution (IDR) process and 22% of these were upheld.
The types of complaints entering the IDR process varied by scheme type, but
overall the most common related to eligibility for ill health benefit (46%) and
disputes or queries about the amount of benefit paid (39%).

                                                                                 5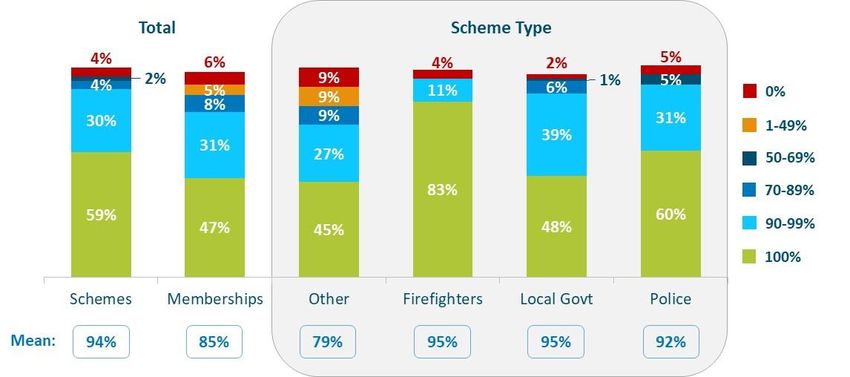
1.     Executive summary

1.9   Reporting breaches
The vast majority of schemes maintained documented records of
breaches of the law identified (98%), included the decision on whether to
report to TPR in these records (95%), and provided the pension board
with reports on any breaches (95%).
Over a third of schemes (37%) identified breaches of the law in the previous 12
months (excluding those relating to annual benefit statements), and 5% had
reported any breaches to TPR (a decrease from 8% in 2019).
Local Government schemes were most likely to have identified breaches of the
law (55%) and Police schemes least likely (14%).

1.10 Addressing governance and administration issues
The remediation (McCloud) process, scheme complexity and the volume
of changes required to comply with legislation were seen as the top
barriers to improving scheme governance and administration in the next
12 months.
Two-thirds (65%) of schemes identified the remediation process as one of the
top three barriers they faced to improving governance and administration, an
increase from 42% in the 2019 survey. Similar proportions also cited the
complexity of the scheme (62%) and the volume of changes required to comply
with legislation (61%) as major barriers (with the latter increasing from 49% in
2019).
The remediation process was the most commonly identified barrier for ‘Other’
(91%), Firefighters’ (79%) and Police schemes (81%), but fewer Local
Government schemes selected it as one of the major challenges they faced
(47%).
Improved governance and administration was primarily attributed to a
better understanding of the risks facing the scheme.
Most schemes (68%) felt that the improvements they made to scheme
governance and administration over the previous 12 months were down to an
improved understanding of the risks facing the scheme. This was followed by
better understanding of the underlying legislation and standards expected by
TPR (46%) and resources being increased or redeployed to address risks
(42%).

1.11 COVID-19 pandemic
Almost all schemes had a business continuity plan in place prior to the
COVID-19 pandemic, and these were widely felt to have been effective.
The vast majority (95%) of schemes had a business continuity plan (BCP) in
place before the first COVID-19 lockdown started in March 2020, with 59%
having their own BCP and 36% using their local authority’s BCP.

                                                                             6
1.     Executive summary

Most of these (87%) judged their BCP to have been effective in helping the
scheme respond to the pandemic, with 60% describing it as ‘very effective’.
The main barriers to implementing the BCP were felt to have been the
suitability of IT hardware (31%), ability of staff to work from home (29%) and
suitability of IT infrastructure (22%). However, a third (35%) did not experience
any barriers.
Over nine in ten schemes felt that communications between the scheme
manager and administrator (97%), the performance of the administrator (94%),
and the relationship between the scheme manager and the pension board
(93%) had been effective since the start of the pandemic.

1.12 Pensions dashboards
While awareness of the dashboards was near universal and most
schemes believed they were a good idea, there were some concerns
about schemes’ ability to implement them.
The majority of respondents had heard of the pensions dashboards (96%) and
most also knew that the Pensions Bill 2020 requires trustees and scheme
managers to provide data to savers through the dashboards (88%).
There was broad consensus that the dashboards were a good idea for savers
(89% agreed), but fewer schemes agreed that they would be able to deal with
any administrative demands involved (40%) and that the dashboards would be
easy for their scheme to implement (9%). A minority (10%) expected to leave
preparations as late as possible.
The main challenges schemes expected to face when preparing for the
dashboards were software compatibility (75%) and knowing what is required
(58%). Most expected to learn more about the requirements from their scheme
advisory board (69%), the Pensions Dashboards Programme (63%) or TPR
(61%).

1.13 Climate change
Nine in ten Local Government schemes had allocated time or resources
to assessing any financial risks and opportunities arising from climate
change, and most were aware of the Taskforce on Climate-related
Financial Disclosures (TCFD).
The survey questions on climate change were asked only of Local Government
schemes (as these are the only funded PS schemes). Overall, 91% had
allocated time or resources to assessing climate change risks/opportunities,
but fewer had assessed particular climate-related scenarios (66%), tracked
their portfolio’s carbon intensity (60%) or assessed their portfolio’s potential
contribution to global warming (29%).
Two-thirds (68%) had added climate-related risks to their risk register, and
around two-fifths had regularly covered these issues at board meetings (42%),
assigned responsibility to a specified individual or sub-committee (37%) and
incorporated targets into their climate policy (37%).

                                                                              7
1. Executive summary
Approaching three-fifths of schemes gave significant consideration to the risk
of transitioning to a low carbon economy (58%) and climate-related
opportunities (57%) in their investment and funding strategy, but fewer
considered physical risks (34%) or the participating employer’s exposure
(16%).
The majority of schemes (83%) were aware of the work of the TCFD, and 22%
made disclosures as recommended by the TCFD.
1.14 Perceptions of TPR
More schemes agreed that TPR was fair, clear, approachable and
evidence-based than in 2019.
The proportion of schemes that agreed TPR was fair increased from 66% in
2019 to 77% in the 2020-21 survey. There was also increased agreement that
TPR was clear (from 70% to 77%), approachable (from 76% to 81%) and
evidence-based (from 71% to 76%).
As in 2019, of the various descriptors of TPR that were asked about, schemes
were most likely to agree that TPR was visible (84%), respected (84%) and
approachable (81%), and least likely to see the organisation as decisive (63%)
and tough (52%).
TPR was widely felt to be effective at improving standards of governance
and administration. It was also perceived to be clear about its
administration expectations, effective at changing behaviour among its
regulated audiences, and proactive at reducing risks to member benefits.
Overall, 87% of schemes judged TPR to be very or fairly effective at improving
standards of governance and administration in public service pension schemes
(unchanged from 2019). Every ‘Other’ scheme (100%) felt that TPR was
effective in this regard.
The majority of schemes also agreed that TPR clearly explains its expectations
in respect of administration (84%), is effective at bringing about the right
changes in behaviour among its regulated audiences (79%) and is proactive at
reducing serious risks to members’ benefits (75%). Again, ‘Other’ schemes
were typically most positive about these areas.
82. Introduction
2. Introduction
2.1 Background
The Public Service Pensions Act 2013 and the Public Service Pensions Act
(Northern Ireland) 2014 (together, the Public Service Acts) introduced new
requirements for the governance and administration of public service pension
schemes. Scheme managers must run their schemes according to these legal
requirements, which generally came into force on 1 April 2015.
The Public Service Acts also gave TPR an expanded role to regulate the
governance and administration of these schemes from 1 April 2015. TPR’s
code of practice for the governance and administration of public service
pension schemes (the PSPS code) sets out the standards of conduct and
practice it expects of those responsible, as well as practical guidance about
how to comply with the legal requirements.
As part of its role, TPR is responsible for 205 public service schemes in
respect of eight public service workforces, covering around 18.4 million
memberships.
A survey was first undertaken in 2015 to assess how schemes were meeting
the new requirements, and the standards to which they were being run. Further
surveys have been run annually to provide a regular assessment of
performance, understand barriers to improvement, and delve deeper into the
top risks facing public service schemes.
2.2 Objectives
The specific objectives of the 2020-21 survey were to continue to track:
• Public service pension schemes’ governance and administration
practices, including their approach to risk management, complaints and
breaches of the law and any barriers they faced;
• The cyber security controls that schemes had in place and any
breaches/attacks experienced;
• Perceptions of TPR and its effectiveness at improving scheme
governance and administration standards.
In addition, the 2020-21 survey also sought to understand:
• Schemes’ response to the COVID-19 pandemic, with a particular focus
on business continuity planning;
• Awareness and perceptions of the pensions dashboards, and any
challenges anticipated;
• The extent to which Local Government schemes assessed, managed
and prioritised climate-relates risks and opportunities.
93. Methodology
2.3 Communications activities
TPR continues to engage with those acting in the public service pension
scheme landscape. In 2020 this activity included:
• presenting at conferences, workshops and training events, and;
• engagement with schemes and scheme advisory boards.
The engagement is tailored to the audience and situation. It ranges from
overviews and summaries of scheme manager and pension board roles and
responsibilities to focused presentations on key issues of importance such as
cyber security, data improvement and governance. TPR also maintains
supervisory relationships with certain large schemes in the public service
scheme landscape to better understand the practical operational challenges
facing schemes.
3. Methodology
As with the previous TPR public service pension scheme surveys, an online
self-completion approach was adopted for the following reasons:
• The large amount of data to collect would have made a telephone
interview very long and burdensome for respondents.
• It was anticipated that many individuals would need to do some
checking/verification in order to answer the questions accurately.
• The range of information requested meant that it was important to allow
more than one person at the scheme to contribute.
Owing to the nature and the amount of information required, a carefully
structured research approach was necessary, giving respondents early
warning of the kinds of information that we were seeking to collect and allowing
them to devote an appropriate amount of time and effort to providing accurate
and reliable information, liaising with colleagues if needed. Therefore, a multi-
stage approach was adopted:
• Stage 1: Pre-notification emails were sent by TPR to the pension board
chairs and scheme managers to explain the nature of the research,
introduce OMB Research (OMB), alert schemes that their participation
would be requested and ask them to let OMB know whether the scheme
manager or their representative would be completing the survey and, if
necessary, provide their contact details.
• Stage 2: OMB sent a tailored invitation email to each scheme manager or
their chosen representative. This contained a unique survey URL and a
link to a ‘hard copy’ of the questionnaire (for reference when compiling
information prior to completion).
o In the case of referrals, sample details were updated so that the
most appropriate person was contacted going forward.
103. Methodology
• Stage 3: OMB sent a further two tailored reminder emails to schemes
that had either not started the survey or had only partially completed it.
• Stage 4: OMB executives undertook a phase of telephone chasing with
non-responders. These calls ensured that the invitation email had been
received, confirmed the identity of the most appropriate individual to
complete the survey and encouraged schemes to take part.
3.1 Sampling
The sample for this research was extracted from TPR’s scheme registry
database. The target audience was scheme managers of open public service
schemes or their representatives. For the purpose of the survey, each locally-
administered section of relevant Firefighters’, Police and Local Government
schemes was treated as a separate scheme, forming a total universe of 205
schemes at the time the 2020-21 survey was conducted.
Scheme managers or their representatives were asked to work with the
pension board chair to complete the survey and, where necessary, seek input
from others with specialist knowledge (e.g. the scheme administrator).
3.2 Fieldwork
All surveys were completed between 20 January and 8 March 2021. In total,
293 of the 205 public service pension schemes completed the survey. This
equates to a 94% response rate, covering 99% of all memberships.
Table 3.2.1 Interview numbers and universe
Schemes Memberships
Scheme type Interviews Survey Survey
Universe Universe
coverage coverage
Other 11 11 100% 11,058,653 100%
Firefighters 47 50 94% 123,431 95%
Local Government 93 98 95% 6,791,973 98%
Police 42 46 91% 386,775 96%
Total 193 205 94% 18,360,832 99%
The majority (86%) of the completed surveys were submitted in response to
the initial email and reminders, with the remainder submitted during (or shortly
after) the telephone chasing phase.
113. Methodology
3.3 Respondent profile
Scheme managers or their representatives contributed to 85% of submitted
surveys, and directly completed it in 74% of cases. Over half (54%) of the
surveys were completed with input from the pension board chair, with other
board members involved in 17%. Approaching two-thirds (61%) involved
consultation with the scheme administrator.
Table 3.3.1 Respondent role
Respondent role Completed Consulted Total
By with (involved)
Scheme manager 27% 16% 43%
Representative of the scheme manager4 47% 29% 63%
Pension board chair 5% 49% 54%
Pension board member4 3% 15% 17%
Administrator 13% 47% 61%
Other role 6% 12% 12%
Net: Scheme manager/representative 74% 40% 85%
Net: Pension board chair/member 7% 59% 65%
3.4 Analysis and reporting conventions
Throughout this report, results are reported at an aggregate level for all
respondents and by cohort: Local Government, Firefighters’, Police and
‘Other’5 schemes. The cohorts are grouped in this way to reflect the different
governance structures, funding methods and employer profiles.
To ensure that results are representative of all public service pension
schemes, the data throughout this report is shown weighted. Scheme data has
been weighted based on the number of public service schemes of each type.
Membership data has been weighted based on the total number of
memberships in each scheme type. It should be noted that the membership-
weighted results are heavily influenced by the ‘Other’ schemes, which
accounted for 60% of all memberships at the time the 2020-21 survey was
undertaken. The narrative commentary in this report therefore typically focuses
on the scheme-weighted findings.
Where available and comparable, the results from the previous two PSPS
governance and administration surveys (2018 and 2019) have been included.
When interpreting the data presented in this report, please note that results
may not sum to 100% due to rounding and/or due to respondents being able to
select more than one answer to a question.
4
For ‘representative of the scheme manager’, ‘pension board member’ and ‘other role’, the total percentage is lower
than the sum of the completed by and consulted with percentages. This is because there can be more than one person
at the scheme in these roles, and in some cases one completed the survey and another consulted on it, so they
appear in both these columns (but only count once in the total column).
5
Centrally administered unfunded schemes, i.e. excluding relevant Local Government, Firefighters’ and Police
schemes.
123. Methodology
Data presented in this report are from a sample of public service schemes
rather than the total population. This means the results are subject to sampling
error. Differences between cohorts and different years of the research have
been tested for statistical significance, using finite population correction (i.e.
reflecting that 98% of the total public service scheme universe completed the
survey). Differences are commented on in the text only if they are statistically
significant at the 95% confidence level. This means there is no more than a 5%
chance that any reported differences are not real but a consequence of
sampling error.
134. Research findings
4. Research findings
4.1 Scheme governance
On average, schemes had scheduled 4.0 pension board meetings in the
previous 12 months, with 78% of schemes scheduling four or more board
meetings over that period.
However, not all the scheduled meetings went ahead; schemes reported that
they held an average of 3.4 board meetings in the previous 12 months, with
approaching half (45%) holding four or more. Almost a quarter (22%) reported
that their pension board had met twice or less in the previous 12 months.
On average the scheme manager or their representative had attended 3.1
meetings in the previous 12 months, and 36% of schemes indicated that they
had attended at least four board meetings during that period.
Figure 4.1.1 Number of pension board meetings in last 12 months
All respondents (Base, Don’t know, Did not answer question) - Schemes (193, 1-2%, 2%)
The mean proportion of scheduled pension board meetings that actually took
place was 84%. On average, 93% of the meetings that took place were
attended by the scheme manager or their representative.
Table 4.1.1 Proportion of pension board meetings that went ahead and
were attended by scheme manager/representative
Total schemes
Base: All respondents 202
% of scheduled meetings that took place (mean) 84%
% of meetings attended by scheme manager/representative (mean) 93%
144. Research findings
‘Other’ and Police schemes were most likely to have held at least four
meetings in the last 12 months (82% and 74% respectively, compared with
32% of Firefighters’ and 33% of Local Government schemes).
Table 4.1.2 Number of pension board meetings in last 12 months - by
scheme type
Scheme Type
Other Firefighters Local Govt Police
Base: All respondents 11 47 93 42
Mean 5.0 3.7 4.1 3.9
Scheduled to take place
At least 4 91% 72% 77% 83%
Mean 4.7 2.9 3.3 3.8
Actually took place
At least 4 82% 32% 33% 74%
Attended by scheme Mean 4.7 2.7 3.1 3.1
manager/representative At least 4 82% 26% 31% 48%
% of scheduled meetings that took
94% 80% 78% 97%
place (mean)
% of meetings attended by scheme
100% 92% 96% 82%
manager/representative (mean)
The proportion of schemes that scheduled at least four board meetings
increased since 2019 (from 73% to 78%), but there was a fall in the proportion
that held at least four (from 57% to 45%). There was a corresponding decline
in the percentage of meetings that actually took place (from 94% to 85%)
Table 4.1.3 Number of pension board meetings in last 12 months – Time
series
Scheme Type
Total
Survey Fire- Local
schemes Other Police
fighters Govt
2020-21 78% 91% 72% 77% 83%
At least 4 meetings scheduled
2019 73% 100% 49% 74% 89%
At least 4 meetings actually took 2020-21 45% 82% 32% 33% 74%
place 2019 57% 82% 31% 67% 58%
At least 4 meetings attended by 2020-21 36% 82% 26% 31% 48%
scheme manager/representative 2019 52% 82% 24% 65% 47%
% of scheduled meetings that took 2020-21 84% 94% 80% 78% 97%
place (mean) 2019 94% 93% 91% 97% 90%
% of meetings attended by scheme 2020-21 93% 100% 92% 96% 82%
manager/representative (mean) 2019 95% 100% 93% 98% 92%
154. Research findings
The overall fall in the proportion that held at least four board meetings was
driven by Local Government schemes (from 67% in 2019 to 33% in the 2020-
21 survey). However, there was an increase in this regard for Police schemes
(from 58% to 74%).
Consistent with the above time series analysis, 39% of schemes indicated that
they had held less board meetings than in the previous 12 month period. Most
of the remainder said it was the same (43%) but a fifth (19%) held more
meetings than in the previous 12 months.
Over half (55%) of Local Government schemes reported a fall in the number of
board meetings held.
Figure 4.1.2 Change in number of pension board meetings that took place
compared with previous 12 month period
All that knew number of board meetings held in last 12 months (Base, Don’t know, Did not answer question) -
Schemes (188, 0%, 0%), Other (10, 0%, 0%), Firefighters (45, 0%, 0%), Local Govt (93, 0%, 0%), Police (40, 0%, 0%)
Schemes were asked whether the scheme manager and pension board had
sufficient time and resources to run the scheme properly, and whether they
had access to all the necessary knowledge, understanding and skills.
Figure 4.1.3 shows that 95% believed the scheme manager and pension board
had access to all the necessary knowledge and skills. Schemes were
comparatively less likely to report that they had sufficient time and resources,
but 87% still agreed this was the case.
Overall, 89% of all memberships were in a scheme where the scheme
manager and pension board had sufficient time and resources, and 92% were
in a scheme where they had access to all the necessary knowledge and skills.
164. Research findings
Figure 4.1.3 Scheme manager and pension board resources and
knowledge
All respondents (Base, Don’t know, Did not answer question) - Schemes (193, 2-3%, 3%), Memberships (193, 1%,
6%), Other (11, 0%, 9%), Firefighters (47, 0-2%, 2%), Local Govt (93, 3%, 1-2%), Police (42, 0-5%, 5%)
Small schemes with fewer than 2,000 memberships were least likely to feel
they had sufficient time and resources (71%). However, there were no
differences by scheme size when it came to having access to the necessary
knowledge, understanding and skills.
Table 4.1.4 shows that the proportion of schemes reporting that their scheme
manager and pension board had sufficient time and resources fell since 2019
(from 90% to 87%) and there was a similar decrease for access to all the
necessary knowledge, understanding and skills (from 97% to 95%). The former
decline was evident for all scheme types aside from Local Government,
whereas the latter applied only to ‘Other’ and Police schemes.
Table 4.1.4 Scheme manager and pension board resources and
knowledge – Time series
Total Scheme Type
schemes Other Firefighters Local Govt Police
Sufficient time and resources to run the scheme properly
PSPS Survey 2020-21 87% 91% 81% 87% 90%
PSPS Survey 2019 90% 100% 88% 87% 98%
PSPS Survey 2018 91% 100% 87% 89% 95%
Access to all the knowledge, understanding and skills necessary to properly run the scheme
PSPS Survey 2020-21 95% 91% 98% 95% 93%
PSPS Survey 2019 97% 100% 98% 95% 98%
PSPS Survey 2018 96% 100% 98% 96% 93%
174. Research findings
In the majority of cases (85%) the scheme manager or pension board carried
out an evaluation of the board’s knowledge, understanding and skills at least
annually.
Figure 4.1.4 Frequency of scheme manager or pension board carrying
out an evaluation of the knowledge, understanding and skills of the
board in relation to running the scheme
All respondents (Base, Don’t know, Did not answer question) - Schemes (193, 1%, 2%), Memberships (193, 1%, 6%),
Other (11, 0%, 9%), Firefighters (47, 0%, 2%), Local Govt (93, 2%, 0%), Police (42, 0%, 2%)
There was an increase since 2019 in the proportion of schemes that evaluated
their board at least annually, from 76% to 85%. This was primarily driven by
Police schemes (+28 percentage points), but also increased among Local
Government schemes (+5 percentage points). In comparison, there was a fall
for ‘Other’ schemes (-9 percentage points).
Table 4.1.5 Proportion of schemes that carried out an evaluation of the
knowledge, understanding and skills of the board at least annually –
Time series
Total Scheme Type
schemes Other Firefighters Local Govt Police
PSPS Survey 2020-21 85% 73% 87% 83% 88%
PSPS Survey 2019 76% 82% 86% 78% 60%
PSPS Survey 2018 82% 64% 76% 86% 82%
As shown in Figure 4.1.5, pension board members received an average of 10
hours training per year in relation to their role on the board, rising to 13 hours
for Local Government schemes. This was consistent with the 2019 survey
results.
184. Research findings
Figure 4.1.5 Hours of training per year for each pension board member in
relation to their role on the board
All respondents (Base) - Schemes (193), Memberships (193), Other (11), Firefighters (47), Local Govt (93), Police (42)
Most schemes (94%) believed that their pension board had access to all the
information about the operation of the scheme it had needed to fulfil its
functions in the previous 12 months. This rose to 100% of Police schemes.
Figure 4.1.6 Proportion of schemes where pension board had access to
all the information about the operation of the scheme it needed to fulfil its
functions in last 12 months
All respondents (Base, Don’t know, Did not answer question) - Schemes (193, 3%, 2%), Memberships (193, 2%, 6%),
Other (11, 0%, 9%), Firefighters (47, 0%, 4%), Local Govt (93, 5%, 0%), Police (42, 0%, 0%)
More schemes felt the board had access to the information it needed to fulfil its
functions than in 2019 (94% vs. 89%). This increase was evident for Local
Government and Police schemes, but there was a decrease for ‘Other’ and
Firefighters’ schemes.
194. Research findings
Table 4.1.6 Proportion of schemes where pension board had access to all
the information about the operation of the scheme it needed to fulfil its
functions in last 12 months – Time series
Total Scheme Type
schemes Other Firefighters Local Govt Police
PSPS Survey 2020-21 94% 91% 94% 92% 100%
PSPS Survey 2019 89% 100% 98% 81% 93%
Overall, 92% of schemes felt that their pension board was able to obtain
sufficient specialist advice on cyber security when needed. This was broadly
consistent by scheme type (88% to 96%).
Figure 4.1.7 Proportion of schemes where pension board was able to
obtain sufficient specialist advice on cyber security when needed
All respondents (Base, Don’t know, Did not answer question) - Schemes (193, 6%, 2%), Memberships (193, 3%, 6%),
Other (11, 0%, 9%), Firefighters (47, 2%, 2%), Local Govt (93, 9%, 1%), Police (42, 5%, 0%)
This proportion was higher than in 2019 (92% vs. 87%), with the greatest
increase seen among Police schemes (+13 percentage points).
Table 4.1.7 Proportion of schemes where pension board had access to all
the information about the operation of the scheme it needed to fulfil its
functions in last 12 months – Time series
Total Scheme Type
schemes Other Firefighters Local Govt Police
PSPS Survey 2020-21 92% 91% 96% 88% 95%
PSPS Survey 2019 87% 100% 90% 86% 82%
As shown in Table 4.1.8, almost three-quarters (72%) of schemes had more
than five current members on their pension board at the time they completed
204. Research findings
the survey. The mean number of current board members was 7.1 (compared
with 6.9 in the 2019 survey).
Table 4.1.8 Number of current pension board members
Total schemes
Base: All respondents 193
2-3 current board members 3%
4-5 current board members 23%
6-7 current board members 36%
8-9 current board members 18%
10+ current board members 17%
Mean number of current board members 7.1
Don’t know 1%
Did not answer question 2%
Six schemes (3%) had fewer current board members at the time they
completed the survey than specified by their respective regulations. Of these,
four were Local Government and two were Police schemes. This compares
with eight schemes in 2019 (four Local Government and four Police).
Schemes were also asked to provide details of the number of vacant positions
on their board, the number of board members that had left in the previous 12
months and the number of members appointed in this period.
Around two-thirds (64%) reported that one or more board members had left in
the previous 12 months, and the same proportion (64%) indicated that they
had made any new appointments. Approaching a third (31%) of schemes said
they had at least one vacant position on the board at the time they completed
the survey.
Table 4.1.9 Turnover of pension board members
Vacant Members that left Members appointed
positions in last 12 months in last 12 months
Base: All respondents 193 193 193
0 67% 35% 34%
1 24% 37% 36%
2 4% 23% 21%
3 1% 3% 4%
4+ 2% 1% 3%
Net: 1+ 31% 64% 64%
Mean 0.5 1.0 1.1
Don’t know 1% 0% 0%
Did not answer question 2% 2% 2%
214. Research findings
Further analysis was conducted to assess the total number of board positions
in each scheme. The number of ‘total positions’ on the board was calculated by
combining the number of current board members and number of vacant
positions.
As shown in Table 4.1.10, the mean number of total positions was 7.6. On
average, schemes reported that 14% of the total positions on their board had
left in the previous 12 months and 15% had been appointed in the previous 12
months. The mean proportion of total board positions that were vacant at the
time the schemes completed the survey was 6%.
Table 4.1.10 Number of total pension board positions (current members
plus vacant positions)
Total schemes
Base: All respondents 193
Mean number of total positions on board (current + vacant) 7.6
Mean % of total positions that are vacant 6%
Mean % of total positions that left in last 12 months 14%
Mean % of total positions appointed in last 12 months 15%
‘Other’ schemes tended to have the greatest number of current board
members (a mean of 12.0), whereas Firefighters’ and Local Government
schemes had the fewest (5.9 and 6.6 respectively). Firefighters’ schemes had
the fewest vacant board positions (a mean of 0.2, equating to 2% of total
positions).
Table 4.1.11 Number and turnover of pension board members – by
scheme type
Scheme Type
Fire- Local
Other Police
fighters Govt
Base: All respondents 11 47 93 42
Mean no. of current board members 12.0 5.9 6.6 8.3
Mean no. of vacant positions 1.6 0.2 0.5 0.4
Mean no. of board members that left in last 12 months 1.4 1.0 0.8 1.3
Mean no. of board members appointed in last 12 months 1.5 1.2 0.9 1.3
Mean % of total positions that are vacant 8% 2% 7% 5%
Mean % of total positions that left in last 12 months 10% 17% 11% 16%
Mean % of total positions appointed in last 12 months 11% 20% 12% 16%
As mentioned previously, six schemes had fewer current board members at
the time they completed the survey than specified by their respective
regulations. The four Local Government schemes all indicated that they had
224. Research findings
vacant positions on their board. If these vacant positions were filled then they
would all have met the minimum requirement for the number of pension board
members for Local Government schemes.
Of the two Police schemes that had fewer current board members than
required by their regulations, one did not report any vacant positions. The other
indicated declared that they had one vacancy, but if this was filled they would
still be below the minimum requirement for Police schemes.
Figure 4.1.8 shows that 58% of schemes had a succession plan in place for
members of the pension board. This was most likely to be the case among
Police schemes (76%).
Figure 4.1.8 Proportion of schemes with a succession plan in place for
pension board members
All respondents (Base, Don’t know, Did not answer question) - Schemes (193, 5%, 2%), Memberships (193, 8%, 6%),
Other (11, 9%, 9%), Firefighters (47, 0%, 2%), Local Govt (93, 5%, 0%), Police (42, 10%, 2%)
Results were broadly consistent with the 2019 survey, although Local
Government schemes were less likely to have a succession plan in place (51%
vs. 59%).
Table 4.1.12 Proportion of schemes with a succession plan in place for
pension board members – Time series
Total Scheme Type
schemes Other Firefighters Local Govt Police
PSPS Survey 2020-21 58% 64% 53% 51% 76%
PSPS Survey 2019 54% 64% 57% 59% 72%
234. Research findings
4.2 Managing risk
Figure 4.2.1 shows the proportion of schemes that had various risk
management processes and procedures in place, along with comparative data
from the 2019 survey.
Table 4.2.1 Proportion of schemes with risk managements processes and
procedures - Time series
Total Scheme Type
Survey Member- Fire- Local
Schemes Other Police
ships fighters Govt
Base: All respondents 193 193 11 47 93 42
2020-21 85% 83% 82% 83% 84% 90%
Its own documented
procedures for assessing and 2019 82% 92% 100% 76% 80% 87%
managing risk
2018 92% 98% 100% 80% 96% 93%
A documented policy to 2020-21 92% 92% 91% 94% 94% 88%
manage the pension board
2019 92% 81% 73% 94% 92% 93%
members’ conflicts of
interest 2018 90% 86% 82% 85% 93% 91%
Processes to monitor records 2020-21 95% 93% 91% 94% 97% 95%
for all membership types on
2019 92% 97% 100% 94% 94% 82%
an ongoing basis to ensure
they are accurate/complete 2018 91% 92% 91% 85% 95% 89%
2020-21 89% 88% 82% 96% 99% 64%
A process for monitoring the
2019 96% 100% 100% 90% 100% 93%
payment of contributions
2018 98% 100% 100% 96% 100% 95%
2020-21 92% 88% 82% 96% 98% 76%
A process for resolving
2019 92% 99% 100% 82% 98% 89%
contribution payment issues
2018 94% 99% 100% 85% 98% 95%
2020-21 95% 87% 82% 98% 94% 100%
Procedures to identify
2019 94% 96% 100% 98% 90% 98%
breaches of the law
2018 94% 95% 100% 89% 96% 93%
Procedures to assess 2020-21 97% 93% 91% 98% 96% 100%
breaches of the law and
2019 96% 98% 100% 98% 96% 93%
report these to TPR if
required 2018 95% 99% 100% 89% 98% 95%
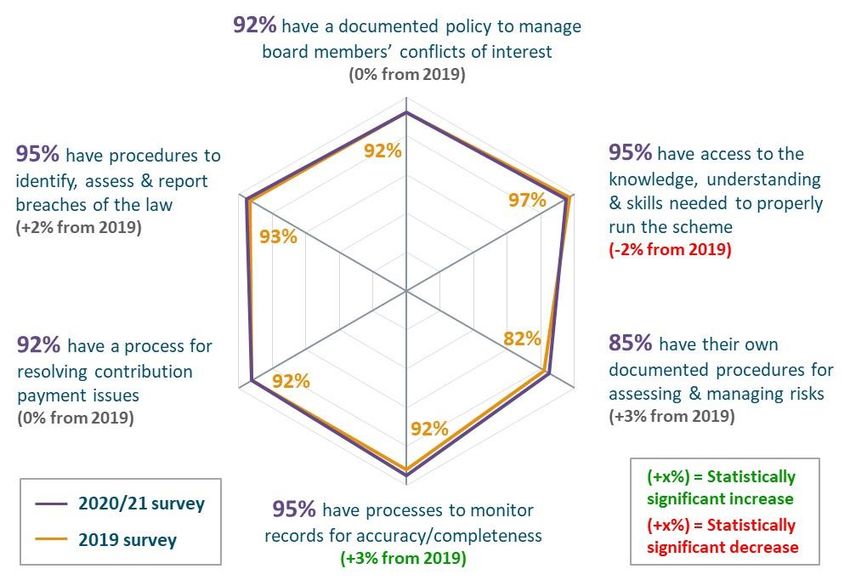
Over nine in ten schemes had a policy to manage board members’ conflicts of
interest (92%), processes to monitor records for accuracy and completeness
(95%), a process for resolving contribution payment issues (92%), procedures
to identify breaches of the law (95%) and procedures to assess and report
breaches (97%).
244. Research findings
Slightly fewer had a process for monitoring the payment of contributions (89%)
and their own documented procedures for assessing and managing risk (85%).
Results were generally consistent with the 2019 survey, with the only changes
at the total sample level being an increase in the proportion of schemes with a
process to monitor records for accuracy and completeness (+3 percentage
points) and a decrease in the proportion with a process for monitoring the
payment of contributions (-7 percentage points).
However, there were some changes at a scheme type level. In particular,
‘Other’ schemes were less likely than in 2019 to have these processes and
procedures in place (with the exception of procedures to identify and report
breaches of the law). The proportion of Police schemes with a process for
monitoring contribution payments and resolving contribution payment issues
also fell (by -29 and -13 percentage points respectively).
As summarised in Figure 4.2.1, where schemes had these processes and
procedures they had typically reviewed them within the last 12 months.
However, this was least likely to be the case for conflicts of interest policies
(51%), and procedures to identify (61%) and report (62%) breaches of the law.
Most of the remainder had reviewed these in the last three years, with few
schemes last reviewing them more than three years ago (1-4%) or never
reviewing them (0-2%).
Figure 4.2.1 When risk management processes and procedures were last
reviewed
All with each process/procedure in place (Base, Don’t know, Did not answer question) - Assessing & managing risk
(164, 5%, 1%), Manage conflicts of interest (178, 7%, 2%), Monitor records to ensure accurate & complete (184, 6%,
1%), Monitoring payment of contributions (173, 3%, 1%), Resolving contribution payment issues (177, 5%, 1%),
Identify breaches (184, 6%, 1%), Assess & report breaches (187, 7%, 1%)
254. Research findings
While this varied across the different processes and procedures, ‘Other’
schemes were generally most likely to have reviewed these in the last 12
months. Firefighters’ schemes typically reviewed these less frequently, with
this particularly true of the processes relating to contribution payments and
breaches of the law.
Table 4.2.2 Proportion reviewing each risk management process and
procedure in the last 12 months – by scheme type
Scheme Type
Fire- Local
Other Police
fighters Govt
Base: All with each process or procedure 9-10 39-46 78-92 27-42
Own documented procedures for assessing and
78% 85% 86% 74%
managing risk
Documented policy to manage the pension board
80% 45% 49% 54%
members’ conflicts of interest
Processes to monitor records for all membership
types on an ongoing basis to ensure they are 100% 86% 81% 78%
accurate and complete
Process for monitoring the payment of contributions 100% 62% 78% 93%
Process for resolving contribution payment issues 89% 60% 70% 88%
Procedures to identify breaches of the law 67% 54% 63% 64%
Procedures to assess breaches of the law and report
60% 54% 63% 67%
these to TPR if required
The vast majority (89%) of schemes had a risk register, with this most likely to
be the case for Local Government schemes (95%).
Figure 4.2.2 Proportion of schemes with their own risk register
All respondents (Base, Don’t know, Did not answer question) - Schemes (193, 1%, 2%), Memberships (193, 0%, 1%),
Other (11, 0%, 0%), Firefighters (47, 2%, 2%), Local Govt (93, 0%, 2%), Police (42, 2%, 0%)
264. Research findings
The proportion of schemes with a risk register fell slightly since 2019 (89% vs.
93%), with the greatest decline seen for ‘Other’ schemes (-18 percentage
points) and Police schemes (-7 percentage points)6.
Table 4.2.3 Proportion of schemes with a risk register – Time series
Total Scheme Type
schemes Other Firefighters Local Govt Police
PSPS Survey 2020-21 89% 82% 83% 95% 86%
PSPS Survey 2019 93% 100% 86% 96% 93%
PSPS Survey 2018 94% 100% 87% 98% 93%
Schemes were asked to identify the top three governance and administration
risks on their register (or facing the scheme if they did not have a risk register).
Table 4.2.4 Top governance and administration risks
Total Scheme Type
Top Mentions (5%+) Member Fire- Local
Schemes Other Police
-ships fighters Govt
Base: All respondents 193 193 11 47 93 42
Remediation (McCloud judgement) 61% 60% 73% 74% 37% 95%
Record-keeping (i.e. receipt and
36% 35% 36% 43% 32% 38%
management of correct data)
Securing compliance with changes in
30% 28% 27% 45% 30% 17%
scheme regulations
Funding or investment 28% 20% 0% 6% 54% 5%
Cyber risk 26% 15% 9% 26% 23% 36%
Recruitment and retention of staff or
22% 25% 27% 30% 22% 14%
knowledge
Lack of resources/time 17% 14% 9% 15% 22% 12%
Systems failures (IT, payroll,
15% 23% 27% 15% 16% 12%
administration systems, etc)
Administrator issues (expense,
14% 20% 27% 23% 10% 10%
performance, etc)
Guaranteed Minimum Pension (GMP)
10% 13% 18% 2% 3% 31%
reconciliation
Production of annual benefit statements 8% 19% 27% 6% 6% 7%
6
It appears unusual for a scheme to have a risk register one year and not have one the
following year. It is not possible for us to know why this is the case. We can only speculate that
it may be that a different person each year completes the survey and they have different views
or interpret the question differently each year; or it could genuinely be that a scheme had a
register previously but no longer have one.
274. Research findings
Lack of knowledge, effectiveness or
6% 3% 0% 6% 6% 5%
leadership among key personnel
Receiving contributions from the
5% 3% 0% 2% 9% 2%
employer(s)
Don’t know 1% 0% 0% 0% 1% 0%
Did not answer question 0% 0% 0% 0% 0% 0%
A wide range of risks were reported by schemes but the most prevalent was
remediation (61%). This was mentioned by 95% of Police schemes and was
also the top risk for ‘Other’ (73%) and Firefighters’ (74%) schemes.
The next most widely identified risks were record-keeping (36%), regulatory
compliance (30%), funding or investment (28%) and cyber risk (26%). Funding
or investment was the top risk for Local Government schemes (54%) but was
rarely mentioned by other scheme types (0-6%).
Irrespective of whether it was identified as one of the top risks they faced,
schemes were asked what actions they had taken in relation to the remediation
proposals. Table 4.2.5 shows that most had taken a range of different actions,
with the most common being assessing the possible administration impacts
(88%) and assessing the data requirements (79%).
Table 4.2.5 Actions taken in relation to the remediation proposals
Total Scheme Type
Top Mentions (5%+) Member Fire- Local
Schemes Other Police
-ships fighters Govt
Base: All respondents 193 193 11 47 93 42
Assessed the possible administration
88% 90% 91% 79% 89% 95%
impacts
Assessed the data requirements 79% 83% 82% 66% 87% 74%
Assessed any additional resources likely
68% 79% 91% 64% 60% 86%
to be required
Discussed system requirements with IT
60% 80% 82% 32% 80% 43%
suppliers
Commenced a specific data cleansing or
48% 59% 64% 32% 54% 48%
data gathering exercise
Provided specific information to
32% 56% 82% 26% 14% 67%
members
Other 23% 41% 55% 15% 20% 31%
None of these 2% 1% 0% 4% 2% 0%
Don’t know 0% 0% 0% 0% 0% 0%
Did not answer question 0% 0% 0% 0% 0% 0%
Firefighters’ scheme had generally taken fewer actions in relation to the
remediation proposals than other public service schemes, with this particularly
28You can also read