Tagging Video Contents with Positive/Negative Interest Based on User's Facial Expression
←
→
Page content transcription
If your browser does not render page correctly, please read the page content below
Tagging Video Contents with Positive/Negative
  Interest Based on User’s Facial Expression

    Masanori Miyahara1, Masaki Aoki1 , Tetsuya Takiguchi2 , and Yasuo Ariki2
                   1
                     Graduate School of Engineering, Kobe University
                 {miyahara,masamax777}@me.cs.scitec.kobe-u.ac.jp
        2
            Organization of Advanced Science and Technology, Kobe University
                   1-1 Rokkodai, Nada, Kobe, Hyogo, 657-8501 Japan
                             {takigu,ariki}@kobe-u.ac.jp

        Abstract. Recently, there are so many videos available for people to
        choose to watch. To solve this problem, we propose a tagging system
        for video content based on facial expression that can be used for recom-
        mendations based on video content. Viewer’s face captured by a camera
        is extracted by Elastic Bunch Graph Matching, and the facial expres-
        sion is recognized by Support Vector Machines. The facial expression
        is classified into Neutral, Positive, Negative and Rejective. Recognition
        results are recorded as ”facial expression tags” in synchronization with
        video content. Experimental results achieved an averaged recall rate of
        87.61%, and averaged precision rate of 88.03%.

        Keywords: Tagging video contents, Elastic Bunch Graph Matching,
        Facial expression recognition, Support Vector Machines.

1     Introduction
Recently, multichannel digital broadcasting has started on TV. In addition,
video-sharing sites on the Internet, such as ”YouTube,” are becoming very pop-
ular. These facts indicate that there are too many videos with such a diversity of
content for viewers to select. To solve this problem, two main approaches have
been employed. One analyzes the video content itself, and the other analyzes the
viewer’s behavior when watching the video.
   For video content analysis, many studies have been carried out[1], such as shot
boundary determination, high-level feature extraction, and object recognition.
However, generic object recognition remains a difficult task.
   On the other hand, for a viewer’s behavior analysis, most often remote control
operation histories, registration of favorite key words or actors, etc. are used. K.
Masumitsu[2] focused on the remote control operation (such as scenes, etc. that
the viewer chose to skip), and calculated the importance value of scenes. T.
Taka[3] proposed a system which recommended TV programs if viewers gave
some key words. But these methods acquire only personal preferences, which
a viewer himself already knows. Furthermore, registering various key words or
actors is cumbersome for a viewer.

S. Satoh, F. Nack, and M. Etoh (Eds.): MMM 2008, LNCS 4903, pp. 210–219, 2008.

c Springer-Verlag Berlin Heidelberg 2008
Tagging Video Contents with Positive/Negative Interest 211
Moreover, there are some studies that focused on a viewer’s facial direction
and facial expression. M. Yamamoto[4] proposed a system for automatically
estimating the time intervals during which TV viewers have a positive interest
in what they are watching based on temporal patterns in facial changes using the
Hidden Markov Model. But it is probable that TV viewers have both positive
interest and negative interest.
Based on the above discussion, we propose in this paper a system for tag-
ging video content with the interest labels of Neutral, Positive, Negative and
Rejective. To classify facial expressions correctly, facial feature points must
be extracted precisely. From this viewpoint, Elastic Bunch Graph Matching
(EBGM)[5][6] is employed in the system. EBGM was proposed by Laurenz
Wiskott and proved to be useful in facial feature point extraction and face
recognition.
The rest of this paper is organized as follows. In section 2, the overview of
our system is described. In sections 3 and 4, the methods used in our system are
described. Experiments and evaluations are described in section 5. Future study
themes will be discussed in section 6.
2 Overview of Proposed System
Fig. 1 shows our experimental environment where a viewer watches video content
on a display. The viewer’s face is recorded into video by a webcam. A PC plays
back the video and also analyzes the viewer’s face.
Display
Webcam
PC
User
Fig. 1. Top View of Experimental Environment
Fig. 2 shows the system flow for analyzing the viewer’s facial video. At first,
exact face regions are extracted by AdaBoost[7] based on Haar-like features to
reduce computation time in the next process, and the face size is normalized.
Secondly, within the extracted face region, facial feature points are extracted by
Elastic Bunch Graph Matching based on Gabor feature. Thirdly, the viewer is
recognized based on the extracted facial feature points. Then, the personal model
of his facial expression is retrieved. In the personal model, the facial feature
points that were extracted from the viewer’s neutral (expressionless) image and
the facial expression classifier are already registered. Finally, the viewer’s facial
expression is recognized by the retrieved classifier, Support Vector Machines[8],
based on the feature vector computed as the facial feature point location differ-
ence between the viewer’s image at each frame and the registered neutral image.212 M. Miyahara et al.
Facial expression
AdaBoost Facial feature point recognition
extraction
Tag
EBGM
Neutral
SVM Positive
Person recognition
Negative
Viewer’s profile Rejective
Neutral image
Personal facial expression classifier
Fig. 2. System flow
Recognition results are recorded as ”facial expression tags”(Neutral, Positive,
Negative, Rejective) in synchronization with video content.
3 Facial Feature Point Extraction and Person Recognition
Using EBGM
3.1 Gabor Wavelets
Since Gabor wavelets are fundamental to EBGM, it is described here. Gabor
wavelets can extract global and local features by changing spatial frequency,
and can extract features related to a wavelet’s orientation.
Eq. (1) shows a Gabor Kernel used in Gabor wavelets. This function contains
→
−
a Gaussian function for smoothing as well as a wave vector k j that indicates
simple wave frequencies and orientations.
−
→2
− →2 −→ 2 2
→
− kj kj x → −
− → σ
ψj ( x ) = 2 exp − exp i k j x − exp − (1)
σ 2σ 2 2
−
→ kjx kν cos ϕμ
kj = = (2)
kjy kν sin ϕμ
Here, kν = 2− 2 πCϕμ = μ π8 . We employ a discrete set of 5 different frequencies,
ν+2
index ν = 0, ..., 4, and 8 orientations, index μ = 0, ..., 7.
3.2 Jet
A jet is a set of convolution coefficients obtained by applying Gabor kernels
with different frequencies and orientations to a point in an image. Fig.3 shows
an example of a jet. To estimate the positions of facial feature points in an input
image, jets in an input image are compared with jets in a facial model.Tagging Video Contents with Positive/Negative Interest 213
Orientations Map Jet to
Disk
Real part
low
Frequency
high
Imaginary part
low
Jet
high
Fig. 3. Jet example
A jet J is composed of 40 complex coefficients (5 frequencies × 8 orientations)
and expressed as follows:
Jj = aj exp(iφj ) (j = 0, ..., 39) (3)
where −
→x = (x, y), aj (−→
x ) and φj (−→x ) are the facial feature point coordinate,
magnitude of complex coefficient, and phase of complex coefficient, which rotates
the wavelet at its center, respectively.
3.3 Jet Similarity
For the comparison of facial feature points between the facial model and the input
image, the similarity is computed between jet set {J } and {J }. Locations of
two jets are represented as − →x and −x . The difference between vector −
→ →
x and
vector −
→
x is given in Eq. (4).
→ −
− dx
d =→ x −− →
x = (4)
dy
Here, let’s consider the similarity of two jets in terms of the magnitude and
phase of the jets as follows:
N −1
j=0 aj aj cos(φj − φj )
SD (J , J ) = (5)
N −1 N −1
j=0 a2j j=0 a2
j
where the phase difference φj − φj is qualitatively expressed as follows:
→ → −
− → → − → − − → −
− →
φj − φj = k j −
x − k j−
x = kj →
x −→
x = kj d (6)
To find the best similarity between {J } and {J } using Eq. (5) and Eq. (6),
→−
− →
phase difference is modified as φj − (φj + kj d ) and Eq. (5) is rewritten as
N −1 →−
− →
j=0 aj aj cos(φj − (φj + kj d ))
SD (J , J ) = (7)
N −1 N −1
j=0 a2j j=0 a2
j214 M. Miyahara et al.
→
−
In order to find the optimal jet J’ that is most similar to jet J, the best d is es-
timated that will maximize similarity based not only upon phase but magnitude
as well.
3.4 Displacement Estimation
→
−
In Eq. (7), the best d is estimated in this way. First, the similarity at zero
displacement (dx = dy = 0) is estimated. Then the similarity of its North,
East, South, and West neighbors is estimated. The neighboring location with
the highest similarity is chosen as the new center of the search. This process
is iterated until none of the neighbors offers an improvement over the current
location. The iteration is limited to 50 times at one facial feature point.
3.5 Facial Feature Points and Face Graph
In this paper, facial feature points are defined as the 34 points shown in Fig. 2
and Fig. 4. A set of jets extracted at all facial feature points is called a face
graph. Fig. 4 shows an example of a face graph.
Face Graph
Fig. 4. Jet extracted from facial feature points
3.6 Bunch Graph
A set of jets extracted from many people at one facial feature point is called a
bunch. A graph constructed using bunches at all the facial feature points is called
a bunch graph. In searching out the location of facial feature points, the similarity
described in Eq. (7) is computed between the jets in the bunch graph and a jet
at a point in an input image. The jet with the highest similarity, achieved by
→
−
moving d as described in Section 3.4, is chosen as the target facial feature point
in the input image. In this way, using a bunch graph, the locations of the facial
feature points can be searched allowing various variations. For example, a chin
bunch may include jets from non-bearded chins as well as bearded chins, to cover
the local changes. Therefore, it is necessary to train data using the facial data of
various people in order to construct the bunch graph. The training data required
for construction of bunch graph was manually collected.
3.7 Elastic Bunch Graph Matching
Fig. 5 shows an elastic bunch graph matching flow. First, after a facial image is
input into the system, a bunch graph is pasted to the image, and then a local
search for the input face commences using the method described in Section 3.4.Tagging Video Contents with Positive/Negative Interest 215
Input Image Pasted Local Search Face Graph
Fig. 5. Elastic Bunch Graph Matching procedure
Finally, the face graph is extracted after all the locations of the feature points
are matched.
3.8 Person (Face) Recognition
The extracted face graph is used for face recognition. For the comparison between
the extracted face graph G and the stored graph G , the similarity is computed
between face graphs G and G . Here, let’s consider the similarity of two face
graphs as follows:
1
M−1
Sjet (G, G ) = SD (Jj , Jj ) (8)
M j=0
where M is the number of the facial feature points for recognition. J , J are
sets of Jets for graphs G and G respectively. A person with the maximum Sjet
score is recognized as the input person.
4 Facial Expression Recognition Using SVM
4.1 Definition of Facial Expression Classes
To classify the viewer’s facial expression, the classes were conventionally defined
as ”interest” or ”disinterest.” But it is probable that the viewer’s interest is
positive, negative or neutral. For example, if the viewer watches a video that is
extremely unpleasant, he may be interested in watching it once, but never again.
From this viewpoint, in this study, three facial expression classes are defined;
Neutral, Positive and Negative. In addition, if the viewer does not watch the
display in a frontal direction or tilts his face, the system classifies it as Rejective
because their correct classification is difficult. Table 1 shows the class types and
the meanings.
4.2 SVM Algorithms
Support Vector Machines were pioneered by Vapnik[8]. SVM separate the train-
ing data in feature space by a hyperplane defined by the type of kernel function
employed. In this study, Radial Basis Function (RBF) is employed as a kernel
function. SVM finds the hyperplane with the maximum margin, defined as the
distances between the hyperplane and the nearest data point in each class. To
recognize multi-class data, SVM is extended by one-against-the-rest method.216 M. Miyahara et al.
Table 1. Facial expression classes
Classes Meanings
Neutral (Neu) Expressionless
Positive (Pos) Happiness, Laughter, Pleasure, etc.
Negative (Neg) Anger, Disgust, Displeasure, etc.
Not watching the display in the front direction,
Rejective(Rej) Occluding part of face,
Tilting the face, etc.
4.3 Feature Vector
The viewers of our system register their neutral images as well as the personal
facial expression classifier in advance. After EBGM recognizes a viewer in front
of the display, the system retrieves his neutral image and the personal facial ex-
pression SVM classifier. Then, the differences between the viewer’s facial feature
points extracted by EBGM and the viewer’s neutral facial feature points are
computed as a feature vector for SVM.
5 Experiments
5.1 Experimental Conditions
In the experimental environment shown in Fig. 1, two subjects, A and B, watched
four videos. They were instructed not to exaggerate or suppress their facial
expressions. The length of the videos was about 17 minutes in average. The
categories were ”variety shows” because these shows often make viewers change
their facial expressions, compared to other categories such as ”drama” or ”news.”
While they watched the videos, the system recorded their facial video in syn-
chronization with the video content at 15 frames per second. Then subjects A
and B tagged the video with four labels, Positive, Negative, Neutral and Rejec-
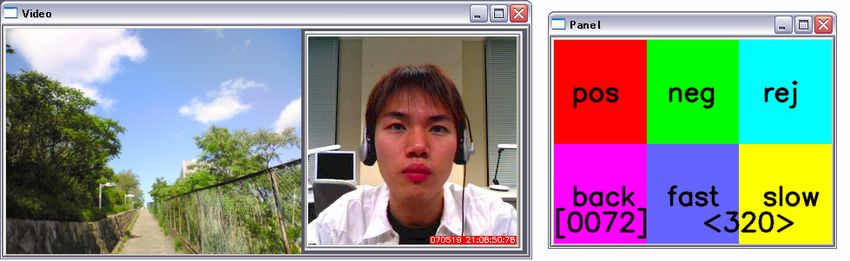
tive according to Table 1. To tag the video, an interface was used as shown in
Fig. 6. In the left window, the video content and the viewer’s facial video were
displayed. The subjects were asked to press the buttons in the right window to
classify the video frames into three classes while they watched both the video
content and their facial video in the left window. If no button was pressed, the
frame was classified as Neutral. Tagged results for all frames in the experimental
videos are shown in Table 2. We used those experimental videos and the tagging
data as training and test data in the subsequent section.
Table 2. Tagged results (frames)
Neu Pos Neg Rej Total
Subject A 49865 7665 3719 1466 62715
Subject B 56531 2347 3105 775 62758Tagging Video Contents with Positive/Negative Interest 217
Fig. 6. Tagging interface
5.2 Facial Region Extraction Using AdaBoost
Facial regions were extracted using AdaBoost based on Haar-like features[7] in
all frames of the experimental videos except Reject frames. Extracted frames
were checked manually to confirm whether they were false regions or not. The
experimental results are shown in Table 3.
Table 3. Experimental results of facial region extraction
a. Subject A b. Subject B
Neu Pos Neg Neu Pos Neg
False extraction 20 3 1 False extraction 132 106 9
Total frames 49865 7665 3719 Total frames 56531 2347 3105
Rate (%) 0.040 0.039 0.027 Rate (%) 0.234 4.516 0.290
In the experiments, extraction rates of the facial regions for both subject A
and B were 100%. On the other hand, averaged Neu, Pos and Neg false extraction
rates were 0.0354% for subject A and 1.68% for subject B. The reason for the
worse false extraction rate for subject B is attributed to his habit of raising his
head when he is excited.
5.3 Person Recognition Using EBGM
All faces correctly extracted by AdaBoost were recognized by Elastic Bunch
Graph Matching. Experimental results are shown in Table 4.
Table 4. Person recognition experiment
a. Subject A b. Subject B
Neu Pos Neg Neu Pos Neg
False recognition 2 0 0 False recognition 2 20 0
Total frames 49845 7662 3718 Total frames 56399 2241 3096
Rate (%) 0.004 0.000 0.000 Rate (%) 0.004 0.893 0.000218 M. Miyahara et al.
As the data in the table shows, the false recognition rate was so low, in fact,
that we can say that our proposed system is able to select almost without error
a personal facial expression classifier from the viewer’s profile.
Table 5. Experimental results of facial expression recognition
a. Confusion matrix for subject A
Neu Pos Neg Rej Sum Recall (%)
Neu 48275 443 525 622 49865 96.81
Pos 743 6907 1 14 7665 90.11
Neg 356 107 3250 6 3719 87.39
Rej 135 0 5 1326 1466 90.45
Sum 49509 7457 3781 1968 62715
Precision (%) 97.51 92.62 85.96 67.38
b. Confusion matrix for subject B
Neu Pos Neg Rej Sum Recall (%)
Neu 56068 138 264 61 56531 99.18
Pos 231 2076 8 32 2347 88.45
Neg 641 24 2402 38 3105 77.36
Rej 203 0 21 551 775 71.10
Sum 57143 2238 2695 682 62758
Precision (%) 98.12 92.76 89.13 80.79
5.4 Facial Expression Recognition Using SVM
For every frame in the experimental videos, facial expression was recognized
by Support Vector Machines. Three of four experimental videos were used for
training data, and the rest for testing data. The cross-validation method was
used to create the confusion matrices shown in Table 5.
The averaged recall rate was 87.61% and the averaged precision rate was
88.03%. When the subjects modestly expressed their emotion, even though the
subjects tagged their feeling as Positive or Negative, the system often mistook the
facial expression for Neutral. Moreover, when the subjects had an intermediate
facial expression, the system often made a mistake because one expression class
was only assumed in a frame.
6 Conclusion
In this paper, we proposed the system that tagged video contents with Positive,
Negative, and Neutral interest labels based on viewer’s facial expression. In ad-
dition, a ”Rejective” frame was automatically tagged by learned SVM classifiers.
As an experimental result of the facial expression recognition for two subjects,
the averaged recall rate and precision rate were about 88%. This makes ourTagging Video Contents with Positive/Negative Interest 219 proposed system able to find those intervals of a video in which the viewer inter- ested, and it also enables the system to recommend video content to the viewer. Evaluation of the video contents of various categories and evaluation of various subjects will be the theme of future work. Moreover, we plan to construct a system that can automatically recommend video content for viewers based on a combination of facial expression, speech and other multimodal information. References 1. Smeaton, A.F., Over, P., Kraaij, W.: Evaluation campaigns and TRECVid. In: MIR 2006. Proceedings of the 8th ACM International Workshop on Multimedia Information Retrieval, Santa Barbara, California, USA, October 26 - 27, 2006, pp. 321–330. ACM Press, New York (2006) 2. Masumitsu, K., Echigo, T.: Personalized Video Summarization Using Importance Score. J.of IEICE J84-D-II(8), 1848–1855 (2001) 3. Taka, T., Watanabe, T., Taruguchi, H.: A TV Program Selection Support Agent with History Database. IPSJ Journal 42(12), 3130–3143 (2001) 4. Yamamoto, M., Nitta, N., Babaguchi, N.: Estimating Intervals of Interest During TV Viewing for Automatic Personal Preference Acquisition. In: PCM2006. Proceedings of The 7th IEEE Pacific-Rim Conference on Multimedia, pp. 615–623 (November 2006) 5. Wiskott, L., Fellous, J.-M., Kruger, N., von der Malsburg, C.: Face Recognition by Elastic Bunch Graph Matching. IEEE Transactions on Pattern Analysis and Machine Intelligence 19(7), 775–779 (1997) 6. Bolme, D.S.: Elastic Bunch Graph Matchin. In: partial fulfillment of the require- ments for the Degree of Master of Science Colorado State University Fort Collins, Colorado (Summer 2003) 7. Viola, P., Jones, M.: Rapid Object Detection using a Boosted Cascade of Simple Features. In: Proc. IEEE Conf. on Computer Vision and Pattern Recognition Kauai, USA, pp. 1–9 (2001) 8. Vapnik, V.N.: The Nature of Statistical Learning Theory. Springer, Heidelberg (1995) 9. Lyons, M.J., Akamatsu, S., Kamachi, M., Gyoba, J.: Coding Facial Expressions with Gabor Wavelets. In: Proceedings, Third IEEE International Conference on Automatic Face and Gesture Recognition, April 14-16, 1998, pp. 200–205. IEEE Computer Society, Nara Japan (1998)
You can also read