Tectonically and climatically driven mountain-hopping erosion in central Guatemala from detrital
←
→
Page content transcription
If your browser does not render page correctly, please read the page content below
Earth Surf. Dynam., 9, 795–822, 2021
https://doi.org/10.5194/esurf-9-795-2021
© Author(s) 2021. This work is distributed under
the Creative Commons Attribution 4.0 License.

         Tectonically and climatically driven mountain-hopping
              erosion in central Guatemala from detrital
                     10
                        Be and river profile analysis
        Gilles Brocard1 , Jane Kathrin Willenbring2 , Tristan Salles3 , Michael Cosca4 , Axel Guttiérez-Orrego5 ,
                           Noé Cacao Chiquín5 , Sergio Morán-Ical5 , and Christian Teyssier6
             1 Archéorient, Maison de l’Orient et de la Méditerranée, University of Lyon 2, 69365 Lyon, France
                   2 Department   of Geological Sciences, Stanford University, Stanford, CA 94305, USA
                           3 School of Geosciences, University of Sydney, Camperdown, Australia
                         4 US Geological Survey, Denver Federal Center, Denver, CO 80225, USA
                                5 Carrera de Geología, Universitad San Carlos de Guatemala,

                                  Centro Universitario del Noreste, 16001 Cobán, Guatemala
                 6 Department of Earth Sciences, University of Minnesota, Minneapolis, MN 55455, USA

                                  Correspondence: Gilles Brocard (gilles.brocard@mom.fr)

                                   Received: 4 October 2020 – Discussion started: 9 November 2020
                              Revised: 20 March 2021 – Accepted: 22 June 2021 – Published: 29 July 2021

      Abstract. The rise of a mountain range affects moisture circulation in the atmosphere and water runoff across
      the land surface, modifying the distribution of precipitation and drainage patterns in its vicinity. Water routing
      in turn affects erosion on hillslopes and incision in river channels on surrounding mountain ranges. In central
      Guatemala, two parallel, closely spaced mountain ranges formed during two consecutive pulses of uplift, the
      first between 12 and 7 Ma (Sierra de Chuacús–Sierra de las Minas), and the second after 7 Ma (Altos de Cuchu-
      matanes). We explore the climatic and tectonic processes through which the rise of the most recent range drove
      the slowing of river incision and hillslope erosion over the previously uplifted range. The 40 Ar/39 Ar dating of
      perched volcanic deposits documents the sequential rise and incision of these mountain ranges. Terrestrial cos-
      mogenic 10 Be in river sediments indicates that currently hillslopes in the older range erode more slowly than
      in the younger range (20–150 vs. 300 m Myr−1 ). These differences mimic the current distribution of precipi-
      tation, with the younger range intercepting the atmospheric moisture before it reaches the older range. River
      channel steepness and deformation of paleovalleys in the new range further indicate that the younger range has
      been rising faster than the older range up to today. We review how atmospheric moisture interception and river
      long-profile adjustment to the rise of the new range have contributed to the decline of erosion rates over the old
      range. We also explore the consequences of this decline and of aridification on the topographic evolution of the
      older range. The older range undergoes a slow topographic decay, dominated by backwearing, by the stacking of
      slowly migrating erosion waves along the mountain flanks, and by the formation of pediments around its base.
      The morphology of the old range is therefore transitioning from that of a front range to that of a dry interior
      range.

Published by Copernicus Publications on behalf of the European Geosciences Union.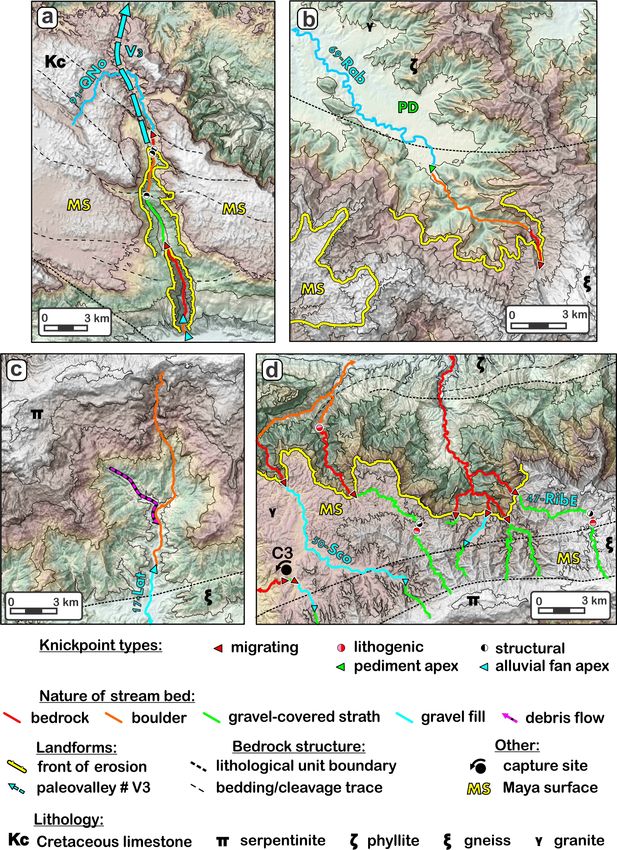
796                  G. Brocard et al.: Tectonically and climatically driven mountain-hopping erosion in central Guatemala

1   Introduction                                                   2003; Garcia-Castellanos, 2007). These different evolution-
                                                                   ary pathways have been explored at the scale of entire oro-
A mountain range affects both the circulation of atmospheric       gens. They are, however, seldom documented at the scale
moisture around its relief and the flow of precipitated water      of individual mountain ranges because their manifestation
over the land surface on its slope and in the vicinity. Moisture   at that scale is harder to separate from more local signals
rises and precipitates on its windward side, while rain shad-      driven by spatial variations in bedrock erodibility, stochastic
ows tend to be cast over its lee-side and over the land sur-       processes (e.g., landslides), and topographic inheritance.
face located downwind (e.g., Meijers et al., 2018; Galewsky,          We document here how the rise of a recent mountain range
2009). Once precipitated, the fraction of water that runs off      (the 170 km long Altos de Cuchumatanes, AC, range) af-
as overland flow drives hillslope erosion and river incision.      fected the topographic evolution of a nearby, older range (the
River drainages are dynamic systems that can transmit forc-        220 km long Sierra de Chuacús–Sierra de las Minas, SC-SM,
ing along drainage lines in both the downstream and up-            range) in Guatemala (Fig. 1). Sharp topographic, climatic,
stream directions. Changes in climate and vegetation mod-          and tectonic gradients in this region exert themselves over a
ulate hillslope erosion, and these changes are then transmit-      relatively small (350 × 100 km) area, allowing a detailed in-
ted to rivers from the headwaters downstream. Conversely,          vestigation of the interactions between the two ranges. The
changes affecting downstream river reaches, such as the ad-        SC-SM range started to rise first in early late Miocene time,
justment of river gradient to the rise of mountain ranges          when its flanks were deeply eroded (Brocard et al., 2011).
or to variations in sea level, can be transmitted upstream         The AC range, on the other hand, started to grow in the latest
along river channels (Humphrey and Heller, 1995; Whittaker         Miocene, next to the SC-SM range. The rise of the AC range
and Boulton, 2012). From there, they are transmitted up-           sparked widespread drainage rearrangement in front of the
hill along valley slopes (Harvey, 2002; Mudd and Furbish,          SC-SM range during the late Miocene (Brocard et al., 2011).
2007). Mountain ranges affect the erosion of surrounding re-       Numerous captures occurred during this event. Interestingly,
liefs through this combination of top-down and bottom-up           these captures did not generate upstream-migrating waves of
processes.                                                         accelerated erosion. On the contrary: river incision stalled
   The growth of contractional orogens commonly involves           upstream of the capture sites (Brocard et al., 2011). We seek
the outward, sequential propagation of contraction, and the        to identify the processes that arrested river incision and re-
formation of successive, in-sequence mountain ranges. Mois-        trieve, from the characteristics of river long-profiles, insights
ture, by contrast, is commonly advected in the opposite direc-     into how arrested incision influenced the topographic evolu-
tion, from the forelands to the orogen interiors. Precipitated     tion of the SC range.
water is then commonly returned to the foreland by river net-         New 40 Ar/39 Ar ages on volcanic rocks are used first to
works that flow from the orogen interiors to the forelands.        tighten the chronology of river incision and surface uplift of
The rise of front ranges therefore commonly takes place            the SC-SM range. Detrital terrestrial 10 Be erosion rates then
both upwind and downstream of preexisting ranges, driv-            provide a snapshot of current spatial variations in hillslope
ing the aridification of previously uplifted ranges (Garcia-       erosion rates in the SC-SM and AC ranges. Profile lineariza-
Castellanos, 2007). The new front ranges will also affect the      tion is implemented to study the complex long-profiles of the
rivers that drain the previously uplifted ranges toward the        rivers that drain these ranges. River knickpoints are extracted
forelands. These rivers will adjust to enhanced rock uplift        and then classified in order to identify river knickpoints that
by enhanced incision through the steepening of their gradi-        transmit the long-term landscape response of the drainage to
ent in areas of enhanced uplift (Leland et al., 1998). This        the sequential uplift of the two ranges. We then discuss the
steepening is accompanied by a transient decrease in incision      respective contribution of topographically controlled climate
rate upstream of the rising ranges (Champel et al., 2002). In      and of tectonically controlled river profile adjustment to the
some cases, the topography and underlying tectonic structure       decline of incision over the SC range during the rise of the
will respond fast enough to reach a new dynamic equilibrium        AC range. We finally review topographic characteristics of
between relief, climate, and tectonics (Willett and Brandon,       the SC range directly related to the slowing down of erosion
2002; Whipple and Meade, 2006) without any substantial al-         over the SC range.
teration of the drainage network. In other cases, however,
the range-transverse river networks will experience reorga-
                                                                   2     Origin and evolution of the mountain ranges of
nization before the equilibrium is reached (Jackson et al.,
                                                                         central Guatemala
2002; van der Beek et al., 2002; Brocard et al., 2012). In
a few cases, the slowing down of landscape response time,          2.1    Tectonics and orogenesis
as a result of aridification, upstream and downwind of the
rising ranges will even lead to the disintegration of river        Left-lateral motion along the North American–Caribbean
drainages and to the topographic decay of interior ranges.         plate boundary in central Guatemala has produced elongate
This evolution characterizes the nucleation and growth of          ranges parallel to the plate boundary (Fig. 1a). We investi-
orogenic plateaus formed by lateral accretion (Sobel et al.,       gate the growth and erosion of two of these ranges, namely

Earth Surf. Dynam., 9, 795–822, 2021                                                  https://doi.org/10.5194/esurf-9-795-2021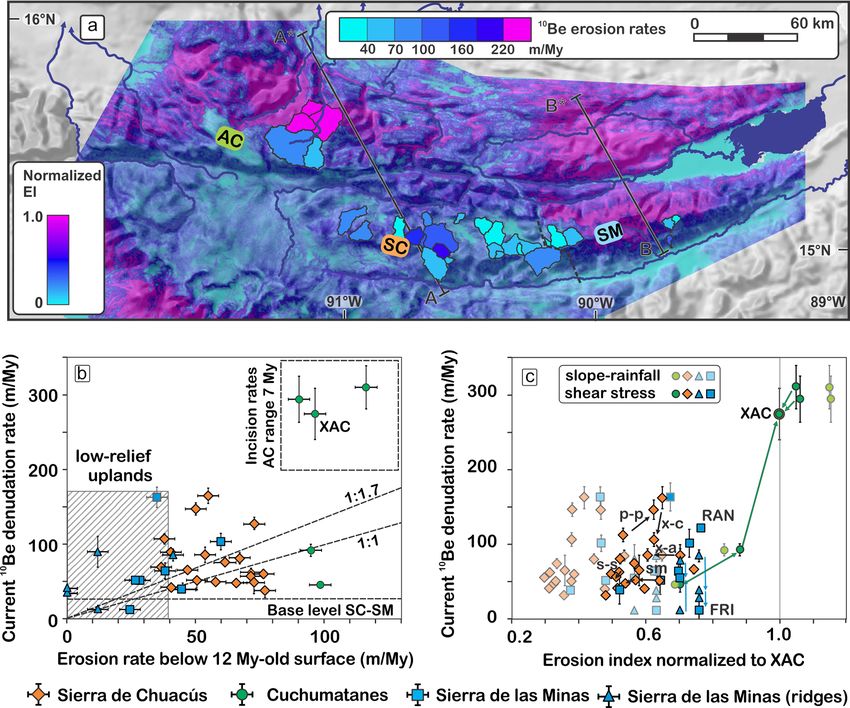
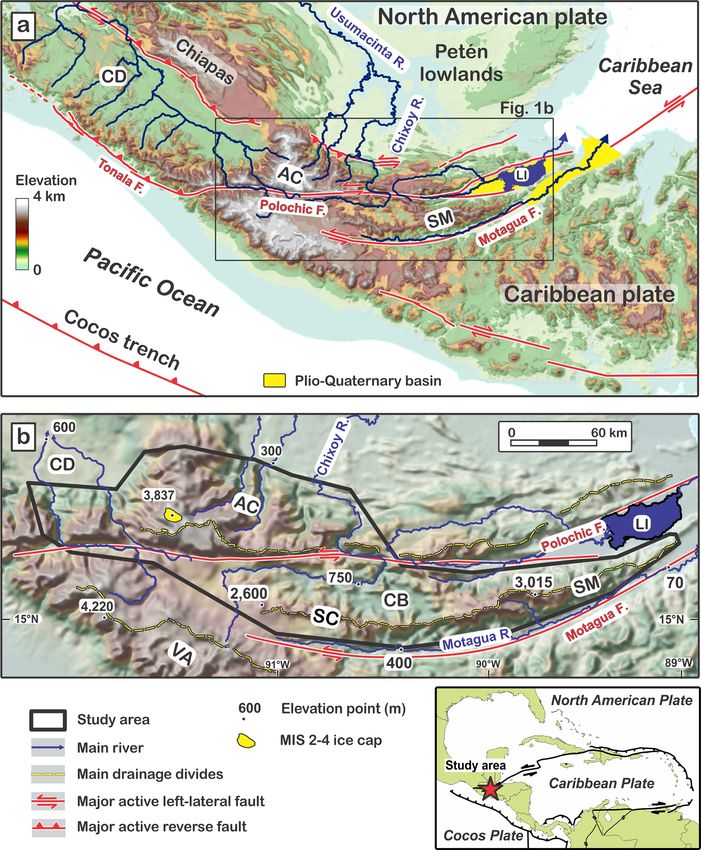
G. Brocard et al.: Tectonically and climatically driven mountain-hopping erosion in central Guatemala                                 797

Figure 1. Shaded topography of the study area, showing the tectonic setting of central Guatemala (a) and of the studied range (b). Topo-
graphic features are defined as follows: CB stands for Chixóy River basin, CD stands for Central Depression of Chiapas, AC stands for Altos
de Cuchumatanes (AC range), LI stands for Lake Izabal, SC stands for Sierra de Chuacús (SC range), SM stands for Sierra de las Minas (SM
range), and VA stands for Central American Volcanic Arc. MIS represents the δ 18 O marine isotopic stage.

the Sierra de Chuacús–Sierra de las Minas range (SM-SC                  fault offshore, somewhere in the Caribbean Sea (Fig. 1a), be-
range), and the Altos de Cuchumatanes range (AC range,                  fore running on land at an average distance of 50 km from the
Fig. 1b). Rocks in the SC-SM range possess a deeply penetra-            Motagua fault. Strain across the plate boundary is strongly
tive, sub-vertical tectonic fabric, imparted by 70 Myr of left-         partitioned between almost pure left-lateral slip on the Mo-
lateral wrenching along the Caribbean–North American plate              tagua and Polochic faults and dip-slip on faults parallel to
boundary (Ratschbacher et al., 2009; Ortega-Gutierrez et al.,           the Polochic and Motagua faults (Authemayou et al., 2011;
2004; Ortega-Obregón et al., 2008). Since Eocene time, left-            Brocard et al., 2012).
lateral motion has been accommodated by the Motagua fault                  Today, central Guatemala is straddled by 3–4 km high
and, to a lesser extent, by the Polochic fault (Fig. 2b). The           ranges separated by deep valleys. The floors of these valleys
Motagua fault is, with > 1100 km of total cumulative offset,            stand at elevations as low as 0.2–0.8 km (Fig. 1b). In mid-
the active subaerial fault with the largest cumulative offset           dle Miocene times, the topography of central Guatemala was
on Earth. The Polochic fault has a total offset of 125 ± 5 km           much more subdued. Remnants of that past topography (re-
(Burkart, 1978); it probably branches out of the Motagua                ferred to as the Maya surface; Brocard et al., 2011) still cap

https://doi.org/10.5194/esurf-9-795-2021                                                      Earth Surf. Dynam., 9, 795–822, 2021
798                   G. Brocard et al.: Tectonically and climatically driven mountain-hopping erosion in central Guatemala

Figure 2. Age of geomorphic markers and drainage lines in central Guatemala. Ages of Miocene valleys and Quaternary paleovalleys (V1–
V12) in Myr. Data source are as follows: 1: Brocard et al. (2011); 2: Brocard et al. (2012); 3: Tobisch (1986); 4: Plio-Quaternary lacustrine
deposits (Brocard et al., 2015a). Newly dated lavas are defined as follows: CJY: Chujuyúb; EJ: El Jute. Range names are defined as follows:
AC: Altos de Cuchumatanes; SC: Sierra de Chuacús; SM: Sierra de las Minas; VA: volcanic arc. Faults are defined as follows: MF: Motagua;
PF: Polochic. The background used is taken from the shaded GTOPO 30 DEM.

Figure 3. Incision below the middle Miocene Maya surface, based on the elevation of surface remnants (upland relict surface). Incision
contour line spacing is 1 km. Dashed yellow lines show range drainage divides. AC stands for Altos de Cuchumatanes, SC stands for Sierra
de Chuacús, SM stands for Sierra de las Minas, and VA stands for volcanic arc.

numerous mountaintops across the study area (Fig. 2). They               of the AC range drove widespread reorganization among
are separated by regions where the Maya surface has been                 the rivers that drain the northern flank of the SC-SM range
deeply incised (Fig. 3). The Maya surface formed from the                (Fig. 2). Numerous river valleys were then abandoned and
topographic decay of Eocene folds (Authemayou et al., 2011;              left stranded on the rising AC range. Their deformation indi-
Brocard et al., 2011). It grades to the east and north into low-         cates that the AC range has risen > 1–2 km relative to the SC
lands, near the Caribbean Sea, indicating that it formed near            range over the past 7 Myr (Brocard et al., 2011). Earthquake
sea level. Its uplift started after the middle Miocene, affecting        focal mechanisms further indicate that the tectonic structures
both the southern (Simon-Labric et al., 2013) and northern               bordering the AC range to the north still accommodate short-
side of the Motagua fault, as far north as the Polochic fault            ening today (Guzmán-Speziale, 2010; Authemayou et al.,
(Brocard et al., 2011). This event saw the rise of the SC-SM             2011).
range during the late Miocene. Valleys up to 1000 m deep                    While contraction has defined the evolution of the western
were incised within the northern flank of the SC-SM range                part of the study area, transtension has prevailed further east
between 12 and 7 Ma (Brocard et al., 2011).                              since the late Miocene at least. The dominance of transten-
   Uplift propagated north of the Polochic fault during the              sion in the east results chiefly from an eastward increase in
late Miocene (Brocard et al., 2011) and was marked by the                the divergence angle between the strike of the plate bound-
rise of the AC range in response to contraction within the               ary and the direction of plate motion (Rogers and Mann,
North American plate (Authemayou et al., 2011). The rise                 2007). Transtension led to growth of the Lake Izabal basin

Earth Surf. Dynam., 9, 795–822, 2021                                                         https://doi.org/10.5194/esurf-9-795-2021
G. Brocard et al.: Tectonically and climatically driven mountain-hopping erosion in central Guatemala 799
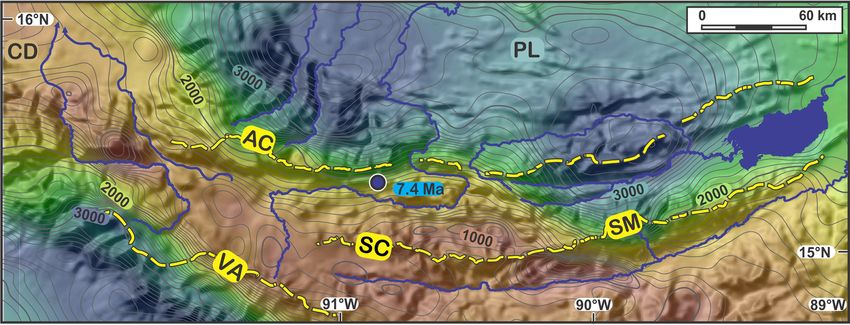
Figure 4. Mean annual precipitation across the study (MARN, 2016) from dry (red) to wet (blue). Isohyet spacing is 100 mm, draped over
the shadowed GTOPO 30 DEM. Dashed yellow lines show the range drainage divides. The blue dot shows the location of the fossil forest
of Sicaché, buried below a 7.4 Myr ignimbrite (Brocard et al., 2011). CD stands for Central Depression of Chiapas, AC stands for Altos de
Cuchumatanes, PL stands for Petén lowlands, SC stands for Sierra de Chuacús, SM stands for Sierra de las Minas, and VA stands for volcanic
arc.
(Fig. 1a), which is has been filled with ∼ 5 km of terrigenous because their dynamics is strongly influenced by the high-
sediments since the middle Miocene (Carballo-Hernandez frequency opening and closure of subterranean karstic path-
et al., 1988; Bartole et al., 2019). Another ≥ 1.4 km deep, ways (Brocard et al., 2015a, 2016a).
elongate (125 × 15 km) sedimentary basin formed over the
same period at the eastern termination of the subaerial trace 2.3 Current pattern of precipitation
of the Motagua fault, next to the Caribbean Sea (Carballo-
Hernandez et al., 1988) (Fig. 1a). Transtension spread fur- Moisture tracking from the Pacific Ocean and from the
ther to the west during the Pliocene, generating normal faults Caribbean Sea is intercepted by slopes that face the west-
that disrupt the northern flank of the SM range (Authemayou ern and eastern coasts of Guatemala and the Petén lowlands
et al., 2011; Brocard et al., 2012). in the north (Fig. 4). The AC range receives 4–6 m yr−1 of
mean annual precipitation (MAP) along its northern flank in
2.2 Drainage evolution since the middle Miocene the Zona Reina (Thattai et al., 2003). In the west, the Cen-
tral American Volcanic Arc intercepts moisture rising from
The rivers located along the northern flank of the SC range the Pacific Ocean. In the east, moisture from the Caribbean
represent the headwaters of a network that, farther down- Sea is channeled along the Lake Izabal basin and then rises
stream, experienced widespread reorganization during the up along the northern flank of the SM range, where fog in-
late Miocene (Fig. 2). Reorganization led to the formation terception represents a substantial part of the annual precip-
of range-parallel rivers halfway between the drainage divides itation above 2000 m (Holder, 2004). The volcanic arc, the
of the SC-SM and the AC ranges. These E–W-striking rivers SM range, and the AC range cast rain shadows over the Cor-
collect rivers that flow north, down the northern flank of the ridor Seco (Machorro, 2014), particularly over the SC range,
SC-SM range, and funnel them into the Chixóy River, one of which receives little precipitation. Semi-arid climate condi-
the few rivers, together with the Cahabón, Chixóy, Selegua, tions are met in the valleys that surround the SC range.
and Cuilco rivers (Fig. 2), that still cross the AC range. These
latter rivers also straddle the trace of left-lateral Polochic
2.4 Bedrock lithology
fault before entering the AC range. The Polochic fault has
deflected and lengthened their course (Fig. 2) since the late Rock belts in central Guatemala tend to follow the strike of
Miocene (Brocard et al., 2011). Plio-Quaternary transten- the mountain ranges (Fig. 5). Late Cretaceous schists and
sional faulting along the northern flank of the SM range initi- gneisses of the Chuacús Formation (henceforth, formation
ated a second (and still ongoing) pulse of drainage reorgani- will be abbreviated to Fm.). form the core of the SC-SM
zation during the Quaternary (Fig. 2) (Brocard et al., 2012). range. They are flanked by the late Cretaceous migmatites of
Since the Pliocene, large volcanoclastic aprons have piled the San Agustin Fm., and by marbles and amphibolites of the
up along the NE side of the Central American Volcanic arc. Jones Fm. In the north, this metamorphic core is tectonically
They have buried the western end of the SC range, derang- juxtaposed, across the Baja Verapaz shear zone, to the base-
ing its river network (Fig. 2). This complex area is therefore ment of North America, which is covered mostly by a Per-
excluded from the present study. Likewise, the karstic high- mian megasequence of terrigenous sediments and carbonates
lands of central Guatemala, especially those located north (Sacapulas, Tactic-Esperanza, and Chochal Fms.; Anderson
of the Polochic fault, are also excluded from the analysis et al., 1973). The basement and cover are intruded by Pale-
https://doi.org/10.5194/esurf-9-795-2021 Earth Surf. Dynam., 9, 795–822, 2021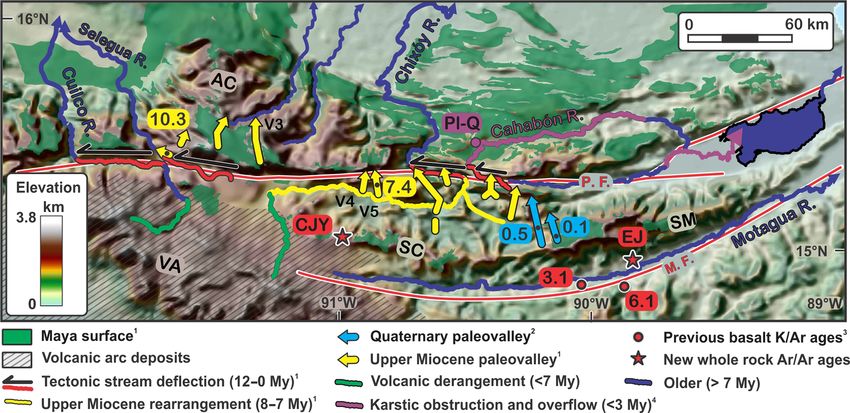
800                  G. Brocard et al.: Tectonically and climatically driven mountain-hopping erosion in central Guatemala

ozoic (e.g., Rabinal), Triassic, and Jurassic (e.g., Matanzas)    ble S2-1, Fig. S2-3c in the Supplement). Three samples con-
plutons.                                                          sist of quartzose vein fragments exhumed from weathered
   A megasequence of continental terrigenous sediments (the       orthogneiss, and two other samples come from outcrops of
Todos Santos Fm.), Cretaceous carbonates, and Cretaceous          highly weathered pegmatite located on the monadnock of
evaporites (Cobán Fm., Campur Fm.) covers much of the AC          Cerro las Palomas, in the Montaña El Imposible (Fig. S2-3b).
range (Fig. 5). Ultramafic rocks obducted over the carbon-           The majority of the samples consist of river-borne quartz
ates in late Cretaceous (Campanian) time (Fourcade et al.,        collected in 30 rivers that drain the SM, SC, and AC ranges
1994) are preserved within weakly metamorphic synformal           (Fig. 6, Table S2-2, Fig. S2-3 in the Supplement). They
klippes (Baja Verapaz, Santa Cruz, and Juan de Paz ophio-         provide catchment-averaged hillslope erosion rates (Brown
lites). Higher-grade serpentine mélanges crop out along the       et al., 1995). Quartz was extracted from the sand grain-size
Motagua valley (Flores et al., 2013).                             fraction (250–500 µm) of the river sediments. Because 10 Be
   The southern base of the SC-SM range is incised into sed-      production increases rapidly with elevation, systematic alti-
iments deposited in narrow transtensional basins along the        tudinal variations in the concentration of quartz in the source
Motagua fault (Ratschbacher et al., 2009). During Eocene          rocks may skew the calculation of erosion rates. A sensitiv-
times (Newcomb, 1975), one such basin was filled by con-          ity analysis to this effect was conducted in the AC range,
tinental red beds of the Subinal Fm. (Fig. 5), which has an       where this situation in encountered, by weighting 10 Be pro-
exposed thickness of ≥ 1500 m (Hirschman, 1962). Some of          duction according to the quartz concentration in the source
its detrital sediments are derived from the current basement      rocks (Fig. S2-3a). Besides, the intense weathering of trop-
of the SC-SM range, while others were brought by an axial         ical mountains promotes the concentration of quartz in the
river that prefigures the current Motagua River (Guttiérrez,      soils and the underestimation of erosion rates. An assessment
2008). The Subinal Fm. now lies in tectonic contact against       of the effect of quartz enrichment on erosion rates was there-
the SC-SM basement along high-angle reverse faults (Muller,       fore conducted (Table S2-2) using quartz enrichment values
1979; Bosc, 1971).                                                from mountain tropical soils of Puerto Rico (Ferrier et al.,
                                                                  2010). River sampling was conducted in nested catchments
                                                                  (Figs. 6 and S2-3a, b) in order to capture along-stream vari-
3     Methods
                                                                  ations in erosion rates, such as those produced by headward-
3.1    The 40 Ar-39 Ar isotopic dating of volcanic rocks
                                                                  migrating knickpoints (Willenbring et al., 2013b; Brocard
                                                                  et al., 2015b). Samples were prepared at the 10 Be extraction
The age of the low-relief Maya surface was previously con-        laboratory of the Department of Geology and Geophysics at
strained by bracketing age markers, such as 14–15 Ma over-        the University of Minnesota and at the PennCIL lab of the
lying ignimbrites on the Chortís Block, and a 10 Ma ign-          Earth and Environmental Sciences department at the Univer-
imbrite filling a paleovalley, incised into the Maya surface      sity of Pennsylvania (see Supplement 2).
(Brocard et al., 2011). To improve the dating of the Maya
surface we resorted to the 40 Ar/39 Ar dating of andesite boul-
                                                                  3.3   Calculation of an erosion index
ders, embedded in a lahar deposit that lies on the Maya sur-
face at the western termination of the SC range, near the lo-     To test the influence of hillslope steepness and of precipita-
cality of Chujuyúb (Fig. 2). To establish the chronology of       tion on 10 Be-derived erosion rates, we calculated a normal-
incision of the Motagua valley, we used previously dated al-      ized erosion index (Montgomery and Stolar, 2006; Finnegan
kaline basalts that crop out on the floor of the Motagua valley   et al., 2008) over the study area. We used a formulation in
(Tobisch, 1986). We also dated a basalt flow that hangs 500 m     which soil erosion is assumed to be proportional to shear
above the Motagua River in the foothills of the Sierra de las     stress:
Minas near the town of El Jute (Bosc, 1971) (Fig. 6). Two
40 Ar/39 Ar whole-rock ages were retrieved from the basalt of
                                                                  EI = Q1/3 · S 2/3 ,                                        (1)
El Jute, and one whole-rock age was obtained on the basaltic
andesite of Chujuyúb by the U.S. Geological Survey (USGS)         where Q is discharge (in m3 s−1 ) and S the along-slope
in Denver, CO, USA (see Supplement 1).                            gradient (m m−1 ). Slope was extracted from the national
                                                                  Guatemalan Instituto Geográfico Nacional (IGN) digital ele-
3.2    Terrestrial 10 Be erosion rates
                                                                  vation model (DEM) at a resolution of 20 m, and discharge
                                                                  was calculated using MAP provided in the MARN (2016)
We measured the concentration of 10 Be in quartz grains ex-       report. Rainfall values were corrected for evapotranspiration,
tracted from soils and river sediments. We used the 10 Be         using a map of vegetation from the MARN (2016) report, and
concentration to calculate hillslope erosion rates, integrated    evapotranspiration values were taken from the Puerto Rico
over the past 103 –104 years (see Supplement 2). Soil and         GAP project (Gould et al., 2008). It amounts to 10 %–82 %
rock samples, collected along ridgelines in the SM range,         of the total rainfall for the different types of vegetation re-
provide erosion rates restricted to the sites of sampling (Ta-    ported in the MARN report. Erosion Index (EI) values were

Earth Surf. Dynam., 9, 795–822, 2021                                                    https://doi.org/10.5194/esurf-9-795-2021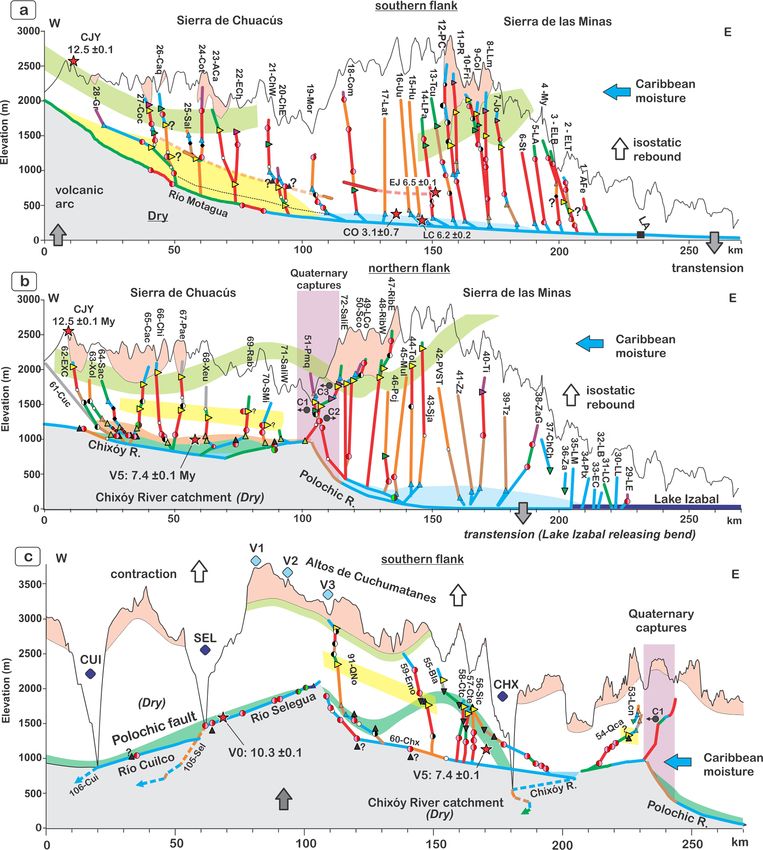
G. Brocard et al.: Tectonically and climatically driven mountain-hopping erosion in central Guatemala 801
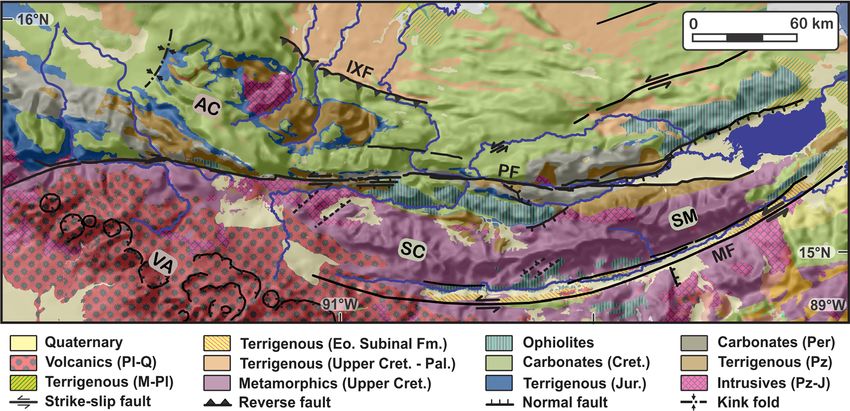
Figure 5. Geology and structure of central Guatemala (Instituto Geográfico Nacional de Guatemala; Instituto Hondureño de Geología y
Minas; Instituto Nacional de estadística y geografía de México), draped over the GTOPO 30 DEM. AC stands for Altos de Cuchumatanes,
IXF stands for Ixcán fault, MF stands for Motagua fault, PF stands for Polochic fault, SC stands for Sierra de Chuacús, SM stands for Sierra
de las Minas, and VA stands for volcanic arc.
Figure 6. Catchments sampled for the 10 Be analysis (AC: Altos de Cuchumatanes; SC: Sierra de Chuacús; SM: Sierra de las Minas) and
40 Ar/39 Ar dating (CJY: Chujuyúb; EJ: El Jute). Enlarged maps of the catchments and their lithologies are provided in Fig. S2-1 in the
Supplement). The arcuate line represents the axis used for plate-boundary-parallel projections of Figs. 10 and 12.
normalized to the highest obtained EI value within the study points along river profiles. We chose the integral method
area. (Perron and Royden, 2013), in which elevation is plotted (on
chi plots or χ plots) as a function of chi (or χ), which is an
3.4 River profile segmentation upstream integral of incremental upstream distance divided
by a normalized local drainage area:
We extracted the long-profiles of 220 rivers located in the
AC, SC, and SM ranges, using the Guatemala national 20 m Zx m
Ao n
resolution DEM released by the National Geographic Insti- χ= dx 0 , (2)
A(x 0 )
tute of Guatemala. The beds of these rivers were observed xo
on stereoscopic couples of aerial photographs, provided by
the National Geographic Institute of Guatemala (see the next where A and x are the drainage area (in m2 ) and upstream
section for details). We sieved out rivers along which long- distance (in m), respectively. Ao (in m2 ) is a reference
term dynamics are mired by adjustments to shorter-term dis- drainage area, xo is a reference upstream distance taken at
turbances, such as interactions with karst conduits, debris the same point, and m and n are two exponents that encap-
flows, and deep-seated landslides. A subset of 110 rivers that sulate the influence of drainage area and of local slope on
best capture long-term trends was used in the final analysis river incision rate, respectively. This method divides river
(Fig. 7). profiles into a succession of linear to sublinear segments, sep-
We resorted to a linearization method that filters out the arated by break-in slopes that represent the knickpoints. The
downstream increase in stream discharge to identify knick- method overcomes much of the scatter that plagues earlier
https://doi.org/10.5194/esurf-9-795-2021 Earth Surf. Dynam., 9, 795–822, 2021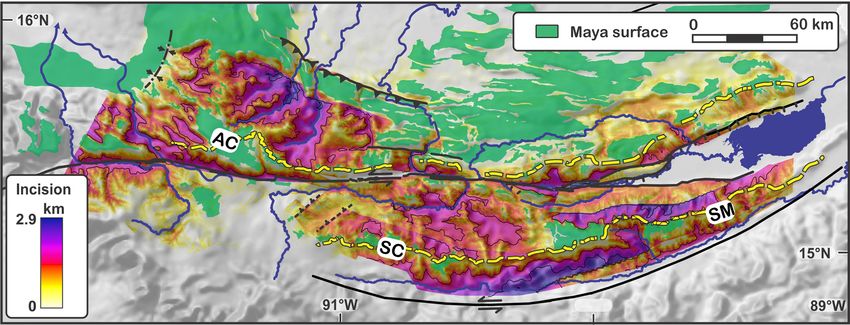
802                   G. Brocard et al.: Tectonically and climatically driven mountain-hopping erosion in central Guatemala

Figure 7. Distribution and grouping of the streams used in the river long-profile analysis, and their grouping by geographic areas. AC stands
for Altos de Cuchumatanes, LI stands for Lake Izabal, PF stands for Polochic fault, SC stands for Sierra de Chuacús, and SM stands for Sierra
de las Minas. Numbers (1–106) correspond to the numbers ascribed to the rivers, as listed in table S4-1. The corresponding river profiles are
presented in Figs. S4-2 to S4-7 in the Supplement and in Fig. 12. Boxes A–D show footprints of the maps displayed on Fig. 8.

linearization methods (Whipple and Tucker, 2002; Goldrick                masked by overhanging riparian vegetation. The classifica-
and Bishop, 1995). It requires, however, a foreknowledge of              tion roughly reflects differences in the factors that determine
the intrinsic concavity θ, defined as m/n. The value of θ                stream incision. River incision is indeed likely detachment-
can be determined by incrementally fitting river profiles to             limited along bed-load-dominated reaches, and transport-
a straight line (Mudd et al., 2014). Most of the studied rivers,         limited along gravel- and cobble-dominated reaches, ly-
however, have highly segmented profiles (see Sect. 4.3), pre-            ing over bedrock straths (Tucker and Whipple, 2002; Bro-
venting the retrieval of well-defined θ values. Besides, θ               card and Van der Beek, 2006). Boulder-armored reaches
might vary along-stream as a result of changes in climate                are chocked by slowly- to non-moving boulders that act
(Murphy et al., 2016) or changes in the dominant erosive                 more like bedrock than bed load and are therefore likely
processes operating on the streambed (Brocard and Van der                detachment-limited. However, unlike other types of bedrock
Beek, 2006), such as the alternation of detachment-limited               channels, boulder channels do not reflect the erodibility of
(Howard, 1994) and transport-limited river incision (Whip-               the underlying bedrock but rather that of surrounding hill-
ple and Tucker, 2002) or the alternation of sediment-starved             slopes because the majority of the boulders originate from
and overfed reaches (Sklar and Dietrich, 2006). The method               valley sides. Changes in streambed type from one segment to
is chiefly used here to locate knickpoints. We therefore sim-            the next assisted the classification of river knickpoints (see
ply assessed whether the choice of θ would impact the lo-                following section).
cation and number of break in slopes when varied within
the range (0.4–0.6) over which the profiles appear well lin-
earized. The segmentation being stable over this range (Sup-             3.6   Classification of river knickpoints
plement 3), a common normalizing concavity θn of 0.5 was
applied to all river profiles.                                           Convex-up breaks in slopes along river profiles are com-
                                                                         monly referred to as river knickpoints. For convenience, we
                                                                         refer here to all breaks in slope, whether convex or concave,
3.5   Classification of stream segments                                  as knickpoints. Knickpoints were classified as lithogenic, al-
                                                                         luvial, tectonic, migrating, and miscellaneous (see Supple-
Streambed morphology was examined along each linearized                  ment 4). Miscellaneous knickpoints represent adaptations of
segment using stereoscopic 0.5 m resolution black and white              river profiles to local, stochastic disturbances (such as land-
aerial photographs shot in 2001, provided by the Guatemala               slides and epigenies) and are usually short-lived. Most knick-
National Institute of Geography (see Supplement 4). Ob-                  points in the study area reflect adaptations of river gradients
servations were occasionally ground-proofed during field                 to along-stream variations in rock uplift rate, bedrock erodi-
work campaigns stretching over 6 years. River beds were                  bility, sediment flux, or sediment grain size. These knick-
grouped into types according to the bed component that                   points can be regarded as steady, inasmuch as their loca-
dominantly determines river gradient along each segment,                 tion only changes very slowly along the river profiles, track-
namely bedrock, bedrock and gravel bars, gravel bars over                ing spatial changes in the distribution of rock types, rock
bedrock strath, gravel bars over thick alluvial fill, colluvium,         uplift, sediment fluxes, and bed load grain size. By con-
large immobile boulders, boulders and gravel bars, and boul-             trast, knickpoints that spearhead step increases or step de-
ders and bedrock (Table S4-1 in the Supplement). Classifi-               creases in river incision rates migrate in the upstream direc-
cation failed in many headwater channels, where beds are                 tion along river profiles in the form of waves of accelerated

Earth Surf. Dynam., 9, 795–822, 2021                                                         https://doi.org/10.5194/esurf-9-795-2021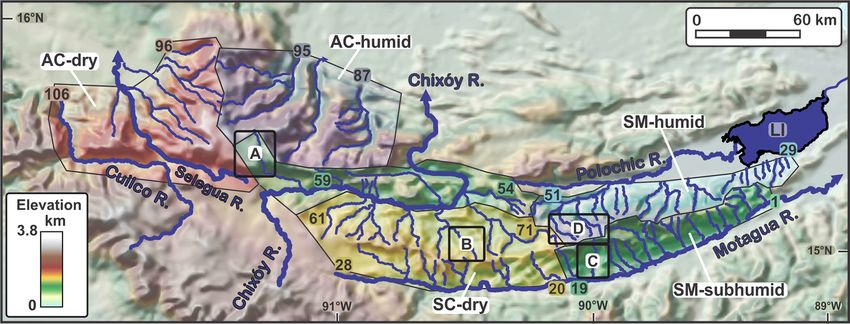
G. Brocard et al.: Tectonically and climatically driven mountain-hopping erosion in central Guatemala                       803

(Rosenbloom and Anderson, 1994; Merritts et al., 1994) or            The method has some limitations: first, local variations in
decelerated (Howard, 1997) incision. They are hereafter re-       bedrock erodibility maybe not be systematically detected, as
ferred to as migrating knickpoints, for they usually migrate      a result of the imprecision of geologic maps, especially in the
faster than the knickpoints previously described. Concave-        least accessible parts of the SM and AC ranges. Second, large
up migrating knickpoints commonly mark the transition from        intra-formational changes in facies can generate variations in
detachment-limited to transport-limited river incision (Whip-     bedrock resistance as sharp as (or even sharper than) erodibil-
ple and Tucker, 2002) and are usually found at the apex of        ity differences between mapped geological units. These two
alluvial fans (Fig. 8c) and pediments (Fig. 8b).                  effects may lead to the interpretation of stable knickpoints
   Theoretical geometric differences between migrating and        as migrating knickpoints. Conversely, some migrating knick-
steady knickpoints in linearized spaces have been used to         points may be pinned to lithological contacts (Crosby and
discriminate unstable, migrating knickpoints from stable,         Whipple, 2006), and filtered out by the analysis. Nonethe-
equilibrium knickpoints (Goldrick and Bishop, 1995; Per-          less, we consider that, given the large number of analyzed
ron and Royden, 2013; Whipple and Tucker, 2002). In χ             knickpoints, the analysis captures the most import aspects of
space, upstream-migrating knickpoints, in which celerity is       the evolution of the landscape within the study area.
controlled by the stream power law and that propagate along
various branches of a single drainage through a homogenous
                                                                  4     Results
substrate affected by homogeneous rock uplift, should all
share the same elevation and the same χ value (Royden and         4.1    Rock uplift and stream incision chronology from
Taylor Perron, 2013). In the real world, however, variations             40 Ar/39 Ar dating
in bedrock erodibility, climate, and rock uplift often scat-
ter these values, challenging interpretations based on these      The Maya surface (Figs. 2 and 3) likely formed close to sea
sole geometric properties. This is especially the case in areas   level because it can be traced to the coast of the Caribbean
where environmental heterogeneities generate steady knick-        Sea (Brocard et al., 2011). It was once covered by exten-
points in which heights and wavelengths are similar to that       sive fluvial deposits, especially south of the Motagua fault,
of the migrating knickpoints interspersed among them.             where the fluvial deposits are preserved below extensive ig-
   Additional discriminating elements must be used. A first       nimbrites (Williams and McBirney, 1969). The lahar deposit
screening consisted of checking whether the knickpoints co-       of Chujuyúb rests directly on a thick saprolite that blankets
incide with marked variations in bedrock erodibility, rock up-    the Maya surface. Lahar emplacement predates the incision
lift rates, or local anomalies, in which case they were classi-   of a 450 m deep valley. The lahar yielded a plateau age of
fied as steady. To assess the effect of lithological variations   12.54±0.04 Ma (Fig. S1-1, Table S1-2 in the Supplement). It
we used 1 : 50 000 and 1 : 250 000 geological quadrangles of      indicates that incision at Chujuyúb started after 12 Ma. This
Guatemala and topical geologic maps from published papers         is consistent with the proposed 12 Ma entrenchment of the
(e.g., Brocard et al., 2011; Bosc, 1971). Stereoscopic 0.5 m      Cuilco River valley into the Maya surface (Fig. 7), 70 km
black and white aerial photographs of the Guatemala Na-           to the NW of Chujuyúb (Brocard et al., 2011), as well as
tional Institute of Geography were used to refine the location    with the 10.3 Ma emplacement of an ignimbrite within the
of lithological contacts and to assess the effects of bedrock     Colotenango valley (Fig. 2), 35 km to the NNW of Chujuyúb
fabric, fault damage zones, active faults, deep-seated land-      (Authemayou et al., 2012), which is shallowly incised into
slides, and large debris flows on the location of knickpoints.    the Maya surface. It is also consistent with the 7.4 Ma de-
We used our foreknowledge of the tectonics of the area (Au-       position of an ignimbrite within a paleovalley, incised 1 km
themayou et al., 2011, 2012; Brocard et al., 2012) and of the     into the Maya surface (Fig. 2), 10–30 km to the NE of Chu-
Quaternary drainage reorganization (Brocard et al., 2012) to      juyúb (Brocard et al., 2011). The depth reached by the late
assist the identification of tectonic knickpoints and of mi-      Miocene valleys prior to their abandonment implies that in-
grating knickpoints related to this recent reorganization. The    cision proceeded at > 140–280 m Myr−1 from 12 to 7 Ma,
remaining knickpoints were then considered as potentially         assuming that the dissection of the Maya surface started at
migrating, carrying the signal of the long-term evolution of      12 Ma (a, Fig. 9). Incision rates averaged over the length of
the studied mountains. We looked for supporting evidence of       the paleovalleys, between the SC and AC ranges, range from
knickpoint migration, in particular break-in slopes running       145 to 205 m Myr−1 (b, Fig. 9). Subsequent incision, from
along valley flanks, tied to specific knickpoints (Fig. 8a and    the base of the late Miocene valley fills, down to modern val-
b) after verifying that such break-in slopes were not produced    ley floors, only amounts to a few tens of meters, at rates of
by lithological variations along valley sides. Changes in ero-    < 30 m Myr−1 (c, Fig. 9).
sion rates along hillslopes associated to the passage of mi-         The chronology of incision along the southern side of the
grating knickpoints can affect saprolite thickness (Brocard       SC range is documented by remnants of basalt flows scat-
et al., 2015b) and associated drainage density. In only a few     tered along the floor of the Motagua valley. These flows track
cases were abandoned river terraces and hanging pediments         from vents located south of the valley on the Caribbean plate
found in the wake of migrating knickpoints.                       (Tobisch, 1986). The outcrop of El Jute represents the dis-

https://doi.org/10.5194/esurf-9-795-2021                                               Earth Surf. Dynam., 9, 795–822, 2021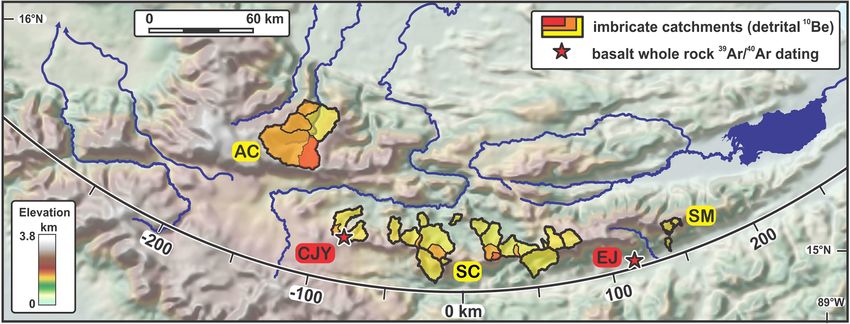
804                   G. Brocard et al.: Tectonically and climatically driven mountain-hopping erosion in central Guatemala

Figure 8. Examples of some knickpoint types presented in their geomorphic setting. Shaded and sloped 30 m resolution ALOS
DEM © JAXA. Location of maps A–D in Fig. 7. (a) Valley of the Quilén Novillo–Chancol rivers (91-QNo, AC Range), showing the pa-
leovalley V3 (Fig. 2), shallowly incised into the Maya surface (Brocard et al., 2011), and two imbricate waves of erosion migrating up the
reversed (southward-directed) drainage of the valley. (b) Typical stepped topography of the SC range in the catchment of the Rabinal river
(69-Rab), showing three imbricate upstream-migrating erosive signals distributed along the mountain slope. The upper one is a wave of
erosion that dissects the Maya surface, a second one is located halfway down the mountain flank, and the basal and final wave is located at
the base of the range at the apex of pediments (PD). (c) Diffusive erosion in serpentinite mélanges, in the catchment of Río Hato (17-Lat, SM
Range). (d) Dissection of the Maya surface by prominent migrating knickpoints along the northern flank of the SM Range, from the Ribaco
River to the Chilasco River (47-Rib to 50Sco). C3 indicates a 200 kyr old avulsion site (Brocard et al., 2012).

Earth Surf. Dynam., 9, 795–822, 2021                                                         https://doi.org/10.5194/esurf-9-795-2021
G. Brocard et al.: Tectonically and climatically driven mountain-hopping erosion in central Guatemala                               805

                                                                           Incision of the Motagua valley, from the elevation of the
                                                                        basalt of El Jute down to the current valley floor, would
                                                                        thus have occurred between 6.1 and 3.1 Ma at > 110 ±
                                                                        40 m Myr−1 (f, Fig. 9). If, after the emplacement of the basalt
                                                                        of El Jute, incision continued at the same ∼ 350 m Myr−1
                                                                        rate as before (g, Fig. 9), then incision would have reached
                                                                        the current valley floor at ∼ 5 Ma, with no incision taking
                                                                        place afterwards (h, Fig. 9). The evolution of incision during
                                                                        the rise of the SC-SM range therefore looks similar on either
                                                                        side of the range: it is dominated by a single step of rapid
                                                                        incision, at 140–350 m Myr−1 , between 12 and 7–5 Ma, fol-
                                                                        lowed by an almost complete cessation of incision along the
Figure 9. Evolution of incision rates in the studied ranges. Let-
                                                                        main trunk streams (the Motagua and Chixóy Rivers), which
ters a–j correspond to river incision rates inferred from 40 Ar/39 Ar
dating (see text). Double-arrowed black lines show the range of cal-    act as base levels of the streams located in the SC range.
culated value for each of incision rate. Rectangles show the range         Large steeply dipping faults bound the Eocene fill of the
of calculated values and time span of each of incision rate. Curves     Motagua valley. Dip-slip on these faults could be responsi-
show the overall evolution of incision rates within each range, in-     ble, in part or in whole, for the deepening of the Motagua
ferred from these discrete estimates. Blue shows Sierra de las Minas    valley, a possibility contemplated by Tobisch (1986). Various
(SM), red shows Sierra de Chuacús (SC), and green shows Altos de        traits of the valley, however, rule out any substantial contri-
Cuchumatanes (AC).                                                      bution of these faults. First, fluvial sediments have bypassed
                                                                        the Motagua valley since Eocene time, feeding a transten-
                                                                        sional basin at the lowest eastern end of the Motagua valley
tal end of a lava flow that abutted the base of the SM range,           (Fig. 1b). Second, the alluvial fans that have grown astride
backfilling the Huijo River valley with ≥ 70 m of basalt. The           these faults show no evidence of faulting, nor any anomaly
base of the flow lies > 400 m above the Huijo River. Using              in their catchment/fan surface ratios (Tobisch, 1986). Third,
the modern gradient of the transport-limited Huijo River as             the faults encountered along the base of the SC-SM range
a proxy for its 6 Myr old gradient, we find that the basalt             exhibit only ancient, ductile to ductile-brittle left-lateral de-
flow crossed the Motagua River 360 m above the current el-              formation (Bosc, 1971; Roper, 1978). Finally, the middle
evation of the Motagua River. The basalt yields a plateau               Miocene low-relief surfaces lie at about the same elevation
age of 6.88 ± 0.03 Ma and a slightly less constrained total             north and south of the Motagua fault (Simon-Labric et al.,
age of 6.46 ± 0.09 Ma (Fig. S1-1, Table S1-2). Assuming                 2013). Extension of antithetic boundary faults would need
that incision of the Maya surface started 12 Myr ago, then              to remain well-balanced, despite hundreds of kilometers of
the 2.6 km deep Motagua valley would have been incised                  left-lateral displacement along the Motagua fault since the
at ∼ 350 m Myr−1 between 12 and 7 Ma (d, Fig. 9). Inci-                 middle Miocene, to avoid the development of significant off-
sion would have continued until today at an average rate                sets of these surfaces. The deepening of the Motagua valley
of 79 ± 4 m Myr−1 . If the basalt dam was removed rapidly,              therefore appears to have been achieved by erosion, through
however, then incision would have instead proceeded more                the removal of the erodible Eocene sediments that filled the
slowly, at 59 ± 9 m Myr−1 .                                             Eocene fault basin, giving the valley the appearance of a re-
   The chronology of incision can be refined by incorporat-             cently active graben.
ing the previously dated basalts (Tobisch, 1986). The closest              The incision chronology of the AC range is constrained
occurrence, located 6 km upstream along the Motagua River,              by transverse paleovalleys that are shallowly incised into the
is the 6.1 Ma Cerro lo de China flow. The flow was actually             Maya surface (e.g., Figs. 8a, i and 9). Uplift of the AC range
emplaced 120 km farther west at current plate boundary slip             since their abandonment provided space for the incision of
rates because it lies on the southern side of the Motagua fault.        1500–2600 m deep valleys along the northern flank of the
Conversely, the 3.1 ± 0.7 Ma Cerro Onanopa was emplaced                 range (Fig. 3) at 200–350 m Myr−1 (j, Fig. 9). River incision
on the same side of the plate boundary, 16 km upstream of El            of the AC range therefore started and developed while river
Jute. Its high vesicularity implies an emplacement at or near           incision in the SC-SM range was stalling.
the ground surface, rather than as a sill deep within the Subi-
nal Fm. followed by exhumation. Its base lies < 10 m above
the Motagua River. Strath terraces of the Motagua River have            4.2   Spatial variations in 10 Be-derived erosion rates
been cut in its flanks (Tobisch, 1986), indicating that the flow        Catchment-averaged detrital 10 Be erosion rates range from
underwent some minor burial and exhumation. The accor-                  11 m Myr−1 within the catchments that drain the Maya sur-
dance in elevation between its basal contact and the Motagua            face on the SM range, up to 330 m Myr−1 along the wet and
River suggests that the Motagua River has oscillated tightly            steep northern flank of the AC range (Fig. 10). Most slowly
around its current vertical position over the past 3 Myr.               eroding catchments are located within the SC range. Weight-

https://doi.org/10.5194/esurf-9-795-2021                                                     Earth Surf. Dynam., 9, 795–822, 2021
806 G. Brocard et al.: Tectonically and climatically driven mountain-hopping erosion in central Guatemala Figure 10. Variations in detrital 10 Be hillslope erosion rates along the strike of the plate boundary, from the AC range in the west, to the SM range in the east. Data are projected along the strike of the plate boundary, on an arc displayed on Fig. 6. Arrows show a feeding relationship between nested hillslope sites and catchments. Some uplands drain remnants of the middle Miocene Maya surface (green shaded areas). Detrital 10 Be hillslope erosion rates are compared to river incision rates along the northern (salmon-colored shaded area, SC-N) and southern (blue-shaded area, SM-S) base of the SC-SM range over the past 7 Myr. XAC shows the peak incision rates in the AC range along Río Xacbal, below the Maya surface (Fig. 3). ing erosion rates by the relative concentration of quartz in case (from SMS to SMM to SMI), no increase or decrease is quartz-feeding lithologies only marginally affects the calcu- observed. lated rates (by 3.4 % on average in the SC range, 4.8 % in the SM range, and < 7 % in the AC range). Quartz enrich- 4.3 Distribution of streambed types ment corrections, on the other hand, increase erosion rates by up to 40 % (Fig. 10, Table S2-2), but the amplitude of this A total of 9 % of the rivers retained in the analysis do not effect remains speculative in the absence of field measure- host any knickpoint, 16 % host one knickpoint, 51 % host 2– ments. However, because quartz enrichment increases with 5 knickpoints, and 25 % host 5–12 knickpoints (Fig. 11), re- weathering intensity, its effects are probably smaller in the flecting the high degree of segmentation of many rivers and AC range, where soils erode the fastest. Quartz enrichment high density of knickpoints. The knickpoints delimitate 452 could therefore act such as to reduce contrasts in erosion rates river segments, of which 92 % are well linearized, 6 % are between the SC-SM range and the AC range. concave, and 2 % are convex, for an applied intrinsic con- In the AC range, erosion rates (arrows, Fig. 10) show a cavity θ = 0.5. River segments were grouped according to marked increase from the drier and less steep highlands to streambed types. The distribution of streambed types accord- the wet and steep frontal slopes (from CATA to CHEL to ing to elevation is projected along the strike of the studied XAC). The SM range displays a similar trend of increas- ranges on Fig. 12, and their distribution across the strike of ing erosion down the mountain flank, as entrenchment in the the ranges on Figs. S4-2 to S4-6. Maya surface increases (from COL to FRI to RAN), with one The distribution of alluvial reaches is bimodal in the SC- outlier (SLO). The magnitude of increase in the SM range SM range (Fig. 12a1 and b2): alluvial reaches tend to be is intermediate between the ones measured in the SC and found either at the base of the mountains or at high eleva- CA ranges. In the SC range indeed, a downstream increase tion over the remnants of the Maya surface (e.g., Fig. 8a would be expected to occur first in the downstream direction, and d). High-elevation alluvial reaches tend to transport a between the drainage divide and the mountain flanks, as a rather fine-grained bed load, composed of sand derived from result of the decreasing contribution of slowly eroding low- the weathering of micaschist, gneiss and granite, and gravel relief uplands with downstream distance (Willenbring et al., derived from quartzose veins and silicified pegmatites (Bro- 2013b). Increase should be followed by a decrease in erosion card et al., 2012). Intermediate-elevation alluvial reaches oc- rate as rivers start draining pediments that floor the Chixóy cur upstream of obstructions, most notably landslides in the River catchment. An increase in erosion rate, downstream of SM-SC range, over extremely erodible fault damage zones, the paleosurface, is measured (from PAS to PAE), but it is and within localized areas of tectonic subsidence (especially much less pronounced than in the AC range. The decrease in along the Polochic fault corridor, on the southern flank of the erosion rate is also very subdued (from XEU to CUB). In one AC range). Earth Surf. Dynam., 9, 795–822, 2021 https://doi.org/10.5194/esurf-9-795-2021
G. Brocard et al.: Tectonically and climatically driven mountain-hopping erosion in central Guatemala                          807

                                                                    Most migrating knickpoints dot the brim of upland low-relief
                                                                    surface remnants (Figs. 12a1 and a2 and 8d). They may have
                                                                    therefore initiated when the Maya surface started being in-
                                                                    cised, at ∼ 12 Ma, on the sides of the rising SM-SC range.
                                                                    Other clusters of migrating knickpoints are found halfway
                                                                    down mountain flanks. The most conspicuous of these clus-
                                                                    ters is restricted to the northern flank of the SC range, within
                                                                    the watershed of the Chixóy River. It hangs above a cluster
                                                                    of concave-up migrating knickpoints located at the apexes
                                                                    of pediments restricted to the drainage of the Chixóy River.
                                                                    The significance of these concave-up knickpoints and their
                                                                    genetic relationship with the clusters of convex knickpoints
                                                                    located upstream is discussed in Sect. 5.4.2.
Figure 11. Distribution of rivers according to the number of seg-
ments identified in each river.                                     5     Discussion

                                                                    The decline of river incision rates in the SC-SM range was
   Boulder reaches are found mostly on crystalline rocks.           coeval to the rise of in the AC range (Fig. 9). This can re-
There, they are more frequent on the wet slopes SM range            flect a complete transfer of rock uplift from the SC-SM range
than on the dry slopes of the SC range. In the SM range,            to the AC range, but it remains surprising that river incision
many boulder-strewn reaches form after the winnowing of             rates declined so sharply within the SM range, considering
the fine-grained matrix of debris flows. The SM range is            that the range had not undergone any substantial topographic
the first range hit by tropical depressions tracking from the       decay. Likewise, very low hillslope erosion rates are main-
Caribbean Sea. They trigger numerous landslides along the           tained on steep slopes within the SC-SM range today. A ge-
wettest slopes of the SM range (Ramos Scharrón et al., 2012;        netic relationship can therefore exist between the rise of the
Bucknam et al., 2001). Because SM range soils are more              AC range and the decline of river incision and hillslope ero-
frequently close to water saturation, they are more likely to       sion in the SC-SM range. The rise of the AC range may have
be affected by landslides when earthquakes strike the range         affected incision rates in the SC-SM range in two ways. First,
(Harp et al., 1981). In the SM range, boulder armoring is           by decreasing moisture delivery to the SC-SM range, it may
common on the serpentinite mélanges that crop out up to             have reduced hillslope erosion rates and the delivery of wa-
high elevations along its southern flank, owing to the pres-        ter and sediment to the streams, thereby decreasing river in-
ence of knockers in the mélanges (e.g., Fig. 8c). Boulder-          cision rates. Second, by forcing the drainage of the north-
strewn reaches in the AC range form over phyllites. There,          ern side of the SC range to adjust to rock uplift in the AC
boulders are made of the most resistant beds of Pennsylva-          range, it promoted a decrease in river incision rates upstream
nian phyllites and of sandstone and limestone blocks derived        of the AC among the rivers of the SC range that still cross
from overlying formations that slid along valley flanks down        the AC range. After reviewing the respective contributions
to the streambeds.                                                  of these top-down and bottom-up processes, we analyze how
   Bedrock river reaches are most commonly found down-              they combined to affect the present-day morphological evo-
stream of convex migrating knickpoints, the distribution of         lution of the SC-SM range.
which is presented in the following section.

                                                                    5.1     Effect of the rise of the AC range on climate-driven
4.4   Distribution of steady and migrating knickpoints                      hillslope erosion
Among the 350 identified knickpoints, 40 % can be tied to           5.1.1    Climate and hillslope erosion in modern times
variations in bedrock erodibility, 6 % to temporary obstruc-
tions, 8 % to active tectonics, 21 % to upstream-migrating          Silicate weathering is 3 times faster on the wet (1800–
waves of accelerated erosion, and 14 % to upstream-                 3000 mm yr−1 , Fig. 4) side of the SM range than along its
migrating waves of decelerated incision. A total of 11 % are        drier (1000–2400 mm yr−1 ) side (McAdams et al., 2015). Us-
composite and result from some combination of the above.            ing detrital cosmogenic 10 Be, we find that the wet (1900–
   Details about the significance of the distribution of steady     3700 mm yr−1 ) side of the AC range erodes distinctively
knickpoints, as well as a more systematic review of the origin      faster on average (with a 92 % probability, based on a
of all identified clusters of migrating knickpoints, are pro-       Welch’s t test, with t = 2.246, p = 0.08) than the drier (900–
vided in Supplement 4. Some migrating knickpoints can be            1300 mm yr−1 ) SC range. Individual catchments document
tied to well-identified and well-dated river Quaternary diver-      a 6-fold increase in erosion (50 to 300 m Myr−1 ) from the
sions (e.g., S3-1 to S3-3, Fig. 12a2, Brocard et al., 2012).        SC range to the AC range (Figs. 10 and 13b and c). The

https://doi.org/10.5194/esurf-9-795-2021                                                  Earth Surf. Dynam., 9, 795–822, 2021
808 G. Brocard et al.: Tectonically and climatically driven mountain-hopping erosion in central Guatemala Figure 12. Earth Surf. Dynam., 9, 795–822, 2021 https://doi.org/10.5194/esurf-9-795-2021
G. Brocard et al.: Tectonically and climatically driven mountain-hopping erosion in central Guatemala                                  809

Figure 12. (a, b) Distribution of linearized stream segments and knickpoints along the SC-SM range. (c, d) Distribution of linearized stream
segments and knickpoints along the AC ranges. Distribution of linearized stream segments and knickpoints along the SC-SM and AC ranges.
Mountain ranges are projected on the plate boundary, according to a small circle defined on Fig. 6. (a, b) Southern and northern flanks of
the SC-SM range. (c, d) Southern and northern flanks of the AC range. The key to the abbreviated stream names is provided in Table S4-1
and in the captions of Figs. S4-2 to S4-7. Water gap names are as follows: CUI is Cuilco, SEL is Selegua, and CHX is Chixóy. Paleovalley
numbering is taken from Brocard et al. (2011), river capture numbering is taken from Brocard et al. (2012). LA represents the city of Los
Amates.

https://doi.org/10.5194/esurf-9-795-2021                                                       Earth Surf. Dynam., 9, 795–822, 2021
You can also read