ASCL1 represses a SOX9+ neural crest stem-like state in small cell lung cancer - Genes ...
←
→
Page content transcription
If your browser does not render page correctly, please read the page content below
Downloaded from genesdev.cshlp.org on October 11, 2021 - Published by Cold Spring Harbor Laboratory Press

ASCL1 represses a SOX9+ neural crest
stem-like state in small cell lung cancer
Rachelle R. Olsen,1 Abbie S. Ireland,1 David W. Kastner,1 Sarah M. Groves,2 Kyle B. Spainhower,1
Karine Pozo,3 Demetra P. Kelenis,3 Christopher P. Whitney,1 Matthew R. Guthrie,1 Sarah J. Wait,1
Danny Soltero,1 Benjamin L. Witt,4,5 Vito Quaranta,2 Jane E. Johnson,3,6 and Trudy G. Oliver1
1
 Department of Oncological Sciences, Huntsman Cancer Institute, University of Utah, Salt Lake City, Utah 84112, USA;
2
 Department of Biochemistry, Vanderbilt University, Nashville, Tennessee 37212, USA; 3Department of Neuroscience, University
of Texas Southwestern Medical Center, Dallas, Texas 75390, USA; 4Department of Pathology, University of Utah, Salt Lake City,
Utah 84112, USA; 5ARUP Laboratories at University of Utah, Salt Lake City, Utah 84108, USA; 6Hamon Center for Therapeutic
Oncology Research, University of Texas Southwestern Medical Center, Dallas, Texas 75390, USA

ASCL1 is a neuroendocrine lineage-specific oncogenic driver of small cell lung cancer (SCLC), highly expressed in a
significant fraction of tumors. However, ∼25% of human SCLC are ASCL1-low and associated with low neuroen-
docrine fate and high MYC expression. Using genetically engineered mouse models (GEMMs), we show that al-
terations in Rb1/Trp53/Myc in the mouse lung induce an ASCL1+ state of SCLC in multiple cells of origin. Genetic
depletion of ASCL1 in MYC-driven SCLC dramatically inhibits tumor initiation and progression to the NEUROD1+
subtype of SCLC. Surprisingly, ASCL1 loss promotes a SOX9+ mesenchymal/neural crest stem-like state and the
emergence of osteosarcoma and chondroid tumors, whose propensity is impacted by cell of origin. ASCL1 is critical
for expression of key lineage-related transcription factors NKX2-1, FOXA2, and INSM1 and represses genes involved
in the Hippo/Wnt/Notch developmental pathways in vivo. Importantly, ASCL1 represses a SOX9/RUNX1/RUNX2
program in vivo and SOX9 expression in human SCLC cells, suggesting a conserved function for ASCL1. Together, in
a MYC-driven SCLC model, ASCL1 promotes neuroendocrine fate and represses the emergence of a SOX9+ non-
endodermal stem-like fate that resembles neural crest.
[Keywords: SCLC; ASCL1; mouse models; lung cancer; cell of origin; plasticity; neuroendocrine; small cell lung cancer]
Supplemental material is available for this article.
Received January 20, 2021; revised version accepted April 12, 2021.

Small cell lung cancer (SCLC) is a highly aggressive neuro-                 et al. 2017; Rudin et al. 2019). NE-high SCLCs typically
endocrine lung tumor with a median survival time of ∼12                     display classic morphology with small round blue cells
mo (Sabari et al. 2017; Rudin et al. 2019). Almost all                      and scant cytoplasm. In contrast, ∼25% of SCLCs are as-
SCLCs exhibit inactivation of the tumor suppressor genes                    sociated with high MYC expression, and these tend to
RB1 and TP53, along with mutually exclusive gain of a                       have variant morphology with an ASCL1-low/NE-low
MYC family oncogene including MYC, MYCL, or                                 gene expression profile and high levels of NEUROD1,
MYCN (George et al. 2015; Brägelmann et al. 2017; Gazdar                    POU2F3, or YAP1. We reported the first genetically engi-
et al. 2017). While SCLC has historically been treated as a                 neered mouse model (GEMM) of MYC-driven SCLC (Mol-
single disease in the clinic, it is increasingly appreciated to             laoglu et al. 2017) and demonstrated that MYC promotes
be composed of distinct molecular subtypes defined by ex-                   the variant, ASCL1-low subtype of SCLC that can express
pression of lineage-related transcription factor genes                      NEUROD1, POU2F3, or YAP1, which is impacted by cell
ASCL1, NEUROD1, POU2F3, or YAP1 (Rudin et al.                               of origin and tumor cell plasticity (Ireland et al. 2020).
2019; Poirier et al. 2020). Approximately 70% of SCLCs                         ASCL1 and NEUROD1 are lineage-specifying basic he-
are characterized by high expression of ASCL1 and                           lix-loop-helix transcription factors that activate neuroen-
MYCL, along with high expression of neuroendocrine                          docrine genes and are required for neural differentiation
(NE) markers such as synaptophysin (SYP), ubiquitin C-                      (Borromeo et al. 2016; Rudin et al. 2019). Genetic knock-
terminal hydrolase L1 (UCHL1) and chromogranin A                            out studies in the mouse demonstrate that ASCL1 is
(CHGA) (George et al. 2015; Gazdar et al. 2017; Mollaoglu                   essential for the development of pulmonary neuroendo-
                                                                            crine cells (PNECs) (Ito et al. 2000), and ASCL1 is
Corresponding author: trudy.oliver@hci.utah.edu
Article published online ahead of print. Article and publication date are   © 2021 Olsen et al. This article, published in Genes & Development, is
online at http://www.genesdev.org/cgi/doi/10.1101/gad.348295.121. Free-     available under a Creative Commons License (Attribution-NonCommer-
ly available online through the Genes & Development Open Access             cial 4.0 International), as described at http://creativecommons.org/licens-
option.                                                                     es/by-nc/4.0/.

                  GENES & DEVELOPMENT 35:1–23 Published by Cold Spring Harbor Laboratory Press; ISSN 0890-9369/21; www.genesdev.org                  1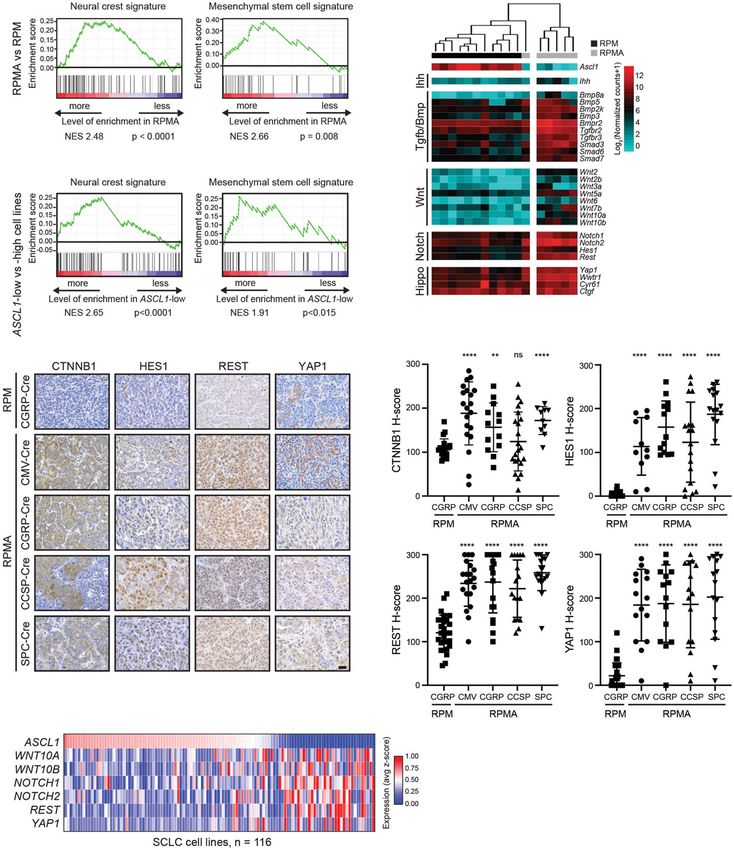
Downloaded from genesdev.cshlp.org on October 11, 2021 - Published by Cold Spring Harbor Laboratory Press

Olsen et al.

expressed in the adult lung specifically in PNECs (Borges           with all four Cre viruses but with differing tumor laten-
et al. 1997). Importantly, ASCL1 is necessary for the de-           cies and locations in the lung (Fig. 1A,B; Supplemental
velopment of classic SCLC as demonstrated in the Rb1fl/             Fig. S1A; Supplemental Table S1). RPM-CMV tumors
fl
   ;Trp53fl/fl;Rbl2fl/fl (RPR2) mouse model where condition-        had the shortest latency (43 d median survival), followed
al Ascl1 deletion abolishes tumor formation (Borromeo               by RPM-CGRP tumors (55 d median survival). Compared
et al. 2016). NEUROD1 is not required for SCLC initiation           with results from the RP model (Sutherland et al. 2011),
or progression in the RPR2 model, consistent with the ab-           targeting of club cells with CCSP-Cre led to tumors
sence of NEUROD1 expression in classic SCLC models                  with a surprisingly short latency (77 d median survival)
(Borromeo et al. 2016; Mollaoglu et al. 2017). NEUROD1              and was almost as efficient at tumor initiation as targeting
is expressed in the variant MYC-driven SCLC model and               NE cells, suggesting that club cells are highly susceptible
has recently been suggested to temporally follow ASCL1              to MYC-mediated SCLC transformation. AT2 cells were
during MYC-driven subtype evolution (Ireland et al.                 the most resistant to transformation as RPM tumors initi-
2020). However, the function of ASCL1 and NEUROD1                   ated with SPC-Cre had the longest latency (184 d median
in MYC-driven tumors in vivo has not yet been                       survival) (Fig. 1A). Review by board-certified pathologists
determined.                                                         (A. Gazdar and B.L. Witt) confirmed that RPM mice in-
    PNECs have been generally accepted to be the cell of or-        fected with different cell type-specific Cre viruses pre-
igin for SCLC, although recent studies have challenged              dominantly developed SCLC, with a mixture of classic
whether they are the only relevant initiating cell population       and variant histopathologies and perilymphatic spread
(Huang et al. 2018; Yang et al. 2018; Ferone et al. 2020; Ire-      (Fig. 1B; Supplemental Fig. S1A; Supplemental Table S1).
land et al. 2020). SCLC shares molecular similarities with          CGRP-Cre-initiated RPM tumors were predominantly lo-
normal PNECs, including expression of ASCL1 and its neu-            cated in the large airways, while tumors in the CCSP-Cre
roendocrine target genes. Studies in mouse models have              mice were often located within bronchioles, as well as no-
demonstrated that PNECs are the most permissive for                 table perivascular cuffing; AT2-derived tumors were more
SCLC development in the original classic Rb1fl/fl;Trp53fl/fl        commonly found in the alveolar space of the distal lung
(RP) model and in RPR2 mice (Park et al. 2011; Sutherland           (Supplemental Fig. S1A). Combined with previous studies
et al. 2011). Club cells and alveolar type II (AT2) cells in        in the RP and RPR2 mice using the same viruses (Park
these studies were relatively resistant to SCLC transforma-         et al. 2011; Sutherland et al. 2011; Yang et al. 2018), these
tion (Park et al. 2011; Sutherland et al. 2011). More recently,     results suggest that genetic alterations can dictate the sus-
a subset of SCLC was revealed to harbor a tuft cell-like sig-       ceptibility of cells to serve as a cell of origin for SCLC.
nature with dependency on the tuft cell transcription factor
POU2F3 (Huang et al. 2018), suggesting that the tuft cell
                                                                    MYC-driven SCLC induces ASCL1 in multiple
may serve as a cell of origin for SCLC. Basal cells have
                                                                    cells of origin
also been described as cells of origin for SCLC (Park et al.
2018; Ferone et al. 2020). Together, these studies suggest          To further determine whether tumors in this model were
that lung cells may have broad plasticity for SCLC transfor-        neuroendocrine, we examined in situ and invasive tumors
mation, but the cell(s) of origin for MYC-driven SCLC have          for expression of ASCL1 and other NE markers including
not been investigated.                                              CGRP, UCHL1, and SYP. Interestingly, in situ tumors
    Here, we used new GEM models to determine the func-             from each cohort were dominated by an ASCL1high/NEhigh
tion of ASCL1 in MYC-driven SCLC derived from multi-                phenotype even when tumors were initiated in non-NE
ple cells of origin.                                                cells with CCSP-Cre or SPC-Cre and located in regions
                                                                    that should not have ASCL1+ cells (Fig. 1C). NEhigh in
                                                                    situ tumors were proliferative and did not express CCSP
Results                                                             or SPC (Supplemental Fig. S1B), suggesting that the origi-
                                                                    nal cell fate identities were rapidly lost. Consistent with
MYC-driven SCLC can arise in multiple lung cell types
                                                                    the classic NEhigh state of these in situ lesions, the major-
Myc overexpression in the Rb1fl/fl;Trp53fl/fl; Myc-                 ity of in situ RPM tumors expressed low to undetectable
T58ALSL/LSL (RPM) mouse model promotes the develop-                 levels of NEUROD1, YAP1, and POU2F3 (Fig. 1C), tran-
ment of a variant, neuroendocrine-low subtype of SCLC               scription factors associated with NElow SCLC subtypes
that recapitulates features of the human disease (Mollao-           (Rudin et al. 2019). These results suggest that MYC over-
glu et al. 2017). To determine which cell types in the              expression in the context of Rb1/Trp53 loss alters the orig-
normal lung epithelium are capable of initiating tumori-            inal cellular differentiation state and initially reprograms
genesis in the RPM model, we intratracheally infected               cells toward a NE-like progenitor.
mice with adenoviruses (1 × 10⁸) carrying cell type-specif-            In contrast to the in situ tumors, invasive RPM tumors
ic promoters driving Cre recombinase expression. We                 were dominated by an ASCL1low/NElow phenotype largely
used a general Cmv promoter, a neuroendocrine Cgrp pro-             independent of the cell of origin, and tended to express
moter, a club cell Ccsp promoter, and an AT2 Spc promot-            higher levels of NEUROD1 and YAP1 (Fig. 1D,E). Interest-
er, whose specificity have been described (Park et al. 2011;        ingly, tumors initiated in club cells exhibited significantly
Sutherland et al. 2011; Yang et al. 2018; Ferone et al.             higher ASCL1 and less YAP1 (Supplemental Fig. S1C), sug-
2020). The combination of Myc overexpression with Rb1               gesting club cells may not progress as readily as tumors
and Trp53 loss was sufficient to initiate tumorigenesis             from other cells of origin. Although POU2F3 levels were

2       GENES & DEVELOPMENT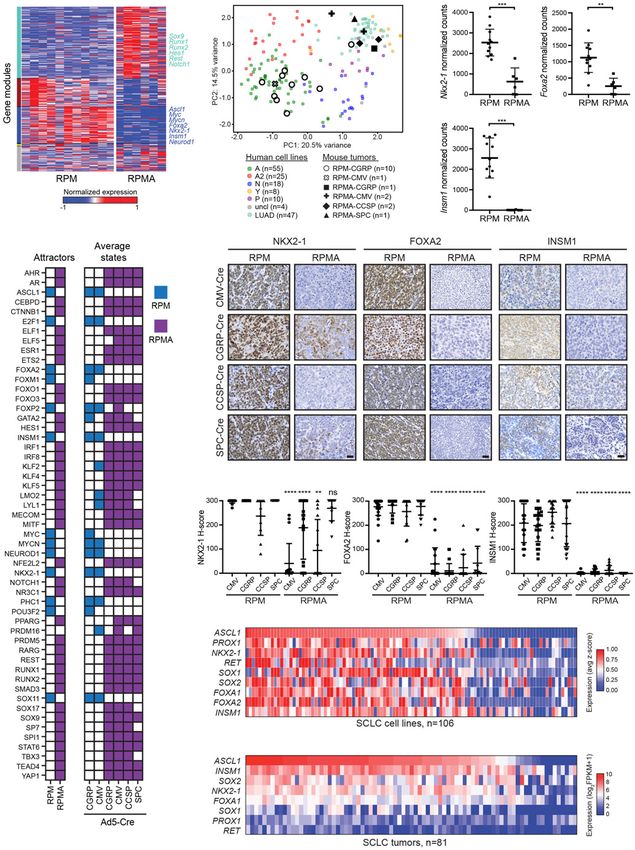
Downloaded from genesdev.cshlp.org on October 11, 2021 - Published by Cold Spring Harbor Laboratory Press

                                                                                                             ASCL1 represses SOX9 in SCLC

              A                                           B

             C

             D

             E

Figure 1. MYC-driven SCLC can arise in multiple lung cell types and initially expresses ASCL1. (A) Survival of RPM mice infected
with indicated cell type-specific Ad-Cre viruses. Number of mice indicated in the figure. Mantel-Cox log-rank test, (∗∗∗∗ ) P < 0.0001. (B)
Representative H&E histology of SCLC from RPM mice initiated with indicated Ad-Cre viruses. Scale bar, 25 µm. (C) Representative
immunohistochemistry (IHC) of early in situ tumor lesions for indicated neuroendocrine (NE) or non-NE markers (top) in RPM mice
infected with indicated Ad-Cre viruses (left). Arrows indicate in situ tumors. Images shown are from mice collected at approximately
the following time points postinfection: CMV 43 d, CGRP 55 d, CCSP 80 d, and SPC 180 d. Scale bar, 25 µm. (D) Representative IHC of
large, invasive tumors for indicated neuroendocrine (NE) or non-NE markers (top) in RPM mice infected with indicated Ad-Cre viruses
(left). Images shown are from mice collected at approximately the following time points postinfection: CMV 43 d, CGRP 55 d,
CCSP 80 d, and SPC 180 d. Scale bar, 25 µm. (E) H-score quantification of IHC in C and D. H-score = percentage positive cells multi-
plied by intensity score of 0–3 (see the Materials and Methods). Approximately 70–200 tumors from three to 10 mice per condition were
quantified. Data are shown as mean ± standard deviation (SD). Mann-Whitney two-tailed t-tests, (∗∗ ) P < 0.01, (∗∗∗∗ ) P < 0.0001. See also
Supplemental Figure S1.

                                                                                                          GENES & DEVELOPMENT            3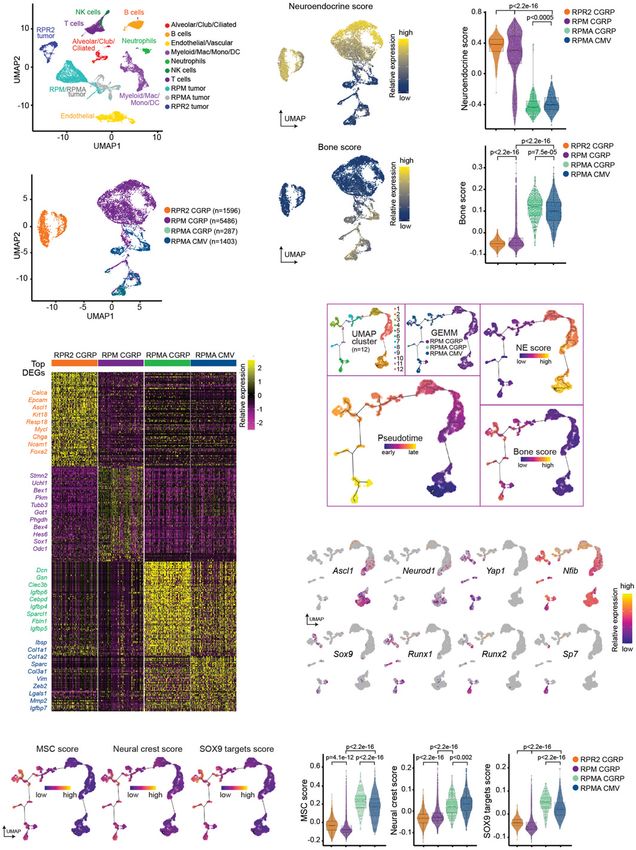
Downloaded from genesdev.cshlp.org on October 11, 2021 - Published by Cold Spring Harbor Laboratory Press

Olsen et al.

not significantly elevated in all of the models, we observed        Fig. S2C). Bone-like lesions in RPMA tumors were con-
an increase in POU2F3+ tumors specifically in the RPM-              firmed by trichrome (Fig. 2D), Periodic acid–Schiff (PAS)
CMV mice (Supplemental Fig. S1C), consistent with re-               with Alcian blue (PAB) (Supplemental Fig. S2D), and Tolu-
cent studies (Ireland et al. 2020), suggesting that the             idine blue (Supplemental Fig. S2E) staining.
Cmv promoter may occasionally be targeting a POU2F3+                   By microCT imaging, the osteosarcoma-like tumors
tuft cell (Huang et al. 2018). Together, this suggests that         were frequently observed in RPMA-CMV and RPMA-
RPM tumors induce an ASCL1+ NEhigh phenotype in mul-                CGRP mice, less frequent in RPMA-CCSP mice, and not
tiple cells of origin that can progress to a NE-low state.          detectable in RPMA-SPC mice (Fig. 2E). However, upon
                                                                    histopathological review, two RPMA-SPC mice did have
                                                                    areas of focal bone formation with osteoid (Fig. 2E). While
ASCL1 loss delays tumorigenesis and promotes bone
                                                                    osteosarcomas were detected in all of the RPMA-CMV
and cartilage differentiation
                                                                    mice analyzed, we also frequently observed adenocarcino-
Since ASCL1 has been shown to be required for develop-              mas and, more rarely, tumors with chondroid differentia-
ment of classic SCLC in the RPR2 model (Borromeo                    tion in these mice (Fig. 2F; Supplemental Table S1).
et al. 2016), we sought to determine the role of ASCL1              RPMA-CGRP mice more frequently developed SCLC
in MYC-driven variant SCLC. We crossed RPM mice to                  than with other cells of origin, as well as osteosarcomas
Ascl1-floxed animals to generate Rb1fl/fl;Trp53fl/fl;Myc-           (Supplemental Table S1). The majority of both in situ
T58ALSL/LSL;Ascl1fl/fl (RPMA) mice and infected RPMA                and invasive RPMA tumors lacked ASCL1 expression
mice with cell type-specific adenoviruses. In contrast to           (Supplemental Fig. S2F,G), with the exception of RPMA-
findings in classic SCLC models (Borromeo et al. 2016),             CGRP mice, consistent with more SCLC and unrecom-
RPMA mice developed tumors in the lung, albeit with sig-            bined Ascl1 alleles in this model. CCSP- and SPC-RPMA
nificantly delayed latencies compared with RPM mice                 mice developed a mixture of adenocarcinomas, NE tumors
(Fig. 2A). RPMA-CMV mice developed tumors with the                  (some of which retained ASCL1), and, more rarely, osteo-
shortest median survival of 85 d (2.0-fold longer than              sarcomas (Supplemental Table S1). Altogether, in contrast
RPM-CMV mice), while RPMA mice infected with                        to RPM mice, RPMA mice succumbed to a mixture of os-
CGRP-Cre had a median survival of 133 d (2.4-fold longer            teosarcomas, NE tumors that often retained ASCL1, and
than RPM-CGRP mice). Median survival in the RPMA-                   adenocarcinomas, whose frequency differed by cell of ori-
CCSP mice was 204 d (2.6-fold longer than RPM-CCSP                  gin (Fig. 2G). Similar to RPM tumors, in situ RPMA tumors
mice). RPMA-SPC tumors had the longest latency (medi-               appeared to lack or lose expression of CCSP and SPC early
an survival 402 d; ∼2.2-fold longer than RPM-SPC mice).             regardless of initial cell of origin (Supplemental Fig. S2F).
Thus, tumor latency differed by cell of origin in both the          Consistent with the longer latency and increased frequen-
RPM and RPMA models. Successful Cre-mediated recom-                 cy of adenocarcinomas and osteosarcomas in RPMA mice
bination of the Rb1, Trp53, and Ascl1 alleles in these mice         (compared with SCLC in RPM mice), RPMA tumors had
was assessed by genomic PCR on individual microdis-                 reduced proliferation as assessed by Ki67 levels compared
sected RPMA tumors (Supplemental Fig. S2A). We ob-                  with RPM tumors (Supplemental Fig. S2H). Some RPMA
served recombined Rb1, Trp53, and Ascl1 alleles in                  mice had lymph node metastases, including one animal
∼94% of tumors. Unrecombined alleles were also detect-              that appeared to have an osteosarcoma metastasis to the
ed in the majority of samples, but we cannot rule out that          lymph node (Supplemental Fig. S2I).
this represents normal tissue contamination in each tu-                Interestingly, small RPMA tumors were primarily non-
mor because it is difficult to cleanly dissect these tumors.        calcified (“soft”), while large invasive RPMA tumors dis-
We detected tumors frequently in the RPMA-CGRP mod-                 played a mix of soft and osteosarcoma phenotypes (Fig.
el (and less frequently in the other models), that expressed        2H), suggesting that tumors arise in a dedifferentiated state
ASCL1 protein and did not recombine the Ascl1 alleles               that later adopts a bone phenotype. Consistent with this
and, in these cases, exhibited NE morphology (Supple-               hypothesis, we often observed bone differentiation arising
mental Fig. S2B; Supplemental Table S1).                            within the centers of soft tissue tumors by microCT imag-
   While imaging RPMA mice by microCT, we made the                  ing (Fig. 2I). Moreover, osteoid and chondroid differentia-
unexpected observation that mice were developing lung tu-           tion appeared to be surrounded by less differentiated
mors with a tissue density consistent with bone (Fig. 2B).          cells (Fig. 2J). Given the differing tumor latencies by cell
Bone analysis by microCT imaging of RPM mice with                   of origin, we suspect that bone differentiation emerges
high lung tumor burden identified only the skeleton (Fig.           over time from less differentiated tumors depending on
2B, top panel; Supplemental Movies). In contrast, bone anal-        the tumor microenvironment. These data suggest that,
ysis of RPMA-CMV, RPMA-CGRP, and RPMA-CCSP ani-                     in the context of MYC-driven SCLC, ASCL1 represses a la-
mals identified both the skeleton as well as multiple               tent osteogenic fate and that distinct cells of origin have
bone-like tumors within the lung (Fig. 2B, bottom panels;           differing propensities for bone differentiation.
Supplemental Movies). At necropsy, many RPMA lesions
were mineralized and required decalcification prior to sec-
                                                                    RPMA tumors are transcriptionally distinct with loss
tioning (Fig. 2C). Analysis of H&E-stained tissues by a
                                                                    of ASCL1 and NEUROD1 target genes
board-certified pathologist (B.L. Witt) confirmed that
RPMA lungs contained high-grade osteosarcoma with                   Following the striking observation that loss of ASCL1 in
well-developed osteoid (Fig. 2C, right panels; Supplemental         MYC-driven SCLC promotes osteosarcoma formation,

4       GENES & DEVELOPMENT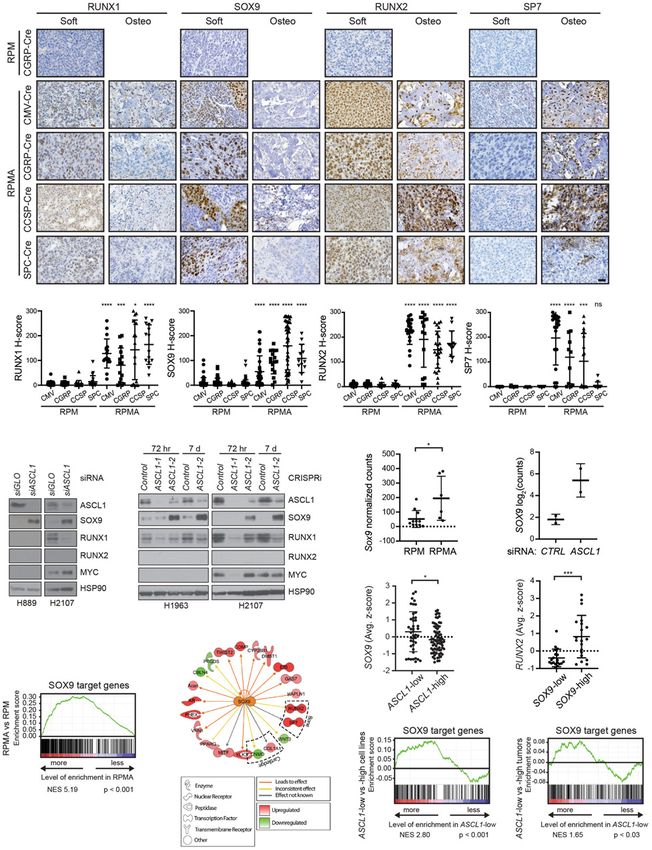
Downloaded from genesdev.cshlp.org on October 11, 2021 - Published by Cold Spring Harbor Laboratory Press

                    A                                                    D

                                                                         E

                    B

                                                                         F                  G

                                                                         H
                    C

                                                                         I                 J

Figure 2. ASCL1 loss delays tumorigenesis and promotes bone differentiation in multiple cells of origin. (A) Survival curve comparing
RPM (solid lines; data from Fig. 1A) versus RPMA mice (dashed lines) infected with indicated cell type-specific Cre viruses. Number of
mice indicated in the figure. (+)Mice censored to end the cohort. Mantel-Cox log-rank test, (∗∗∗∗ ) P < 0.0001. (B, top row) Representative
bone analysis of microCT images in RPM versus RPMA mice with advanced lung tumors infected with the indicated Ad-Cre viruses. (Bot-
tom rows) Matched axial, coronal, and sagittal cross-sections of RPM and RPMA lungs used for bone analysis. Images were collected at the
following time points postinfection: RPM-CGRP 49 d, RPMA-CMV 111 d, RPMA-CGRP 139 d, and RPMA-CCSP 204 d. (C) Representa-
tive microCT axial cross-sections, necropsy images, and H&E staining for tumors from RPMA mice infected with indicated Ad-Cre virus-
es. Images were from mice collected at the following time points postinfection: CMV 85 d, CGRP 138 d, CCSP 204 d, and SPC 204 d. In
microCT panel, yellow arrowheads indicate areas of focal bone formation. Necropsy image shows one whole lung lobe. In H&E panels,
scale bar indicates 50 µm in 10× image (left), and 25 µm in the 40× image (right). (D) Representative Trichrome staining in RPM-CMV
(43 d postinfection) versus RPMA-CMV (111 d postinfection) tumors. Scale bars: 50 μm for 10× image (top), 25 μm for 40× image (bottom).
(E) Table indicating number of RPMA mice per cohort with lung tumors detected by microCT imaging, bone detected by microCT, or
bone detected by H&E review. (F ) Representative H&E from indicated mouse with adenocarcinoma or osteosarcoma and chondroid dif-
ferentiation in adjacent tumor areas. Scale bars: 50 μm for 10× image (second image from top), 25 μm for 40× images. (G) Percent of
RPM and RPMA mice infected with indicated cell type-specific Cre viruses that succumbed to the indicated tumor histological type.
RPMA animals had a mixture of tumor types in each animal but were scored based on the preponderance of tumor type and size. “Oth-
er/mets” include animals that were sacrificed without tumors to end the cohort or that succumbed due to lymph node or brain metastases.
(H) Size of individual soft tissue tumors and osteosarcomas quantified from PAB-stained slides from a representative RPM-CMV or
RPMA-CMV mouse. (I) Representative microCT image from an RPMA-CGRP mouse showing bone density within the center of a soft
tissue mass; tumor circled with dashed yellow line in inset. (J) Representative H&E from indicated mouse with osteosarcoma or chondroid
differentiation. Scale bar indicates 50 μm for 10× image (top) and 25 μm for 40× image (bottom). See also Supplemental Figure S2, Supple-
mental Table S1, and Supplemental Movies.

                                                                                                          GENES & DEVELOPMENT            5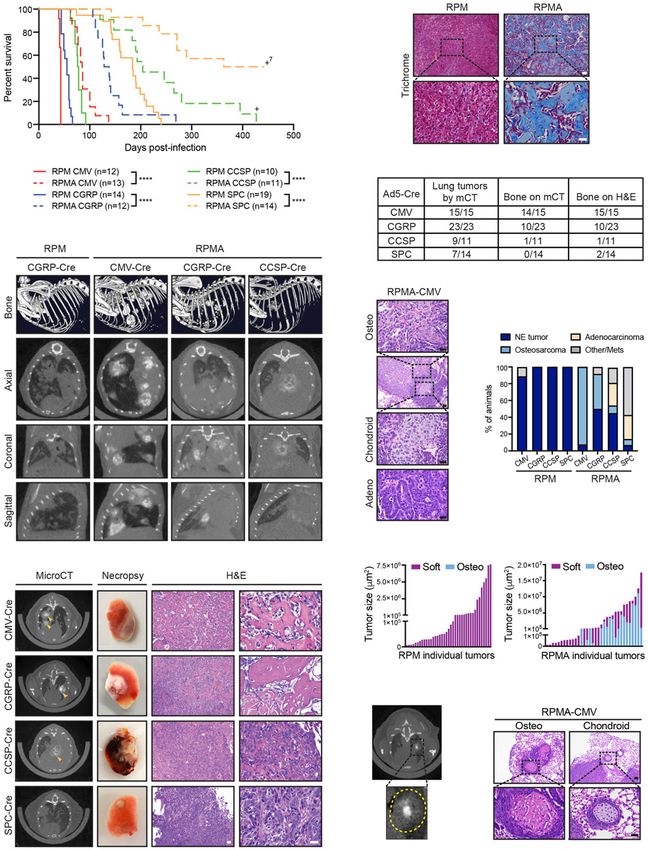
Downloaded from genesdev.cshlp.org on October 11, 2021 - Published by Cold Spring Harbor Laboratory Press

Olsen et al.

we sought to better understand the transcriptional pro-             2019), we determined rules of interaction between tran-
gram of RPMA tumors. We performed RNA sequencing                    scription factors (Supplemental Fig. S3B). For example,
(RNA-seq) on variant RPM (n = 11), classic RPR2 (n = 6),            ASCL1 is regulated by eight parent nodes (AR, E2F1,
and uncalcified RPMA tumors (n = 6). Consistent with                HES1, KLF4, MITF, NR3C1, PHC1, and RUNX1) where
their histological differences, principal component analy-          each ON/OFF combination of these parent nodes deter-
sis of RNA-seq data revealed distinct clustering of all             mines ASCL1 expression. Likewise, ASCL1 regulates ex-
three tumor types (Fig. 3A). We verified that Ascl1                 pression of a number of downstream transcription
mRNA was significantly depleted in RPMA tumors and                  factors. These regulations define how a cell may change
established ASCL1 target genes including NE genes                   its identity or reach a stable phenotype (an “attractor
were significantly reduced in RPMA compared with                    state”). Dynamic simulations identified two attractor
RPM tumors (Fig. 3B–D). We performed differential gene              states, each corresponding to either RPM or RPMA tu-
expression (DEG) analysis to identify genes and pathways            mors (Fig. 4B). As described in Wooten et al. (2019), a ran-
that discriminate the RPMA and RPM tumors. Interest-                dom walk was used to predict regulators driving these
ingly, Neurod1 was one of the most significantly down-              steady states. Satisfyingly, in silico silencing of the
regulated genes in RPMA versus RPM tumors (Fig. 3E)                 ASCL1 node destabilized the RPM attractor, consistent
with complete loss of Neurod1 transcript counts (Fig.               with experimental results (Fig. 4B). Conversely, activation
3F). As assessed by IHC, the majority of both in situ and           of ASCL1 or NEUROD1 in the RPMA attractor destabi-
invasive RPMA tumors lacked NEUROD1 protein, in                     lized that steady state, reminiscent of human SCLC, in
contrast to high levels observed in RPM tumors (Fig.                which ASCL1 is a destabilizer of the nonneuroendocrine
3G). We did detect NEUROD1 expression particularly in               subtype (SCLC-Y) (Wooten et al. 2019). By comparing hu-
RPMA-CGRP tumors that retained the SCLC phenotype.                  man cell lines (n = 120 total SCLC cell lines from CCLE
Gene set enrichment analysis (GSEA) using established               and cBioPortal, 91 of which are distinct, and n = 47 lung
human NEUROD1 target genes (Borromeo et al. 2016)                   adenocarcinoma cell lines from CCLE) to mouse tumors
combined with NEUROD1 ChIP-seq from mouse RPM                       using PCA, RPMA tumors clustered with the nonneur-
tumors revealed a significant depletion of NEUROD1 tar-             oendocrine POU2F3 and YAP1 SCLC subtypes and lung
get genes in RPMA compared with RPM tumors (Fig. 3H).               adenocarcinoma (Fig. 4C), suggesting a similarity between
These data reveal that deletion of ASCL1 in RPM tumors              RPMA tumors and human non-NE tumors.
during tumor initiation abolishes the NEUROD1+ sub-                    Based on these results, we included other known NE-
type of SCLC, consistent with recent findings that Ascl1            fate specifiers like INSM1 and transcription factors impor-
expression temporally precedes Neurod1 expression dur-              tant in endodermal and lung adenocarcinoma fate, such as
ing MYC-driven SCLC progression (Ireland et al. 2020).              NKX2-1 and FOXA2, in our network. While all of these
   Consistent with the observed osteoid formation, GSEA             genes were significantly reduced in invasive RPMA tu-
demonstrated a significant positive enrichment for bone             mors (Fig. 4D), only FOXA2 was predicted to significantly
development genes in RPMA compared with RPM tumors                  affect the dynamics of the transcription factor network.
(Fig. 3I). Gene ontology (GO) enrichment analysis re-               We examined protein levels of NKX2-1, FOXA2, and
vealed that ossification-related processes were signifi-            INSM1 in RPM and RPMA tumors. Both RPM and
cantly up-regulated in RPMA compared with RPM                       RPMA in situ tumors initially expressed NKX2-1 regard-
tumors (Fig. 3J). Significantly depleted biological process-        less of cell of origin (Supplemental Fig. S3C), which was
es in RPMA tumors included those related to neuronal de-            lost in invasive osteosarcoma RPMA tumors but less so
velopment (Fig. 3K), consistent with the loss of ASCL1              in the NE tumors and adenocarcinomas (Fig. 4E,F).
and NEUROD1 in these tumors. Together, these data                   NKX2-1 is known to be important for adenocarcinoma
highlight a critical role for ASCL1 in promoting NE cell            cell fate, so it is not surprising that the adenocarcinomas
fate and repressing an underlying osteosarcoma-like fate            maintain NKX2-1. In contrast to RPM in situ tumors,
in RPM mice.                                                        FOXA2 and INSM1 were not highly expressed in RPMA
                                                                    in situ tumors, with the exception of RPMA-CGRP tu-
                                                                    mors with SCLC morphology that exhibited levels of
Network analyses predict transcriptional regulators that
                                                                    FOXA2 and INSM1 that were comparable with RPM con-
drive osteosarcoma cell fate upon ASCL1 loss
                                                                    trols (Supplemental Figs. S2G, S3C). At the invasive stage,
To identify the key transcription factors responsible for           NKX2-1, FOXA2, and INSM1 were significantly reduced
this dramatic change in cell fate upon ASCL1 loss, we               in RPMA mice compared with RPM (Fig. 4E,F). NFIB, pre-
turned to weighted gene coexpression network analysis               viously implicated as a direct MYC target gene (Mollaoglu
(WGCNA). First, we generated a coexpression network                 et al. 2017), was highly expressed in both in situ and inva-
of all genes, which allowed the identification of distinct          sive RPMA tumors from all cells of origin, including
gene modules across all RPM and RPMA samples (Fig.                  RPMA osteosarcomas (Supplemental Fig. S3D). Con-
4A; Supplemental Fig. S3A). Strikingly, approximately               sistently, in human SCLC cell lines from the SCLC-Cell-
one-third of the transcriptome was altered upon ASCL1               Miner database (Tlemsani et al. 2020), ASCL1 expression
loss. To generate a gene regulatory network, we focused             positively correlated with NKX2-1, FOXA1, FOXA2, and
on transcription factors predicted by WGCNA to be cen-              INSM1 (Fig. 4G), with similar results in human SCLC tu-
tral to DEG modules, as well as known regulators of                 mors (Fig. 4H). Thus, ASCL1 loss leads to coordinate loss
lung cancer cell fate. Using BooleaBayes (Wooten et al.             of other key lineage-related transcription factors, which

6       GENES & DEVELOPMENT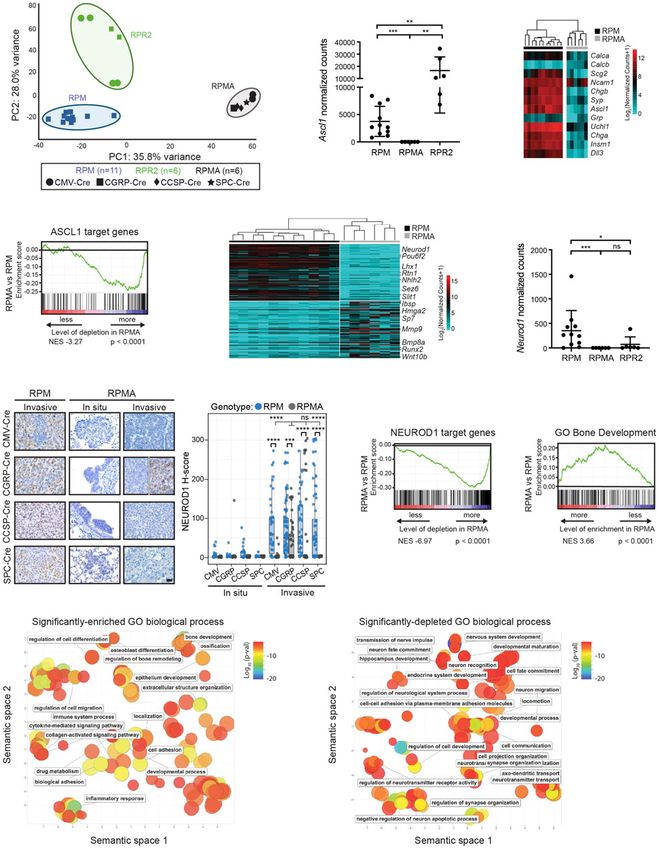
Downloaded from genesdev.cshlp.org on October 11, 2021 - Published by Cold Spring Harbor Laboratory Press
A B C
D E F
G H I
J K
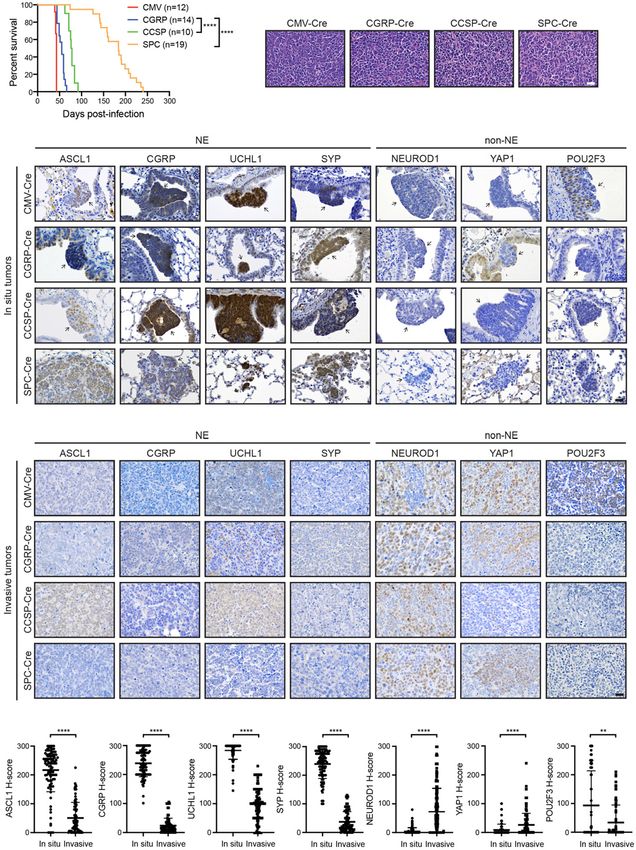
Figure 3. RPMA tumors are transcriptionally distinct with loss of ASCL1 and NEUROD1 target genes. (A) Principal component (PC)
analysis comparing gene expression by bulk RNA-seq in RPM, RPMA, and RPR2 tumors with Ad-Cre virus indicated in the figure. (B)
Ascl1 expression shown as normalized counts by RNA-seq from lung tumors in indicated GEMMs. Mean ± SD. Mann-Whitney two-tailed
t-test, (∗∗ ) P < 0.01, (∗∗∗ ) P < 0.0003. (C ) Heat map comparing log2 normalized counts for expression of select neuroendocrine genes in RPM
versus RPMA tumors. (D) Gene set enrichment analysis (GSEA) in RPMA versus RPM tumors using ASCL1 ChIP-seq target genes from
Borromeo et al. (2016). Normalized enrichment score (NES) and P-value indicated in figure. (E) Heat map of top 200 (100 up and 100 down)
differentially expressed genes in RPMA versus RPM tumors with select genes indicated. (F) Neurod1 expression as normalized counts by
RNA-seq from lung tumors in indicated GEMMs. Mean ± SD. Mann-Whitney two-tailed t-test, (∗ ) P < 0.05, (∗∗∗ ) P < 0.001, (ns) not signifi-
cant. (G) Representative IHC and H-score quantification for NEUROD1 in indicated tumors. Approximately 20–100 tumors were quan-
tified from five to seven mice per condition. Images are from mice collected at approximately the following time points postinfection:
RPM-CMV 43 d, RPM-CGRP 45 d, RPM-CCSP 80 d, RPM-SPC 185 d, RPMA-CMV in situ 85 d, RPMA-CMV invasive 95 d, RPMA-
CGRP in situ 125 d, RPMA-CGRP invasive 180 d, RPMA-CCSP in situ 265 d, RPMA-CCSP invasive 220 d, RPMA-SPC in situ 290 d,
and RPMA-SPC invasive 360 d. Scale bar, 25 µm. RPMA-CGRP IHC panel is split to indicate heterogeneity observed. Data from RPM
in situ tumors are also shown in Supplemental Figure S1C. For box plots, the median and interquartile range are shown (top of box is
25th percentile, bottom of box is the 75th percentile). Gray statistics line bars indicate comparisons between RPMA models; black sta-
tistics line bars indicate comparisons between RPM and RPMA models initiated with the same virus. Mean ± SD. Mann-Whitney two-
tailed t-test, (∗∗∗ ) P = 0.0005, (∗∗∗∗ ) P < 0.0001, (ns) not significant. (H) GSEA comparing RPMA versus RPM tumors using NEUROD1
ChIP-seq target genes from RPM tumors (n = 2) and human SCLC cell lines from Borromeo et al. (2016). Normalized enrichment score
(NES) and P-value indicated in the figure. (I) GSEA comparing RPMA versus RPM tumor gene expression to a known ossification signa-
ture, “GO_Bone_Development.” NES and P-values are indicated in the figure. (J) Scatter plot visualizing semantic similarity of GO bio-
logical processes enriched in RPMA versus RPM tumors. (K) Scatter plot visualizing semantic similarity of GO biological processes
depleted in RPMA versus RPM tumors.
GENES & DEVELOPMENT 7
Downloaded from genesdev.cshlp.org on October 11, 2021 - Published by Cold Spring Harbor Laboratory Press

                A                                    C                                   D

                B                                E

                                                 F

                                                 G

                                                 H

Figure 4. Network analyses predict transcriptional regulators that drive osteosarcoma cell fate upon ASCL1 loss. (A) Weighted gene
coexpression network analysis (WGCNA) reveals coexpressed gene modules (colored bars on the left Y-axis label) in RPM and RPMA tu-
mors. (B) Binarized average states and state-attractors in RPM (blue) and RPMA (purple) tumors initiated with the indicated Cre viruses.
For each gene, colored squares are ON and white squares are OFF. (C ) Principal component (PC) analysis comparing bulk RNA-seq expres-
sion in human SCLC cell lines (SCLC lines from CCLE and cBioPortal and lung adenocarcinoma [LUAD] cell lines from CCLE) with
mouse RPM or RPMA tumors initiated with the indicated viruses. Human SCLC cell lines were classified into subtypes based on high
expression of ASCL1 (A and A2 variant), NEUROD1 (N), POU2F3 (P), or YAP1 (Y), or were unclassified (uncl). Mouse tumors were har-
vested at the following time points postinfection: RPM-CMV 55 d, RPM-CGRP 47–61 d, RPMA-CMV 85–86 d, RPMA-CGRP 111 d,
RPMA-CCSP 120–204 d, and RPMA-SPC 204 d. (D) Normalized counts of indicated genes from RNA-seq in indicated GEMMs from
C. Data are shown as mean ± SD. Mann-Whitney two-tailed t-test, (∗∗∗ ) P < 0.001; (∗∗ ) P < 0.01. (E) Representative IHC images for indicated
antibodies in RPM and RPMA mice infected with cell type-specific Cre viruses. Images were collected from mice at approximately the
following time points postinfection: RPM-CMV 43 d, RPM-CGRP 50 d, RPM-CCSP 85 d, RPM-SPC 190 d, RPMA-CMV 95 d, RPMA-
CGRP 160 d, RPMA-CCSP 210 d, and RPMA-SPC 310 d. Scale bar, 25 µm. (F ) H-Score IHC quantification for indicated proteins in
RPM and RPMA tumors. Approximately five to 33 tumors were quantified from n = 3–5 mice per condition. Data are shown as mean ±
SD. Mann-Whitney two-tailed t-test, (∗∗ ) P < 0.01, (∗∗∗∗ ) P < 0.0001, (ns) not significant. (G) Heat map derived from “SCLC-CellMinerCDB”
showing relative expression of SCLC transcription factor genes compared with ASCL1. (H) Heat map showing relative expression of SCLC
transcription factor genes in human tumors from George et al. (2015) compared with ASCL1. See also Supplemental Figure S3.

8      GENES & DEVELOPMENT
Downloaded from genesdev.cshlp.org on October 11, 2021 - Published by Cold Spring Harbor Laboratory Press
ASCL1 represses SOX9 in SCLC
A C
B
D E
F
Figure 5. ASCL1 represses nonendodermal cell fates and Hippo/Notch/Wnt developmental pathways in MYC-driven SCLC. (A) GSEA in
RPMA versus RPM tumors compared with neural crest and mesenchymal stem cell signatures. NES and P-values are indicated in the fig-
ure. (B) GSEA in ASCL1-low versus ASCL1-high human cell lines (SCLC-CellMinerCDB, where subtype status is defined by SCLC-Cell-
MinerCDB) compared with neural crest and mesenchymal stem cell signatures. NES and P-values are indicated in the figure. (C ) Heat map
showing expression of indicated genes in RPM versus RPMA tumors analyzed by RNA-seq for components of the indicated developmental
pathways. (D) Representative IHC for indicated antibodies (top) in RPM versus RPMA tumors initiated with the indicated cell type-spe-
cific Cre viruses (left). Images were collected from mice at approximately the following time points postinfection: RPM-CGRP, 50 d;
RPMA-CMV, 95 d; RPMA-CGRP, 155 d; RPMA-CCSP, 215 d; and RPMA-SPC, 310 d. Scale bar, 25 μm. (E) H-score IHC quantification
for indicated antibodies in D. Data are shown as mean ± SD. Approximately 11–28 tumors were used for quantification from three to
five animals per condition. Mann-Whitney two-tailed t-test, (∗∗ ) P < 0.01, (∗∗∗∗ ) P < 0.0001, (ns) not significant. (F) Heat map derived
from “SCLC-CellMinerCDB” with expression of selected genes in developmental pathways relative to ASCL1 in human SCLC cell lines.
See also Supplemental Figure S4.
GENES & DEVELOPMENT 9Downloaded from genesdev.cshlp.org on October 11, 2021 - Published by Cold Spring Harbor Laboratory Press
Olsen et al.
are known to function in the same SCLC superenhancers tiple developmental pathway regulators in MYC-driven
(Christensen et al. 2014; Borromeo et al. 2016; Pozo et al. SCLC.
2020).
ASCL1 represses SOX9 in mouse and human SCLC
ASCL1 represses nonendodermal cell fates
In both the developing limb-bud mesenchyme and neural
and Hippo/Notch/Wnt developmental pathway
crest, SOX9 marks osteoblast progenitors and precedes
genes in MYC-driven SCLC
RUNX2 expression and bone differentiation (Long 2012).
We next focused on understanding the cell fate and pre- RUNX1 also precedes RUNX2 expression in developing
dicted regulators gained upon ASCL1 loss. The lung epi- bone (Lian et al. 2003) and has been suggested to function
thelium is believed to derive largely from endoderm, in chondrogenic lineage commitment of mesenchymal
whereas bone and cartilage fates are derived from meso- progenitor cells (Smith et al. 2005); RUNX1 can directly
derm or ectoderm (Serizawa et al. 2019; Zepp and Morri- regulate multiple genes important for bone development
sey 2019). Mesenchymal stem cells (MSCs) from including Sox9 and Runx2 (Soung do et al. 2012; Tang
mesodermal tissue and neural crest stem (NCS) cells et al. 2020). RUNX2 and SP7 (i.e., Osterix) are required
from ectodermal tissue are known to have the potential for differentiation of bone-producing osteoblasts, and
to become neurons, bone, or cartilage (Jiang et al. 2002; RUNX2 normally precedes SP7 expression during bone
Achilleos and Trainor 2012). GSEA revealed that both differentiation (Komori et al. 1997; Nakashima et al.
MSC and NC cell signatures were significantly enriched 2002; Long 2012). In our network analysis, SOX9,
in RPMA versus RPM tumors (Fig. 5A). Consistently, RUNX1, and RUNX2 were predicted drivers of the
GSEA revealed that both MSC and NC cell signatures RPMA attractor state (Fig. 4B). Therefore, we sought to
were significantly enriched in a panel of 109 human determine whether the MSC/NCS-like tumor cells ex-
SCLC cell lines when comparing ASCL1-low versus press these factors upon ASCL1 loss. While RPM tumors
ASCL1-high samples (Fig. 5B). These data suggest that rarely expressed SOX9, RUNX1, or RUNX2, all three fac-
ASCL1 is associated with a more endodermal tumor cell tors were dramatically increased in RPMA tumors (Fig.
fate and may repress an MSC/NC-stem-like fate. 6A,B; Supplemental Fig. S5A). Interestingly, RUNX1 and
During development, both MSC and NC-stem-like pro- SOX9 expression were enriched in noncalcified (“soft”)
genitors have the capacity for bone development given RPMA tumors compared with the more differentiated os-
the appropriate developmental signals. Multiple develop- teosarcomas. RUNX2 levels were high in soft RPMA tu-
mental pathways are known to drive bone fate including mors and remained high in more differentiated
Indian hedgehog (Ihh), Hippo/Yap1, Transforming growth osteosarcomas. In contrast, SP7 was predominantly ex-
factor-β (Tgfβ), Bone morphogenic protein (Bmp), Wnt, pressed in the more differentiated osteosarcomas (Fig.
Notch, and others (Long 2012; Pan et al. 2018; Vanyai 6A). RUNX1 was commonly expressed at the in situ stage
et al. 2020). Numerous components of these pathways in RPMA tumors, while SOX9 and RUNX2 were present
were transcriptionally up-regulated in RPMA tumors in- in a subset of in situ tumors (Supplemental Fig. S5B). To-
cluding Ihh, Yap1, Bmp family members (Bmp3, Bmp5, gether, these data are consistent with RUNX1 and SOX9’s
Bmp2k, Bmp8a, and Bmpr2), Tgfβ receptors (Tgfbr2 and established roles preceding RUNX2+ and SP7+ differentia-
Tgfbr3), Smads (Smad3, Smad6, and Smad7), Wnt ligands tion during bone development.
(Wnt2, Wnt2b, Wnt3a, Wnt5a, Wnt6, Wnt7b, Wnt10a, To determine whether ASCL1 repression of SOX9,
and Wnt10b), and Notch receptors and target genes RUNX1, and/or RUNX2 is conserved in human SCLC
(Notch1, Notch2, Hes1, and Rest) (Fig. 5C; Supplemental cells, we knocked down ASCL1 in human SCLC cell lines
Fig. S4A). Importantly, network analyses predicted that using siRNAs or by gene repression using a lentiviral
YAP1, CTNNB1, HES1, NOTCH1, and REST promote dCas9-KRAB CRISPR interference (“CRISPRi”) approach.
the RPMA fate (Fig. 4B). We examined Hippo, Wnt, and SiRNAs were well-tolerated and did not lead to obvious
Notch pathway proteins for which we could identify cell death in the 72 h of our assays; CRISPRi led to
good antibodies, including YAP1, CTNNB1 (β-catenin), PARP cleavage during the first 24–72 h following selec-
HES1, and REST (Fig. 5D). Consistent with bioinformatic tion but was no longer evident by 3–7 d postselection (Sup-
predictions, YAP1, CTNNB1, HES1, and REST levels plemental Fig. S5C). Cells infected with the ASCL1-1
were significantly increased in RPMA compared with CRISPRi guide died, and we failed to detect most proteins
RPM tumors independent of cell of origin (Fig. 5E). Inter- at 72 h (Fig. 6D), but the ASCL1-2 guide led to significant
estingly, unlike RPM tumors where YAP1 is only detect- ASCL1 repression that was tolerated for weeks. Impor-
ed at the latest stages of progression, a subset of RPMA tantly, SOX9 was induced upon ASCL1 knockdown in
tumors expressed YAP1 at the in situ stage in all cells of all three cell lines examined regardless of MYC status,
origin, and its expression persisted in invasive tumors while RUNX1 levels decreased in the two cell lines where
and osteosarcomas (Fig. 5E; Supplemental Fig. S4B). it was detected (Fig. 6C,D). We did not detect RUNX2 in
Gene expression data from human SCLC cell lines any of the cell lines examined (Fig. 6C,D). These data sug-
showed an inverse relationship between ASCL1 and se- gest that ASCL1 repression of SOX9 is conserved in hu-
lect Hippo, Wnt, and Notch pathway genes (Fig. 5F). To- man cells.
gether, these data suggest that ASCL1 represses the Sox9/SOX9 mRNA is induced in RPMA tumors and hu-
emergence of an MSC/NC-stem-like state as well as mul- man SCLC cell lines transfected with siASCL1 (Fig. 6E,F),
10 GENES & DEVELOPMENTDownloaded from genesdev.cshlp.org on October 11, 2021 - Published by Cold Spring Harbor Laboratory Press
A
B
C D E F
I J
G H
K L
Figure 6. ASCL1 represses SOX9 in mouse and human SCLC tumor cells. (A) Representative IHC for indicated antibodies (top) in RPM
versus RPMA tumors initiated with the indicated cell type-specific Cre viruses (left). RPMA tumors were classified as noncalcified tumors
(soft) or osteosarcomas (osteo). Images were collected from mice at approximately the following time points postinfection: RPM-CGRP, 55
d; RPMA-CMV, 85 d; RPMA-CGRP, 150 d; RPMA-CCSP, 215 d; and RPMA-SPC, 310 d. Scale bar, 25 μm. (B) H-score quantification for the
indicated proteins in RPM versus RPMA tumors from A. Data are shown as mean ± SD and include both soft and osteo tumors. Approx-
imately 11–85 tumors from three to six mice per condition were quantified. Mann-Whitney two-tailed t-test, (∗ ) P < 0.05, (∗∗∗ ) P < 0.001,
(∗∗∗∗ ) P < 0.0001, (ns) not significant. (C) Representative immunoblot following 72 h treatment with control (CTRL) or ASCL1 siRNAs
in the indicated human SCLC cell lines. HSP90 serves as loading control. (D) Representative immunoblot following stable infection
with dCas9-KRAB for CRISPRi-mediated vector control or ASCL1 repression in the indicated human SCLC cell lines at indicated time
points. Cells with ASCL1-1 were dying at 72 h and dead by 7 d. HSP90 serves as loading control. (E) Sox9 expression as normalized counts
by RNA-seq from lung tumors in indicated GEMMs. Mean ± SD. Two-tailed t-test, (∗ ) P < 0.05. (F ) SOX9 expression by RNA-seq from hu-
man SCLC cell line NCI-H2107 treated for 72 h with control (CTRL) or ASCL1 siRNAs performed in biological duplicate. Results are re-
ported as log2 normalized counts with mean ± SD. (G) GSEA for SOX9 target genes from Larsimont et al. (2015), in RPMA versus RPM
tumors. NES and P-values indicated in the figure. (H) Predicted SOX9 target genes enriched or depleted in RPMA versus RPM tumors
by IPA. (I ) SOX9 expression in human SCLC cell lines grouped by ASCL1 expression levels in “SCLC-CellMinerCDB.” Data are shown
as average z-score ± SD. Mann-Whitney two-tailed t-test, (∗ ) P < 0.05. (J) RUNX2 expression in human SCLC cell lines grouped by SOX9
expression levels in “SCLC-CellMinerCDB.” Data are shown as average z-score ± SD. Mann-Whitney two-tailed t-test, (∗∗∗ ) P = 0.0005. (K)
GSEA for SOX9 target genes from Larsimont et al. (2015), in ASCL1-low versus ASCL1-high human SCLC cell lines from SCLC-CellMi-
nerCDB, where ASCL1 subtype is defined by SCLC-CellMinerCDB. NES and P-values are indicated in the figure. (L) GSEA for SOX9 target
genes from Larsimont et al. (2015), in ASCL1-low versus ASCL1-high human tumors from George et al. (2015). NES and P-values are in-
dicated in the figure. ASCL1 status defined by analysis in Irelend et al. (2020). See also Supplemental Figure S5.
GENES & DEVELOPMENT 11Downloaded from genesdev.cshlp.org on October 11, 2021 - Published by Cold Spring Harbor Laboratory Press
Olsen et al.
respectively, suggesting that ASCL1 represses its expres- from Ascl1 + to Neurod1 + to Yap1 + states—however,
sion. Analysis of ASCL1 ChIP-seq data did not identify sig- RPMA cells progressed farther along this trajectory and
nificant ASCL1 binding sites near SOX9 (Supplemental occupied multiple new branchpoints (Fig. 7F,G). The
Fig. S5D,E), suggesting that repression of SOX9 by most distal branchpoint was occupied only by RPMA cells
ASCL1 is likely indirect. Moreover, ASCL1 overexpres- and was characterized by high Runx2 and Sp7 and a differ-
sion was not sufficient to repress SOX9 in three human entiated bone signature (Fig. 7F,G). Consistent with IHC
SCLC cell lines (Supplemental Fig. S5F). GSEA showed analyses, Yap1, Runx1, and Sox9 appeared to largely pre-
that established SOX9 target genes were significantly cede Runx2 and Sp7 in pseudotime, while Nfib was ex-
up-regulated in RPMA compared with RPM tumors (Fig. pressed uniformly throughout the trajectory (Fig. 7G).
6G), suggesting that SOX9 activity is increased in Finally, MSC, neural crest, and SOX9 target gene signa-
RPMA tumors. Furthermore, Ingenuity Pathway Analysis tures were significantly enriched in the latest stages of
(IPA) identified SOX9 as a top transcriptional regulator pseudotime (Fig. 7H,I). Together, these data suggest
implicated in the transcriptional differences between ASCL1 constrains the transcriptional potential of MYC-
RPMA and RPM tumors (Fig. 6H; Supplemental Table driven SCLC evolution to a SOX9+ MSC/NC-stem-like
S3). IPA also predicted other key transcription factor regu- state.
lators that distinguish RPMA from RPM, such as REST,
NKX2-1, CTNNB1, FOXA2, RUNX2, and NOTCH1 (Sup-
plemental Table S3), consistent with changes in their pro- Discussion
tein levels. In human SCLC cell lines, SOX9 expression
was enriched in samples that were ASCL1-low (Fig. 6I), The PNEC has been accepted as a major cell of origin for
and high SOX9 expression correlated with increased SCLC. This is consistent with multiple similarities be-
RUNX2 expression (Fig. 6J). GSEA revealed that SOX9 tar- tween SCLC and PNECs and with the capacity of PNECs
get genes were significantly enriched in ASCL1-low hu- for SCLC transformation in mouse models (Park et al.
man cell lines (Fig. 6K) and in ASCL1-low human SCLC 2011; Sutherland et al. 2011; Song et al. 2012). Our data
tumors (Fig. 6L). Together, these data suggest that suggest that specific genetic alterations, namely MYC ex-
ASCL1 represses a SOX9+ MSC or NCS-like state that ap- pression in the context of Rb1 and Trp53 loss, can pro-
pears to have the capacity for bone or cartilage differenti- mote SCLC in other cells of origin, including club and
ation, likely dependent on the environmental context. alveolar cells, and potentially other cell types as well. It
is possible that Ccsp and Spc are targeting CCSP/SPC-
double-positive bronchioalveolar stem cells (BASCs) lo-
ASCL1 constrains MYC-driven evolution
cated at the bronchoalveolar duct junction (BADJ) (Kim
We previously showed using pseudotime-based single-cell et al. 2005), but this warrants further study. While club
RNA sequencing (scRNA-seq) approaches that MYC cells in RP and RPR2 mice were relatively refractory to
drives SCLC evolution from a NE-high Ascl1+ to Neu- SCLC development (Park et al. 2011; Sutherland et al.
rod1+ to Yap1+ non-NE state (Rudin et al. 2019; Ireland 2011), targeting CCSP+ cells in RPM mice led to SCLC
et al. 2020). We sought to determine how ASCL1 loss im- with short latency, comparable with tumor initiation in
pacts this transcriptional trajectory. To address this, we NE cells. This suggests that club cells may be particularly
isolated one Myc-low RPR2-CGRP, five Myc-high RPM- susceptible to MYC-mediated SCLC transformation. Re-
CGRP, one Myc-high, Ascl1 knockout RPMA-CGRP cent studies reveal that tuft and basal cells may also serve
and RPMA-CMV tumor(s) and analyzed samples by as cells of origin in SCLC (Huang et al. 2018; Park et al.
scRNA-seq similar to previous methods (Ireland et al. 2018), which could be targeted by CMV in our study; fur-
2020). We performed unbiased clustering and annotated ther investigation is needed to determine the spectrum of
tumor and nontumor cells (immune, endothelial, alveo- cells impacted by CMV-Cre. Together with recent find-
lar, etc.) (Fig. 7A; Supplemental Fig. S6A–C). Then, we ings (Ireland et al. 2020), our data are consistent with
reclustered RPR2, RPM, and RPMA tumor cells specifi- the notion that cell of origin, genetic alterations, and tu-
cally (Fig. 7B; Supplemental Fig. S6D). Tumor cell cluster- mor cell plasticity can determine SCLC phenotype. More-
ing was based on the global transcriptome of each cell but over, SCLC diagnosis in the clinic does not necessarily
independent of cell cycle genes (Supplemental Fig. S6E). mean that tumors arose in NE cells, and this may need
RPMA tumor cells clustered distinctly from RPR2 tu- to be considered as we develop predictive models for tu-
mors, and more similarly to RPM tumors, but with dis- mor evolution.
tinct new populations and signatures (Fig. 7B,C), with Regardless of the cell of origin, RPM tumors demon-
both RPMA tumors similar to each other. Consistent strate NE features at the earliest stages of development,
with bulk RNA-seq data, RPMA tumor cells have signifi- suggesting that NE tumors can arise from non-NE cells.
cantly reduced NE scores and significantly increased This indicates that multiple differentiated cells in the
bone-related transcriptional programs (Fig. 7D,E). adult lung have the capacity to dedifferentiate into a NE
Next, we constructed pseudotime trajectories to identi- fate. It is notable, however, that some cell types like
fy predicted transcriptional relationships among the RPM AT2 cells appear extremely refractory to transformation
and RPMA tumor cells. Unsupervised pseudotime order- even in the context of profound oncogenic changes like
ing of the combined tumor cells predicted a trajectory Rb1/Trp53/Myc; in contrast, AT2 cells are remarkably
that corresponded with the known MYC-driven evolution sensitive to transformation by MAPK pathway activation,
12 GENES & DEVELOPMENTDownloaded from genesdev.cshlp.org on October 11, 2021 - Published by Cold Spring Harbor Laboratory Press
A D E
B
F
C
G
H I
Figure 7. ASCL1 constrains MYC-driven evolution. (A) Primary RPMA (n = 2), RPR2 (n = 1), and RPM (n = 5) lung tumor and nontumor cell
populations captured by scRNA-seq and shown in UMAP space. Predicted cell types were determined based on gene expression in Supple-
mental Figure S6. (B) Following removal of nontumor and low-quality cells, UMAP of RPM, RPMA, and RPR2 tumor cells only, labeled by
genotype and virus used to initiate tumors. Number of cells captured per sample indicated in legend. (C) Heat map of top 100 significant
DEGs for each tumor type from B (or fewer ifDownloaded from genesdev.cshlp.org on October 11, 2021 - Published by Cold Spring Harbor Laboratory Press Olsen et al. as observed upon expression of mutant EGFR or KRAS in (Masserdotti et al. 2015; Harris and Guillemot 2019). In GEMMs. Tumor cell fate plasticity is appreciated in the SCLC, ASCL1 and Notch have an established relationship clinic as it is known that EGFR-driven lung adenocarcino- whereby Notch signaling promotes non-NE fate at least mas (believed to arise in AT2 cells) can convert to SCLC partially through induction of the transcriptional core- upon resistance to EGFR inhibitors (Oser et al. 2015; Mar- pressor REST (Lim et al. 2017). We observe induction of coux et al. 2019). A subset of prostate adenocarcinoma NOTCH/REST in RPMA tumors, and we speculate that that acquires resistance to androgen therapy also converts this event is key to inhibiting NE fate. As Hippo, Notch, to a NE fate through transdifferentiation (Terry and Bel- Wnt, and other developmental pathways impinge upon tran 2014), and these tumors frequently harbor RB1 and RUNX2 to drive bone fate, future studies will be required TP53 loss. Finally, alteration of RB1, TP53, MYC, BCL2, to elucidate the signals that promote bone differentiation and AKT in prostate or lung basal epithelial cells in vitro in the context of ASCL1 loss. It is notable that osteosarco- can lead to tumors that resemble NE prostate cancer and mas were most prevalent when an unknown cell type(s) SCLC upon xenograft (Park et al. 2018). These observa- and NE cells were targeted with CMV or CGRP, respec- tions illustrate the potent capacity of oncogenic changes tively, whereas adenocarcinomas were found with all cells to alter cell fate, and in particular, how RB1, TP53, and of origin except from NE cells. Future studies are neces- MYC cooperate to promote NE fate. sary to decipher how ASCL1 loss impacts these different ASCL1 has been considered as a therapeutic target in fates in a cell type-specific fashion. SCLC since it is a lineage-specific oncogene that is highly Our findings suggest that alterations in Rb1, Trp53, and expressed in a significant fraction of tumors (Augustyn Myc cooperate to dedifferentiate tumor cells to a state that et al. 2014). This notion is supported by studies showing has the potential to be NE in the presence of ASCL1, or that genetic deletion of Ascl1 in classic GEMMs abolishes bone-like in its absence. One outstanding question tumor formation (Borromeo et al. 2016). Here, we find that prompted by these findings regards the nature of this de- ASCL1 is not required for MYC-driven tumor develop- differentiated cell state; during development, the lung ep- ment in the RPM model, even though it appears to be re- ithelium is believed to arise from endodermal progenitors, quired for NE cell fate. Notably, the vast majority of whereas bone is derived from mesoderm or ectoderm. ASCL1+-escaper tumors were from RPMA-CGRP mice, Therefore, is there a developmental cell type with NE, suggesting NE cells are more dependent on ASCL1 than bone, and cartilage potential that could be related to other cells of origin; this is consistent with the fact that SCLC? At least two cell types are known to have the ca- NE cells already express ASCL1, while ASCL1 appears pacity for neural, bone, and cartilage fates during develop- to be transiently induced in other cell types upon Rb1/ ment, MSCs (whose origin is not well understood) and p53/Myc alterations. An important caveat in both studies neural crest stem cells, which can give rise to neurons, fa- is that Ascl1 is deleted at the time of tumor initiation. It cial bone, or cartilage (Bruder et al. 1994; Long 2012; remains to be tested whether ASCL1 is necessary for the Hutchins et al. 2018). Gene expression analyses of growth of established tumors, with and without MYC ex- RPMA tumors reveal that they harbor MSC and NC pression, which will require the development of more ad- stem cell-like gene expression signatures. Other “small, vanced conditional GEMM systems. ASCL1 is lowly round blue cell” tumors such as Ewing’s sarcoma resem- expressed in MYC-driven human SCLC (Cardnell et al. ble MSCs (Tirode et al. 2007) and neuroblastoma arises 2017; Mollaoglu et al. 2017), suggesting that ASCL1 inhi- from neural crest. The human SCLC H446 cell line, which bition may not be sufficient to block the growth of MYC- is MYC-high, has been shown to exhibit multilineage dif- driven SCLC. Indeed, chemotherapy-relapsed SCLC was ferentiation including neural, bone, and fat cell fates found to exhibit significantly reduced ASCL1 expression (Zhang et al. 2013). While SCLC was once speculated to (Wagner et al. 2018), implying ASCL1 may not be required arise from neural crest, our data together with previous for SCLC progression. Our data here suggest that loss of studies suggest it has the capacity to evolve to a neural ASCL1 could potentially convert SCLC to an alternative crest-like state under specific genetic conditions. While cell fate, but fate-tracking approaches will be needed to de- this issue requires further study, it suggests the surprising finitively address this possibility. notion that, in the absence of ASCL1, SCLC can dediffer- We were surprised to find that genetic disruption of entiate to a SOX9+ neural crest stem-state that precedes Ascl1 led to emergence of an osteosarcoma-like fate. commitment to endodermal lineages. Both RB1 and TP53 alterations are remarkably common These findings have led us to question whether SCLC in osteosarcomas (RB1, 70%–90%; TP53, 50%–70%) (Ber- can evolve to a bone-like state in patients. ASCL1 has man et al. 2008a; Velletri et al. 2016). In addition, loss of not been purposely inhibited or knocked out from SCLC Rb1/Trp53 in mouse osteoblasts or MSCs promotes tu- tumors in the clinic. In addition, a slow-growing bone phe- mors that highly resemble human osteosarcoma, includ- notype would be under strong negative selective pressure ing high RUNX2 expression (Berman et al. 2008a; to emerge compared with rapidly growing SCLC, and Walkley et al. 2008; Calo et al. 2010). During osteogenesis, therefore this should be an extremely uncommon event. RUNX2 binds pRB1 and HES1 (Thomas et al. 2001; Lee There are rare case reports of patients developing carci- et al. 2006; Berman et al. 2008b), and we observe up-regu- noids with ossification (Tsubochi et al. 2013; Özşen lation of HES1 and other indicators of active Notch signal- et al. 2020) and extraskeletal osteosarcoma (ESOS) in the ing in RPMA tumors. ASCL1 and NOTCH/REST exhibit lung (Qian et al. 2017), including one ESOS following che- a mutually antagonistic relationship in multiple contexts motherapy treatment of SCLC (Takamura et al. 2018), but 14 GENES & DEVELOPMENT
You can also read